IEEE TRANSACTIONS ON ELECTROMAGNETIC COMPATIBILITY, VOL. 51, NO. 3, AUGUST 2009
611
A Nonlinear Microcontroller Power Distribution Network Model for the Characterization of Immunity to Electrical Fast Transients Jayong Koo, Student Member, IEEE, Lijun Han, Scott Herrin, Member, IEEE, Richard Moseley, Member, IEEE, Ross Carlton, Senior Member, IEEE, Daryl G. Beetner, Senior Member, IEEE, and David Pommerenke, Senior Member, IEEE
Abstract—A nonlinear power distribution network model for characterizing the immunity of integrated circuits (ICs) to electrical fast transients (EFTs) is proposed and validated. The model includes electrostatic discharge (ESD) protection diodes and passive impedances between power domains. Model parameters are based on external measurements using a vector network analyzer and curve tracer. Impedance is measured between pins while the IC is biased and operating, and is used to determine individual elements of the network model. Inclusion of active power-clamp circuitry is also explored. The model is able to successfully predict pin currents and voltages during EFTs on the power pin when the IC is operating or turned off and when the ESD power clamp is either activated or not activated. This model might be used to evaluate the immunity of the IC in a variety of systems and to better understand why failures occur within the IC and how to fix them. Index Terms—Electrostatic discharge (ESD), modeling, power distribution.
I. INTRODUCTION ODELS of integrated circuits (ICs) are becoming common for estimating emissions [1]. Several modeling paradigms exist, including the IC electromagnetic model (ICEM) [2], [3] and the linear equivalent circuit and currentsource (LECCS) [4], [5] model. The ICEM model was created to estimate the conducted emissions from an IC without significant model complexity. In this model, the noise generated from internal activity is distributed through a passive power distribution network (PDN) and interblock coupling network. The LECCS model was proposed to evaluate the radio-frequency (RF) noise current generated by core logic on power pins [1]. Both models are similar in design and function. Beyond estimating conducted currents, these models can be combined with a model of the printed circuit board (PCB) to estimate noise
M
Manuscript received July 30, 2008; revised January 21, 2009. First published July 14, 2009; current version published August 21, 2009. J. Koo is with Intel Corporation, Hillsboro, OR 97124 USA (e-mail: jayong.
[email protected]). L. Han is with Garmin International, Inc., Olathe, KS 66062 USA (e-mail:
[email protected]). S. Herrin and R. Moseley are with Freescale Semiconductor, Inc., Austin, TX 78735 USA (e-mail:
[email protected]; richard.moseley@ freescale.com). R. Carlton is with the National Instruments Corporation, Austin, TX 78759 USA (e-mail:
[email protected]). D. G. Beetner and D. Pommerenke are with the Electromagnetic Compatibility Group, Missouri University of Science and Technology, Rolla, MO 65409 USA (e-mail:
[email protected];
[email protected]). Digital Object Identifier 10.1109/TEMC.2009.2023670
on the power bus [2], [3], [6] and the influence of decoupling capacitors [2], [3], [7], among other applications. IC models may also be used to predict the immunity of ICs. For example, the ICEM model has been used to predict jitter in a phase-locked loop due to power-bus noise [7]. Nakayama et al. [8] have shown that the LECCS model can estimate the noise on the IC power rail caused by direct RF power injection [9]. The use of models to anticipate the IC’s response to electrical fast transients (EFTs), however, has not been explored. EFTs are generally caused by the switching of inductive loads like motors or solenoids. These switching events can cause repetitive voltage or current spikes that may result in bit errors, chip reset, clock jitter or interruption, or even permanent damage to the IC. IEC system-level immunity tests [10]–[12] define EFT pulses with rise times from nanoseconds to milliseconds and pulsewidths from tens of nanoseconds to milliseconds. EFT events are represented using either a single pulse or a burst of pulses. While no standard yet exists for evaluating the immunity of ICs to EFTs, the system-level standards are often referred to for this purpose [13], [14]. The validity of these system-level tests for evaluating ICs, however, has not been well studied. Protection against electrostatic discharge (ESD) events is often a primary concern of the IC designer. ESD events occur when two charged bodies are (suddenly) connected electrically. The large voltage differences between the bodies and the resulting large currents that potentially change very quickly can cause significant damage to ICs. ICs are particularly susceptible to ESD during handling, when the IC is not connected to the PCB. Protection diodes [15] are typically placed at external pins in order to divert ESD current to the power rails before it causes large voltage differences that would damage gates. Many ICs also use power clamps between the power and return rails. A common power clamp uses an RC-like trigger circuit to turn on the power clamp when the power rail voltage changes faster than a rate set by the RC time constant and the power rail is not powered [16]. The response of the ESD protection circuitry to EFTs that occur when the IC is powered, however, is rarely considered. Deutschmann reports that conducted transient disturbances can cause the destruction of ESD protection structures, MOSFET gate oxides, and metal traces [13]. In his work, the thermal destruction of large areas of silicon after a transient event was used to link IC damage with particular test pulses. Using this information to improve transient immunity is, however, difficult because the location of failures cannot be used easily to
0018-9375/$26.00 © 2009 IEEE
612
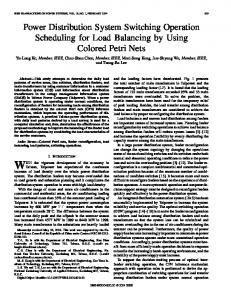
Fig. 1.
IEEE TRANSACTIONS ON ELECTROMAGNETIC COMPATIBILITY, VOL. 51, NO. 3, AUGUST 2009
Nonlinear PDN model of the 8-bit microcontroller.
determine the current path and why the IC failed at a location, nor can it be used to test possible solutions to the failure. Determining the performance of an IC in specific systems before they are built and determining the cause of EFT failures and their solution requires models of the IC for that purpose. Current models may not meet this criterion since they are largely designed to estimate emissions. In this paper, a simple nonlinear PDN model of an 8-bit microcontroller is proposed and tested for estimating currents during transient events on the power network. The model is expected to yield useful information about the performance of the IC in specific systems, about how current flows on the IC power rail during transient immunity tests, and about the operation of IC protection circuitry. The following paragraphs will describe the IC model, the methods used to extract model parameters from IC measurements, and the validation of the model through simultaneous measurement of pin currents and voltages while EFTs are applied to the IC. Application of the model to predict currents inside the IC and the performance of ESD protection circuitry during an EFT event is also discussed.
on the IC as well as intentional protection diodes added in the I/O ring. The parallel diodes, D1 , D2 , D5 , and D6 , are caused both by p−n junctions at wells and FETs and by added ESD protection diodes. These added protection diodes provide a link between the relatively small decoupling capacitance in the A/D converter circuit and the relatively large decoupling capacitance of the core, allowing the A/D converter to withstand a larger influx of charge and providing a better return path for ESD currents. The bond wire and lead frame model includes the capacitance to the PCB, Cw , as well as the inductance and resistance, Lw and Rw , associated with the structure. Initial tests only included the PDN model components discussed here. Later, in the Section V, a model of the active ESD power-clamp circuitry was also included as part of the PDN. While this model was used with a relatively simple microcontroller, the model should also apply equally well to other more sophisticated ICs, up to the frequency limit of the model.
II. PDN MODEL
Model parameters describing the passive PDN were found through external measurements of the IC. Measurements were performed while the IC was configured in the STOP mode to prevent internal switching noise from interfering with measurements. The IC included two return pins for the core, VSS1 and VSS2. The characteristics of each of these pins were found separately. Impedances were determined from two-port S-parameter measurements and characteristics of diodes were determined from I–V curves, as described shortly.
The 8-bit microcontroller modeled here has two power domains, one for the core (5 V) and the other for the analog-todigital (A/D) converter (also 5 V). The PDN model for this IC is illustrated in Fig. 1. The pins labeled VDD and VSS are power and return pins for the core and the pins labeled VDDAD and VSSAD are the power and return pins for the A/D converter. The average switching current consumed by each power domain is modeled as a voltage-dependent current source. Coupling between power rails is modeled using passive elements, Zi . Capacitive coupling to the PCB is modeled with the DIEto-PCB capacitance, Cd . ESD protection diodes are included to simulate current paths during EFT events. Diodes D3 and D4 arise from the p–n junctions associated with wells and FETs
III. MEASUREMENT OF THE MODEL PARAMETERS
A. Current Consumption The current consumed by the IC in the STOP mode is related to the supply voltage. DC current consumption was measured with a current meter connected to each power domain supply
KOO et al.: NONLINEAR MICROCONTROLLER POWER DISTRIBUTION NETWORK
613
Fig. 2. Measurement of impedance parameters for the VDDAD/VSSAD pins using a supply voltage of 0 or 5 V.
voltage. Current consumption by the core was modeled using a diode in SPICE, where model parameters were modified to mimic the current consumption observed when the IC was powered on at its normal power supply voltage. A diode was used rather than a constant current source to allow the current to change with the supply voltage—as it would with a change in bias conditions or with a high-level disturbance. It should be noted, however, that the range of supply voltages for which this model is valid is limited. No current model was used for the A/D converter, as only negligible current was observed through VDDAD in the STOP mode. B. Interblock Domain Network As the characteristics of the IC change with bias—particularly the values of capacitances associated with nonlinear devices— measurements were made when the IC was powered with 5 V and when it was unpowered. The IC was placed over the solid copper plane of a PCB and full two-port S-parameter measurements were performed for each pair of pins. The measurement of impedance parameters for the VDDAD/ VSSAD pin pair is shown in Fig. 2. The center conductor of two semirigid coaxial cables was soldered to the VDDAD and VSSAD pins of the IC and the cable shields were soldered to the PCB return plane. The VNA was calibrated to the end of the coaxial cables, where they connected to the IC. Each pin requires either a supply voltage of 5 or 0 V to maintain proper operation during the measurement. RF current paths through other pins (e.g., from the VNA and back through the power supply connections) are blocked by the bias T inside the VNA while maintaining a supply voltage of 5 V on VDDAD and 0 V on VSSAD. For measurement of VDDAD/VSSAD, the VSS1 and VSS2 pins were directly shorted to the PCB return plane. The VDD pin was connected directly to the power supply but effectively shorted to the PCB return plane at high frequencies using a 2.2 µF SMT capacitor mounted at the IC. The characteristics of other pins were found similarly by changing the connection of pins to the network analyzer and to the power supply. Y -parameters for each pin pair were then found from the full S-parameter measurements. Values of Zi between pins were
Fig. 3. Measured impedance, −1/Y 1 2 , between VDDAD and VSSAD when the supply voltage was 5 and 0 V.
found as −1/Y12 from low-frequency measurements, where the impact of the bond-wire inductance on measurements was negligible. An example measurement of the impedance, −1/Y12 , between VDDAD and VSSAD is shown in Fig. 3 when the supply voltage was 5 V and when it was 0 V. The π-equivalent circuit shown in Fig. 3 used to estimate impedance is valid up to the resonant frequency of the lead-frame inductance and on-chip capacitance, or 600 MHz in this case. This is the maximum working frequency for this model. The impact of the PCB return plane as part of the measurement is also minimal below this frequency. Below 100 MHz, the impedance is predominantly capacitive, as indicated by the −20 dB/decade slope. The capacitance varies from approximately 7.7−10 pF depending on the bias voltage due to the nonlinear capacitance of the p−n junctions within the die and the activation of capacitance created using FET gates. Above about 100 MHz, the voltage dependence of the impedance goes away as the approximately 7.4 nH inductance of the lead frame begins to dominate the curve.
C. ESD Protection Diodes The I–V characteristic of the circuit diodes were measured using a curve tracer. These diodes were then modeled in SPICE by modifying the parameters of a generic diode model to match the measured curve. The voltage-dependent depletion capacitances are included in the interblock domain capacitance and depend on the bias voltage, either 0 or 5 V. The diffusion capacitances and reverse recovery were ignored. Fig. 4 shows a comparison of the measured and simulated I–V characteristics of diodes D1 , D2 , and D3 . The turn-ON voltage of D3 is lower than the other diodes, most likely due to the relatively large cross-sectional area of this diode caused by the many p–n junctions within the core.
614
IEEE TRANSACTIONS ON ELECTROMAGNETIC COMPATIBILITY, VOL. 51, NO. 3, AUGUST 2009
Fig. 6. Measurement of the DIE-to-PCB capacitance, C d , and leadframe/bond-wire-to-PCB capacitance, C w .
Fig. 4. Measured and simulated I–V characteristics for the diodes between power and ground pins.
VDDAD and VSSAD pins. All other pins are shorted to the PCB return plane. At low frequencies, the input impedance is dominated by the approximately 10 pF capacitance between VDDAD and all other pins connected to the PCB return plane. At high frequencies, the impedance is dominated by the approximately 7 nH inductance associated with the current path formed by the lead frame and bond wire of the VDDAD pin, and the lead frame and bond wires associated with the distributed return path through the other pins. The high-frequency impedance profiles are different the two plots because of the different distributed return current path. The model is most accurate up to the 600 MHz inductance/capacitance resonance. Above this frequency, a more complicated network model is required. An upper frequency limit of 600 MHz is adequate, however, considering the rise time of an EFT pulse is 5 ns [10] or more. The DIE-to-PCB capacitance Cd and the lead-frame/bondwire-to-PCB capacitance Cw were estimated together by measuring S11 seen from the lead frame using a network analyzer as shown in Fig. 6. The network analyzer was connected to one pin (e.g., VDD), while all other pins were floated. The measured S11 was then converted to impedance, which was used to estimate the value of the combined capacitance Cd + Cw . E. Complete Models
Fig. 5. Comparison between measured and simulated input impedance to the VDDAD pin. The top plot shows input impedance when VDDAD and VDD were connected to the network analyzer. The bottom plot shows input impedance when VDDAD and VSSAD were connected to the network analyzer.
D. Lead Frame and Bond Wire Values of resistance and inductance, Rw and Lw , were found for each pin through a numerical fit of impedance profiles calculated from measured values of S11 or S22 , as shown in Fig. 2. SPICE simulations were performed to optimize values of Rw and Lw with regard to the assumed network geometry and the values of components determined in Section III-B. Fig. 5 shows an example comparison of the measured and simulated input impedance to the VDDAD pin. As shown in the figure, results at high frequency depend somewhat on the connections of the network analyzer to the IC. The top plot shows impedance when the network analyzer is connected to the VDDAD and VDD pins. The bottom plot shows the input impedance when the network analyzer is connected to the
The complete model of the PDN extracted for supply voltages of 5 and 0 V is shown in Fig. 7. Values for a 0 V supply are shown in parentheses. Note that the capacitances in the interblock network change with the supply voltage due to the nonlinear capacitance of p–n junctions and to the activation of FETs that give access to or change the connections to capacitance across FET gate oxides. Interblock capacitances were calculated from measurements around 10 MHz. The relatively large size of the capacitance between VDD and VSS compared to VDDAD and VSSAD is also worth noting, which is most likely due to the relatively large size of the core and the possible presence of on-chip decoupling capacitance intentionally added to the core to ensure functionality. IV. VALIDATION A. Measurement Setup The model was validated by capacitively coupling EFT pulses to the power rail using an EFT generator (EFT 500-M from EM TEST), in compliance with IEC 61000-4-4 [10]. The setup used to measure the IC response to EFTs is shown in Fig. 8. The
KOO et al.: NONLINEAR MICROCONTROLLER POWER DISTRIBUTION NETWORK
615
Fig. 7. Complete nonlinear PDN model for the 8-bit microcontroller. The components in the shaded areas have different values for a 5 and 0 V supply. Their values when the supply voltage is 0 V are shown in parentheses. The components in the on-die interblock network are drawn with bold lines.
Fig. 8. Diagram of a test setup to measure pin voltages and currents during capacitive injection of EFT current to the VDD pin. Fig. 9.
IC was mounted on a test PCB that has a trace and current measurement loop, discussed in the following section, for each power and ground pin. The EFT generator was connected to the VDD trace on the test PCB through a high-voltage attenuator and a 10 nF capacitor. The power supply was RF-decoupled from the IC using ferrite beads. The test PCB was not configured with power planes or local decoupling capacitors to ensure that the EFT current flowed through the IC. Pin currents were measured using a loop-embedded underneath traces connected to pins of interest, as shown in Fig. 9. Voltage across the loop is measured by connecting the inner conductor of a semirigid coax cable to one via of the loop and the outer shield to the bottom loop-trace. The coaxial cable is connected to the 50-Ω input of an oscilloscope or network analyzer. Mutual inductance between the trace and the loop is found through measurements of S21 at calibration locations on
Current measurement loop embedded in the four-layer test PCB.
the PCB. Pin current is calculated from the mutual inductance and the voltage measured across the loop during the EFT event. Self-inductance of the loop was ignored, as it was not important below 1 GHz. Pin voltages and currents were measured using a 6-GHz, 20-GSa/s oscilloscope. Voltages were measured on the VDD and VDDAD pins. Currents were measured on the VDD, VDDAD, and VSS1 pins. Measurements were performed with supply voltages of 5 and 0 V. The severity of the EFT injection was adjusted by changing the voltage set on the EFT generator and the size of the attenuator. The severity was set such that the ESD protection diodes would be fully turned on but the IC would not be permanently damaged. Different severity levels were used to trigger the power clamps or to leave them inactive.
616
IEEE TRANSACTIONS ON ELECTROMAGNETIC COMPATIBILITY, VOL. 51, NO. 3, AUGUST 2009
Fig. 10. Comparison of measured and SPICE simulation results for a capacitively coupled EFT pulse (500 V with 40-dB attenuator) injected on the VDD pin with a supply voltage of 5 V.
B. Results Fig. 10 compares measured pin voltages and currents with SPICE simulation results performed using an injection source and a power supply voltage of 5 V. The simulations included the entire measurement circuit (e.g., ferrite beads, probe loading, etc.). The EFT generator was modeled as a piecewise linear voltage source connected in series with a 50-Ω source impedance. The EFT voltage source was created based on a measurement in which the EFT generator was directly connected to an oscilloscope via a 40-dB attenuator. The measured EFT waveform was scaled and imported into SPICE to be used as the EFT voltage source. For the test in Fig. 10, the EFT generator was set to a charge voltage of 500 V and connected through a 40-dB attenuator. As shown in Fig. 10, the VDD pin current for t < 0 ns was approximately 3.5 mA. The embedded loop probe cannot measure dc current, so the measurement results were offset by 3.5 mA before plotting. As the EFT current flows into the VDD pin, the voltage on VDD rises and the diode between VDD and VDDAD turns on. From t = 20 ns to t = 200 ns, current flows out of VDDAD, and the voltage between VDD and VDDAD is approximately 0.7 V. Most of the current flowing into VDD returns via the VSS1 pin, which is the least impedance path for both dc and RF. The SPICE simulation results closely matched the measured results in all tested cases. The error between the measured and simulated peak-to-peak voltages is less than 150 mV. The rms error over the whole curve is 23.5 mV. The error between the peak-to-peak currents is less than 1.67 mA. The rms error is 0.8 mA.
Fig. 11. Comparison of measured and SPICE simulation results for a capacitively coupled EFT pulse (500 V with 40-dB attenuator) injected on the VDD pin with a supply voltage of 0 V.
Fig. 11 compares the measured and SPICE simulation results when the supply voltage was set to 0 V. The measurement setup is shown in Fig. 8. The measured and simulated currents and voltages match also match well here. The error between the measured and simulated peak-to-peak voltages is less than 360 mV. The rms error over the whole curve is 70.6 mV. The error between the peak-to-peak currents is less than 9 mA. The rms error is 4.5 mA. The overall shapes of the waveforms and the peak-to-peak amplitudes are similar to the ones shown in Fig. 10. However, the voltage drop on the VDD and VDDAD pins are clamped to −0.5 V at approximately 220 ns, which indicates the internal ESD protection diode between these pins is turned on. In both Figs. 10 and 11, the transient response lasts for more than 1 µs, which is much longer than the EFT pulse duration of approximately 200 ns. The long transient response is caused by the decoupling ferrite beads mounted between the VDD and VDDAD pins and the power supply, showing that the method used to decouple the power supply may affect the EFT test results. V. APPLICATION OF THE MODEL A. Internal Current Estimation for Low-Level Disturbance One advantage of modeling the power delivery network is that currents inside the IC can be estimated during an EFT event, whereas such currents cannot be easily measured. The ability of the model to accurately predict external voltages and currents implies that it might also be used to accurately predict internal voltages and currents as well. Fig. 12 shows the simulated
KOO et al.: NONLINEAR MICROCONTROLLER POWER DISTRIBUTION NETWORK
617
Fig. 12. Simulated currents inside the microcontroller during an EFT event (500 V with 40-dB attenuator) with a supply voltage of 5 and 0 V. Fig. 14. Comparison of measured and SPICE simulation results for a capacitively coupled EFT pulse (1 kV with 40-dB attenuator) injected on the VDD pin with a supply voltage of 5 and 0 V.
Fig. 13.
Diagram of power clamp.
values of currents inside the IC for the EFT events measured in Figs. 10 and 11. When the supply voltage was 5 V, the diodes between the power pins and ground pins were not turned on by this disturbance and the EFT current entering the VDD pin, IEFT , was almost entirely routed through the internal capacitance between the VDD and VSS pins, Ci3 , as shown by the current ICi3 . When the supply voltage was 0 V, however, the ESD protection diode between the VDD and VSS pins turned on and the EFT current flowed almost entirely through the protection diode from approximately t = 230 nS to t = 600 nS, as can be seen from the plot of IEFT and −ID3 . This diode clamping can be also observed in Fig. 11(c) where the voltage on VDD pins is clamped to around −0.7 V. B. ESD Power Rail Clamp Evaluation for High-Level Disturbance The PDN model can also be used to evaluate the performance of an ESD power clamp during an EFT event. A typical power clamp is shown in Fig. 13. An ESD power clamp is designed to turn on and clamp the power rail to the return rail in the presence of a fast rising pulse [15]. The action of the clamp varies with the strength and duration of the pulse and with the power supply voltage. Many power clamps are designed to only be active when the power is off since the power rail clamps are mainly used to pass human body model, charged device model,
and machine model tests. During these tests, the IC is powered off and current is injected into various pins. The power clamp is deactivated during operation for a variety of reasons. If the IC is powered, an accidental activation of the power clamp might destroy the IC. In many but not all applications, there are also sufficiently large decoupling capacitors between VDD and VSS in the functioning circuit that damaging voltage transients are not likely to happen. To show the ability of the model to predict power clamp performance, measurements of pin currents and voltages were made during an EFT event that triggered the power clamp protection circuitry. Measurements were made with the setup shown in Fig. 8 when the EFT generator voltage was raised to 1 kV (i.e., the applied voltage through a 40-dB attenuator was raised to 10 V) in order to trigger the power clamp. The SPICE simulation was performed using the nonlinear PDN model combined together with a SPICE model of the ESD power rail clamp obtained from the IC I/O designers. The SPICE simulation model predicted the measured pin currents and voltages well, as shown in Fig. 14. Measured peak-to-peak voltages were predicted within 90 mV. The rms error over the whole curve is 68 mV. Peak-to-peak currents were predicted within 10 mA. The rms error is 4.8 mA. Based on its ability to predict pin currents and voltages, the internal currents and voltages predicted by the model were also evaluated. The EFT current estimated to flow through the power clamp and through the other on-die circuitry is shown in Fig. 15. When the IC is powered on, most of the EFT current flows through the interblock element between VDD and VSS1 and the power clamp is not turned on. When the IC is powered off, however, the EFT pulse turns the power clamp on and the EFT current is shunted to VSS through the clamp. Consequently, the
618
IEEE TRANSACTIONS ON ELECTROMAGNETIC COMPATIBILITY, VOL. 51, NO. 3, AUGUST 2009
and reset the IC or worse. Such models might also be used to better understand interdomain coupling during EFT events, to better understand where physical failures might occur and why, and possibly, to estimate substrate noise due to EFTs. REFERENCES
Fig. 15. Simulated currents inside the microcontroller during an EFT event (1 kV with 40-dB attenuator) injected on the VDD pin with a supply voltage of 5 and 0 V. Simulated current with a supply voltage of 5 V is shown in (a). Simulated current and voltage with a supply voltage of 0 V is shown in (b) and (c).
voltage on the VDD pin is clamped at 2 V at the rising edge of the EFT pulse. Fig. 15 further shows that if the ESD power rail clamp was removed, the peak voltage on VDD would rise to as high as 2.8 V. VI. CONCLUSION Evaluation of the immunity of ICs to EFTs is important to many control applications involving inductive loads, but little research into modeling of ICs for this purpose has been done. Here, a nonlinear model of the IC PDN was developed based on measurements of the IC. PDN impedances were characterized using two-port S-parameter measurements. Internal diodes were characterized using a curve tracer. Electrical connections between power rails were modeled using a pair of diodes and a simple RC circuit. ESD power clamps were modeled using schematics obtained from the IC manufacturer. This simple model was able to successfully predict the pin currents and voltages in response to fast transients applied to power pins. The accurate prediction of external voltages and currents suggests the model may also be used to predict voltages and currents inside the IC, though that contention could not be verified through measurement in this study. Prediction of the internal voltage and currents potentially allows the IC designer to go beyond predicting the immunity performance of their ICs in specific applications by giving them the ability to understand the reason for failures and to evaluate potential solutions before they are implemented in silicon. Here, we showed one potential application where the performance of the ESD power clamp was evaluated in the presence of EFTs. While power clamps are not typically evaluated for their reaction to EFTs, this evaluation may be critical in many applications where large EFTs may cause the clamp to trigger
[1] S. B. Dhia, M. Ramdani, and E. Sicard, Electromagnetic Compatibility of Integrated Circuits. Berlin, Germany: Springer-Verlag, 2006. [2] C. Lochot and J.-L. Levant, “ICEM: A new standard for EMC of IC: Definition and examples,” in Proc. IEEE Int. Symp. Electromagn. Compat., 2003, vol. 2, pp. 892–897. [3] J.-L. Levant, M. Ramdani, and R. Perdriau, “ICEM modeling of microcontroller current activity,” Microelectron. J., vol. 35, no. 6, pp. 501–507, Jun. 2004. [4] O. Wada, Y. Fukumoto, H. Osaka, Z. L. Wang, O. Shibata, S. Matsunaga, T. Watanabe, E. Takahashi, and R. Koga, “High-speed simulation of PCB emission and immunity with frequency-domain IC/LSI source models,” in Proc. IEEE Int. Symp. Electromagn. Compat., 2003, vol. 1, pp. 4–9. [5] H. Osaka, O. Wada, T. Kinoshita, Y. Toyota, D. Tanaka, and R. Koga, “Power current modeling of IC/LSI with load dependency for EMI simulation,” in Proc. IEEE Int. Symp. Electromagn. Compat., 2003, vol. 1, pp. 16–21. [6] I. Zamek, P. Boyle, Z. Li, S. Sun, X. Chen, S. Chandra, T. Li, D. Beetner, and J. Drewniak, “Modeling FPGA current waveform and spectrum and PDN noise estimation,” presented at the DesignCon, Santa Clara, CA, Feb. 2008. [7] J.-L. Levant, M. Ramdani, R. Perdriau, and M. Drissi, “EMC assessment at chip and PCB level: use of the ICEM model for jitter analysis in an integrated PLL,” IEEE Trans. Electromagn. Compat., vol. 49, no. 1, pp. 182–191, Feb. 2007. [8] T. Nakayama, E. Takahashi, Y. Sito, K. Shimazaki, M. Nagata, and O. Wada, “Evaluation of LSI power supply voltage noise caused by injected RF power using a LECCS model,” in Proc. EMC Eur. 2006, Barcelona, Spain, pp. 209–214. [9] 47A/625/NP: Direct RF Power Injection to Measure Immunity to Conducted RF-disturbances of Integrated Circuits up to 1 GHz, IEC International Standards 62132-4, 2001. [10] EMC—Part 4-4: Testing and Measurement Techniques—Electrical Fast Transient/Burst Immunity Test, IEC International Standard 61000-4-4, 2004. [11] Road Vehicles—Electrical Disturbances From Conduction and Coupling—Part 2: Electrical Transient Conduction Along Supply Lines Only, ISO 7637-2:2004, 2004. [12] Road Vehicles—Electrical Disturbances by Conduction and Coupling— Part 3: Vehicles With Nominal 12V or 24V Supply Voltage—Electrical Transient Transmission by Capacitive and Inductive Conduction via Lines Other Than Supply Lines, ISO 7637-3:1995, 1995. [13] B. Deutschmann, “A comparison of conducted transient disturbances and failure signatures for CMOS integrated circuits,” presented at the EMC COMPO 2005, Munich, Germany. [14] R. Carlton, “A generic transient immunity test methodology for microcontrollers,” in Proc. EMC COMPO 2005, Munich, Germany, pp. 171–176. [15] J. W. Miller, “SPICE-based ESD protection design utilizing diodes and active MOSFET rail clamp circuits,” presented at the Tutorial F at EOS/ESD Symp., Anaheim, CA, 2005. [16] ESD Association Standard Test Method for Electrostatic Discharge Sensitivity Testing—Human Body Model (HBM) Component Level, ANSI/ESDSTM5.1-2001, 2001.
Jayong Koo (S’06) received the B.S.E.E. degree from Chung-Ang University, Seoul, Korea, in 1996, the M.S.E.E. degree from Yonsei University, Seoul, in 1998, and the Ph.D. degree in electrical engineering from the Missouri University of Science and Technology, Rolla, in 2008. From 1998 to 2004, he was with LG Electronics, Seoul, for four years. For two years, he was with Dacom, Korea. In 2008, he joined Intel Corporation, Hillsboro, OR. His current research interests include radio-frequency (RF) interference, electromagnetic compatibility, and advanced RF measurements.
KOO et al.: NONLINEAR MICROCONTROLLER POWER DISTRIBUTION NETWORK
Lijun Han received the B.S. degree in mechanical engineering and the M.S. degree in engineering and computer graphics from Zhejiang University, Hangzhou, China, in 1995 and 1998, respectively, the Ph.D. degree in mechanical engineering and the M.S. degree in electrical engineering from the Missouri University of Science and Technology, Rolla, MO (formerly called the University of Missouri−Rolla), in 2005 and 2007, respectively. He joined Garmin International, Inc., Olathe, KS, in 2007. His current research interests include electromagnetic compatibility and radio-frequency design.
Scott Herrin (M’99) received the B.S. degree in physics from Mississippi College, Clinton, in 1994, and the M.S. degree in electrical engineering from Texas A&M University, College Station, in 1999. From 1992 through 1994, he was with the Advanced Microelectronics. Since 1997, he has been a member of the technical staff at the Freescale Semiconductor, Inc., Austin, TX, where he has been engaged in analog circuit design.
Richard Moseley (M’09) received the B.S.E.E. degree from Texas A&M University, College Station, in 1981. In 1981, he joined Motorola, and in March 2005, he joined the EMC engineering team as an Applications and Systems Engineer. He is currently a Senior EMC Engineer with the Microcontroller Solutions Group, Freescale Semiconductor, Inc., Austin, TX, where he is engaged in EMC test and validation engineer.
Ross Carlton (SM’03) received the B.Sc. degree in electrical engineering from Texas A&M University, College Station, in 1985. Since that time, he has been engaged in the field of electromagnetic compatibility (EMC). During his career, he has worked in the military, aerospace, and commercial electronics industries to ensure the EMC of electronics products from integrated circuits to battleships. He is currently with the National Instruments Corporation, Austin, TX, a manufacturer of industrial controls and test and measurement equipment, where he is the Technical Leader for EMC design and compliance test functions. Mr. Carlton was the U.S. Representative to IEC TC47 from 2000 to 2007, where he led the development of three published IC EMC test method standards. He is currently represents the U.S. on IEC TC65 developing EMC product family standards for test and measurement equipment.
619
Daryl G. Beetner (SM’03) received the B.S. degree in electrical engineering from Southern Illinois University Edwardsville, Edwardsville, in 1990, and the M.S. and D.Sc. degrees in electrical engineering from the Washington University in St. Louis, St. Louis, in 1994 and 1997, respectively. He is currently an Associate Professor of electrical and computer engineering at the Missouri University of Science and Technology, Rolla, MO (formerly called the University of Missouri−Rolla) and is the Associate Chair of the Computer Engineering program. He is engaged in research with the Electromagnetic Compatibility (EMC) Laboratory, Missouri S&T, on a wide variety of topics, including EMC at the chip and system level, and detection and neutralization of explosive devices.
David Pommerenke (SM’07) received the Ph.D. degree from the Technical University Berlin, Berlin, Germany, in 1996. After working at Hewlett Packard for five years, he joined the Electromagnetic Compatibility Laboratory, Missouri University of Science and Technology, Rolla, MO (formerly called the University of Missouri−Rolla), in 2001, where he is currently a Tenured Professor. His research interests include electromagnetic compatibility (EMC), electrostatic discharge (ESD) measurement techniques, electromagnetic interference analysis methods, numerical methods, and instrumentation for EMC and high voltage. He has authored or coauthored more than 100 papers, and holds ten patents. Dr. Pommerenke is the U.S. representative of the ESD Standard Setting Group within the IEC TC77b.