K. Martini. 1. ABSTRACT. The paper describes a project to apply the particle system (PS) approach to structural engineering problems. The PS approach is ...
A PARTICLE-SYSTEM APPROACH TO REAL-TIME NON-LINEAR ANALYSIS
K. Martini
1
ABSTRACT The paper describes a project to apply the particle system (PS) approach to structural engineering problems. The PS approach is widely used in computer graphics and animation to simulate physical phenomena such as deformable objects and collisions. The study finds that although the PS approach is less efficient than conventional finite element analysis, its ability to model unstable structures and support real-time interaction give it particular promise in teaching non-linear behavior, and in preliminary non-linear analysis. The paper also presents examples to verify accuracy of the PS approach, including a large deflection cantilever beam and an inelastic two-bay frame.
Introduction Computer graphics and animation have long incorporated the modelling of physical phenomena such as projectile motion and elasticity, and recent animation applications have included sophisticated finite element modelling and fracture mechanics (O'Brien 1999). Computer games now incorporate physical modelling where calculations are done in real time, responding to input from the player. The physical phenomena in computer graphics are typically non-linear, such as contact phenomena and large displacements. Thus, many computer games implement calculation engines to perform non-linear time history analysis in real time, and they do it using an analytic approach fundamentally different from traditional structural analysis. One of the most widely-used approaches to physical modelling in computer graphics is a particle system, where time-step simulation is used to solve the differential equations of motion of a collection of particle masses (Witkin 1997). Selected masses are commonly connected by springs, which are essentially elastic truss elements. The particle system (PS) approach differs from conventional structural analysis in that it does not form a global stiffness matrix, allowing it to easily analyze unstable structures. The PS approach requires significantly more computational resources, but also enables new types of analysis and modes of interactivity. The paper describes a project to apply the PS approach to problems of structural and earthquake engineering, to demonstrate and assess its potential uses. The two-dimensional prototype program for the project is called Arcade. 1
Associate Professor, Dept. of Architecture, University of Virginia, P.O. Box 400122, Charlottesville VA 22904
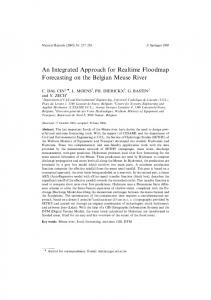
Interface Models and Interactivity Despite enormous gains in speed, capacity, and usability, structural analysis software retains much of the batch-processing organization it had in the 1950s: prepare input, analyze, and interpret output. The tools for preparing input and interpreting output are far more interactive and graphic, and analysis capacity has increased thousands of times, but the three-phase model remains. Computer speed has now reached a point where it is possible to perform analyses in real time; i.e. structural response can be calculated faster that the response occurs. Real time calculation essentially puts the three phases of input, analysis, and output into a continuously running loop. When this loop includes graphic rendering of the structure, it is possible to create a game-like interface where the structural model responds instantly to input from the keyboard and mouse. Figure 1 shows a simple example of the prototype Arcade program, showing the direct manipulation of a cantilever truss structure, modelled with 22 nodes and 41 elements. A node is selected by clicking on it, and then subsequent clicking and dragging of the mouse creates an element connecting the cursor to the selected node. As the mouse is dragged, the cursor effectively pushes and pulls on the structure via the connecting element; the response is calculated and displayed at a frame rate exceeding 70 frames per second on a computer with a 1.4 GHz processor.
Figure 1. Truss structure loaded interactively via the mouse. The black outline shows the unloaded configuration. The grey shows steps of loading Figure 2 shows an example of a tension structure modelled as a chain of linear truss elements. The black outline shows the initial catenary configuration when all masses are equal. The grey outlines show the change in configuration with an increase to the mass of one of the nodes, invoked by a keyboard command.
Figure 2. Tension structure where the mass of one node has been increased. The black outline shows the catenary configuration where all nodal masses are equal. The grey shows the change in shape. These simple examples give some sense of the interactive nature of the program. The structural model responds instantly to input from the keyboard and mouse, so that input, processing, and output are running continuously in a real-time loop Theory and Numeric Methods Analysis algorithm Figure 3 shows the basic organization of the analysis loop for a particle system. The analysis is a time step simulation where the position and velocity of each particle (i.e. node) are known at the beginning of each step. Based on this position and velocity, forces are calculated for each node. These forces may arise from several sources. The Arcade implementation includes mechanical forces from the distortion of connected elements, viscous damping forces based on node velocity, contact forces resulting from collisions with surfaces, and forces specified as boundary conditions (i.e. applied loads). With the forces on each node known, the acceleration for each degree of freedom is calculated by Newton's second law, dividing the mass associated with the degree of freedom by the corresponding force. With the acceleration for each node known, the velocity and position at the end of the time step can be calculated using numeric methods for ordinary differential equations. The analysis is then ready to repeat the loop for the next time step. elements a=
damping position, velocity pos. BC
F m
forces
accel. gravity
surfaces
force BC
ODE time step
Figure 3. Analysis loop for a particle system The calculation begins with nodal position and velocity at the beginning of the step, then calculating forces, then calculating acceleration, then moving to position and velocity for the next step. The Arcade implementation includes several options for the numeric solution of the
differential equations of motion. The fourth-order Runge-Kutta method and an implicit trapezoid method have proved most effective in practice. The time step required strongly depends on the mass and stiffness of the structure. Steel-frame structures of realistic stiffness for buildings typically require steps on the order of 0.3 to 0.1 milliseconds. Fourth order Runge-Kutta requires four structural evaluations per time step, and the implicit trapezoid method employs three evaluations per time step, so that the total number of evaluations per second can range from 9,000 to 40,000. Thus, this approach is computationally extremely intensive. Depending on the speed of the computer, the size of the problem, and the size of the time step, the computational intensity sometimes makes it impossible to render the graphics in reasonably smooth animation (e.g. ten or more frames per second), and in some cases it is impossible to perform the analysis in real time. For such problems, the Arcade implementation supports time scaling, where simulation time is scaled relative to real time. For example, a time scale of 2 means that one second of simulation time occurs during two seconds of real time; the structural response is thus effectively rendered in slow motion. This "semi real-time" analysis not only makes it possible to analyze larger problems but is also useful in situations where the slow motion rendering provides a clearer view of the structural behavior, such as high frequency vibrations or high-velocity collisions. Calculating element forces for large displacements One of the key features of the particle system approach is that all equilibrium calculations are based on the deformed configuration of the structure, so the method is well suited to large displacement problems. For truss elements, the element deformation is easily calculated by subtracting the original length of the element from the current distance between its end nodes. For beam elements, the calculation of deformations is more complex because it must account for the rotation of the end nodes and the rigid body rotation of the entire element, which may exceed 360 degrees. Figure 4 shows how the Arcade implementation calculates flexural deformations as relative rotations from the chord connecting the end nodes. The symbols in the figure have the following meanings: φ0: φC: φR: φi: φj: θi: θj:
Chord angle for the undeformed structure. Total rotation of the element chord Rigid body rotation of the element chord. Global rotation of the i node Global rotation of the j node Rotation of the i node relative to the element chord. Rotation of the j node relative to the element chord.
j
φj
j
θi θj φ0
φ0 i
i Undeformed
φR = φc - φ0
φi φc φR
θi = φi - φR θj = φj - φR
Deformed
Figure 4. Computation of rotational deformations for a two dimensional beam element subject to large rigid body rotations. The deformations θi and θj are used to calculate end moments, which are then used to calculate end shears. The end shears and the axial force (calculated as for a truss element) are then transformed to global coordinates and applied to the node. The calculation of element forces from element deformations is done using a conventional linear elastic formulation. Verification Examples The immediate interactivity of the Arcade program gives it a clear value in visually understanding qualitative aspects of structural behavior. There is still a question whether the method is sufficiently accurate for engineering applications. Earlier studies have shown the accuracy of the PS approach in predicting the Euler buckling load for a column and the plastic collapse load of a beam with a point load (Martini 2001). The following discussion presents two additional verification examples. The first involves an elastic cantilever beam with large displacements, and the second involves a two-bay frame with plastic hinging. In both examples, theoretical results are compared with particle system analyses conducted with slowly applied loads to limit transient dynamic effects. Example 1: Cantilever beam with large displacements. Figure 5 shows a model of an elastic cantilever beam. The analytic model was loaded to very large deflection levels, so that the vertical deflection w exceeded 80 percent of the span.
L u w
EI P
Figure 5. A cantilever beam with large displacements.
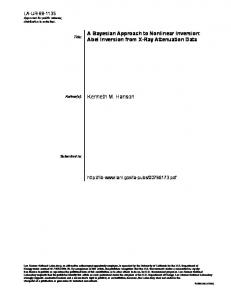
Figure 6 shows results in the form of a load-deflection graph expressed in dimensionless parameters. This graph compares the particle system analysis with a theoretical result by Mattiasson (1981), and later closely matched by Yang's finite element analysis (1994, p. 209). The figure shows close agreement. 10 9
Mattiasson Particle System
Load Parameter: PL2/EI
8 7
u/L
w/L
6 5 4 3 2 1 0 0
0.1
0.2
0.3
0.4
0.5
0.6
0.7
0.8
0.9
Non-dimensional deflections: u/L, w/L
Figure 6. Load-deflection curve expressed in dimensionless parameters for the cantilever example. The analysis results correspond closely to that predicted by Mattiasson (1981). Example 2: Two-bay frame compared with simple plastic theory The preceding example used elastic elements beam elements. The Arcade implementation also includes simple plastic hinging elements, which are essentially elastic beam elements with rigid-perfectly plastic hinges at each end. A model created with these elements was compared with the results of simple plastic theory presented by Neal (1977, p. 82). Figure 7 shows the structure and its failure mechanism. 30 kN
36 kN
25 kN
4m
Mp: 30kNm 2m
2m
2m
2m
Failure mechanism Load factor = 1.422
Figure 7. Two bay frame example after Neal (1977, p. 82).
Figure 8 shows the Arcade model of the structure at the verge of collapse. Each beam and each column is modelled with four equal-length elements. Elements shown in black are elastic, elements shown in grey have yielded at one or both ends. The pattern of yielding matches that predicted by simple plastic theory.
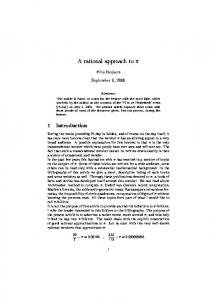
Figure 8. Failure mechanism from analysis of Neal model. Elements shown in grey have yielding. The pattern of yielding in the model corresponds to the pattern of hinging predicted by simple plastic theory Neal's calculation concludes that the structure collapses at a load factor of 1.422: i.e. when the load pattern shown in figure 7 is scaled by that factor. Figure 9 shows a load-deflection curve for the analysis where the vertical load axis is expressed in terms of the load factor. The figure shows that the ultimate strength of the structure is very close to, but slightly less than, the predicted load factor. This is likely a result of the P-delta effect, which is modelled by Arcade but is not included in Neal's calculation. The P-delta effect also explains the negative stiffness branch of the curve after the ultimate load is reached. 1.6 Collapse load factor by simple plastic theory: 1.422 1.4
Load factor
1.2 1 0.8 0.6 0.4 0.2 0 0
0.5
1
1.5
2
2.5
3
3.5
Lateral displacement (cm)
Figure 9. Load factor vs. lateral displacement for the Neal example. The ultimate strength of the frame is very close to that predicted by simple plastic theory. The downward branch of the curve is the result of the P-delta effect.
Close inspection of figure 9 reveals that the load-displacement curve is not perfectly smooth, particularly in the transition as the curve turns from the linear elastic branch to the negative stiffness branch: there are jagged spots in this part of the curve. The jagged spots apparently arise because the analysis is a true time history dynamic analysis, rather than a more conventional pseudo static "push over" analysis. Since it is a time history analysis, it includes transient vibrations, which seem to occur when hinges form in the transition from linear elastic to collapse. Efficiency, Robustness, and Potential Applications One of the key weaknesses of the PS approach is computational efficiency. As described above, the time-stepping numeric methods for solving the equations of motion may require tens of thousands of structural evaluations per second, potentially exceeding hundreds of thousands of evaluations in cases where a pseudo-static analysis would require only a few dozen evaluations. Efficiency becomes especially important in very stiff structures, since they require a small time step to remain numerically stable. This intensity certainly limits the application of the PS approach, but does not render it useless. As the processing speed of computers continues to follow Moore's law, approximately doubling each eighteen months, computationally inefficient methods become more practical. In the current computing environment, the PS approach is appropriate only for relatively small problems, however the size of the appropriate problem will increase directly in proportion to processing capacity, which is expected to continue its exponential climb for many more years. Irrespective of increases in computing speed, it will always be true that problems that can be practically solved by the PS approach are smaller than those which can be solved by more conventional methods, raising the question of the value of the approach and how it can best be used. One of the most promising applications is in teaching. Collapse-related phenomena are typically highly non-linear, yet students have few opportunities to work with non-linear analytic models. Interactive animation provides an opportunity to teach aspects of non-linear behavior very effectively. Another potential application is in preliminary analysis. Bathe (1982, p. 396) points out that a successful analysis can be accomplished only when the problem at hand is well understood, and that particularly for non-linear analysis "a number of preliminary analyses may be required before a final and appropriate finite element model is established." The PS approach may have a useful role to play in such preliminary analysis, since the preliminary models may be smaller, and the highly interactive interface may provide useful insights into the flaws or merits of a particular modelling approach. Future Work A great deal of work remains to be done on the project, particularly in the area of more sophisticated elements, user interface, and three dimensional capabilities. Concerning elements, a two-dimensional constant-strain triangle finite element has been developed and is currently being tested, and a fiber beam-column element is also under development. Extending to three
dimensions is quite simple for truss elements and other elements that do not depend on nodal rotations, but becomes quite complex when dealing with beam-type elements, since they must account for large rotations in three dimensions. The project plans to develop a robust and well verified set of two dimensional elements before moving to three dimensions. The program is already in use as a teaching demonstration tool in architecture classes at the University of Virginia. The next step is realizing its teaching potential is to developing exercises so that students can use the program to study non-linear behavior. Conclusions The particle system approach supports real-time interactive analysis of structural models, enabling a game-like interface where structural response is displayed as in interactive animation that responds instantly to input from the mouse and keyboard. The PS approach is particularly well suited to unstable structures, such as cables, and to large displacement problems. Preliminary verification examples show good correspondence between predictions of the PS approach and fundamental theory for large displacement beams, and frames analyzed by simple plastic theory. The computationally intensive nature of the PS approach makes it less applicable to large problems than more conventional methods, but the size of problems where the PS approach is appropriate will grow in direct proportion to increases in computing speed. The highly interactive interface and the orientation toward small problems make the application of the PS approach most promising for teaching and for preliminary non-linear analysis. References Bathe, K. J. (1982). Finite Element Procedures in Engineering Analysis, Prentice Hall, Englewood Cliffs, New Jersey. Martini, Kirk. (2001) Non-linear Structural Analysis as Real-Time Animation: Borrowing from the Arcade. Computer-Aided Architectural Design Futures 2001 Kluwer Academic Publishers, Dordrecht, Netherlands, 643-656. Neal, B. G. (1977). The Plastic Methods of Structural Analysis, 3rd Edition, Science Paperbacks, London. O'Brien, James F., and J. K. Hodgins. (1999). Graphical Modeling and Animation of Brittle Fracture, Proceedings of the ACM Siggraph Conference on Computer Graphics, 137-146. Witkin, Andrew and D. Baraff. (1997). "Particle System Dynamics" lecture notes for SIGGRAPH 1997 Course Physically Based Modeling: Principles and Practice. Carnegie Mellon University http://www.cs.cmu.edu/afs/cs/user/baraff/www/sigcourse/notesc.pdf Yang, Yeong-bin, and Shyh-Rong, Kuo. (1994) Theory and Analysis of Nonlinear Framed Structures, Prentice Hall, New York.