An aesthetic drawing often allows a human to perceive the general structure of a graph. Either of the drawings in Figure 1 conveys the symmetry of the cube far ...
A Practical Approach to Drawing Undirected Graphs Daniel Tunkelang June 1994
CMU-CS-94-161
School of Computer Science Carnegie Mellon University Pittsburgh, PA 15213
Written while the author was working at AT&T Bell Labs in Murray Hill, NJ. This paper is largely based on the author's Master's Thesis, supervised by Charles Leiserson at the Massachusetts Institute of Technology and Mark Wegman at the IBM T. J. Watson Research Center.
Keywords: algorithms, graphs, graph layout, graph drawing
Abstract Although there is extensive research on drawing graphs, none of the published methods are satisfactory for drawing general undirected graphs. Generating drawings which are optimal with respect to several aesthetic criteria is known to be NP-hard, so all published approaches to the problem have used heuristics. These heuristics are too slow to be practical for graphs of moderate size, and they do not produce consistently good drawings for general graphs. Moreover, they rely on general optimization methods, because problem-speci c methods require a deeper theoretical understanding of the graph drawing problem. This paper presents an algorithm to generate two-dimensional drawings of undirected graphs. The algorithm uses a combination of heuristics to obtain drawings which are near-optimal with respect to an aesthetic cost function. The algorithm is incremental in nature, but preprocesses the graph to determine an order for node placement. The algorithm uses a local optimization strategy that e�ectively manages the trade-o� between speed and output quality. Finally, the algorithm uses a variety of techniques to speed up computation of the aesthetic cost function. The paper discusses this algorithm in the context of previous work and open problems. The algorithm is compared with the \force-directed" algorithm of Fruchterman and Reingold and the simulated annealing algorithm of Davidson and Harel in terms of output quality. Finally, the paper considers what work is necessary to create a truly e�ective algorithm for drawing undirected graphs.
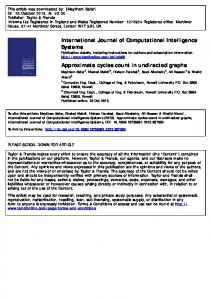
1 Introduction Many disciplines of science and engineering use graphs to represent systems comprised of a large number of interacting components, especially when the individual components are simple. Physicists and chemists rely on graphs to model interactions between many particles, as in the case of molecular structure. Electrical engineers use them to represent Very Large Scale Integrated (VLSI) circuits. The widest use of graphs is in computer science and software engineering. Graphs are used to represent both hierarchical and relational databases. In arti cial intelligence, graphs are used to implement semantic networks and other knowledge representations. Computer Aided Software Engineering (CASE) tools use graphs to represent control ow and module dependency in large programs. The common thread of all these applications is that they use graphs to model systems where the number of components is large but the components themselves are simple. In order to manipulate the data represented by a graph, a person needs a way to visualize the graph. After all, representations which might be perfectly acceptable to a computer are often incomprehensible to human beings. A person needs a representation of the graph which is not only visual, but readable. The conventional and intuitive way to represent a graph visually is to draw nodes as boxes and edges as line segments connecting the boxes. There are an in nite number of such drawings for any given graph, since the placement of boxes is arbitrary. Nonetheless, some drawings are more \aesthetic" than others. The next paragraphs will develop the concept of an aesthetic drawing. This paper assumes that three principles govern the aesthetics of drawing graphs: edge lengths should be uniform; nodes that are not adjacent should be far away from each other; and the number of edge crossings should be small. These principles are intuitive, and people can usually pick out the more aesthetic of two drawings of a graph by inspection. These criteria are a good approximation to what most people concerned with graph drawing intend by the word \aesthetic." These aesthetic criteria, however, are competitive. A simple example illustrates this competitiveness. Figure 1 shows two drawings of the cube: in the rst, which appears three-dimensional, the edge lengths are uniform; in the second, there are no edge crossings. Which of the two is more aesthetic? The answer clearly depends on the context. The aesthetic principles provide criteria, but do not specify their relative weights. Sometimes, aesthetics depend on context-speci c issues. In a VLSI circuit, for example, all edges must be either horizontal or vertical. In a hierarchical database, members of equal rank should appear at the same height in the drawing. In a drawing of a directed graph, there might be a preferred orientation for edges. Even in these and other examples, however, the three general aesthetic criteria will often apply, in conjunction with the context-speci c factors. 1
node8 ?
node7 ?
node5 ?
node6 ?
? ?
? node4
? ?
? node1
node8 @
@ @ node4
? ? ? node3 ? ? ? node2
node1 ?
?
Figure 1
? node5
node7
?? ? node3
node2 @
@@ node6
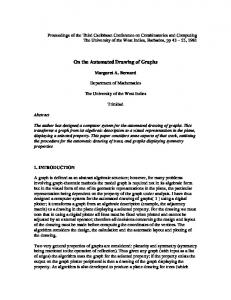
Aesthetic drawings of graphs are not only more appealing to the eye; they also convey information more e�ectively than their less aesthetic counterparts. An aesthetic drawing often allows a human to perceive the general structure of a graph. Either of the drawings in Figure 1 conveys the symmetry of the cube far more clearly than the mess in Figure 2. Indeed, the skeptical reader might spend a few minutes verifying that they are all drawings of the same graph. Aesthetic drawings are not only pretty; they are practical as a means of communicating structure. A general purpose graph drawing algorithm must handle the standard aesthetic criteria robustly while remaining exible enough to accommodate the context-speci c needs of particular applications. In the absence of further information, the algorithm should generate drawings that conform to the standard aesthetics. When an application imposes di�erent or additional requirements, the algorithm should, within reason, easily adapt to them. The algorithm proposed in this paper strives to achieve this exibility. node7 C �e
� Ce � C e C e � node3 node4 b � e b b � b e node6 b����� ? � ��bb ? � node5 b ���XXXX? b XX b ? X � � node8 node2 node1
Figure 2 2
2 Previous Work Graph drawing algorithms fall into two fundamental categories: those for directed graphs and those for undirected graphs. The most popular approach for drawing directed graphs is the layering method of Sugiyama, Tagawa, and Toda. Although this paper is concerned with drawing undirected graphs, the layering strategy is particularly relevant, because the node-ordering strategy of the proposed algorithm is in some sense a generalization of layering. For undirected graphs, most approaches, including the algorithm described in this paper, are based on the spring embedder model of Eades. A more complete listing of work on graph drawing and related problems appears in the annotated bibliography of Eades et al. [DETT93]. Most of the published algorithms for drawing directed graphs are variations of the layering method of Sugiyama, Tagawa, and Toda [STT81]. This method creates layers which it draws as equally spaced rows, assigns each node of the graph to a layer so that most edges are oriented upwards, and permutes the nodes on each layer to minimize edge crossings and edge lengths. An edge can only connect nodes on adjacent layers; hence, when adjacent nodes occupy nonadjacent layers, the method creates a path of dummy nodes on the intermediate layers. The layering method is popular because it is produces acceptably aesthetic drawings and is fast enough to use on large graphs, i.e. graphs where the total number of nodes and edges is on the order of a thousand. On the other hand, the layering method has several drawbacks. The dummy nodes cause edges to bend. Also, the layering method performs badly on graphs with many cycles, since these graphs defeat the goal of producing a mostly upwards drawing. The essential advantage and disadvantage of the layering method is the hierarchical structure it imposes on a graph: when this model is appropriate, the method is fast and produces aesthetic drawings; when it is not, the drawings do not re ect the intuitive structure of the graph. A good, high-level reference for the layering method is [EX89]. Most algorithms for general undirected graphs view drawings as simulated physical models of the graphs. The most popular approach is Eades's spring embedder model, in which nodes act like mutually repulsive charged masses and edges act like springs subject to a force law [Ead84].1 Hence, all nodes repel one another, while the spring force exerts an attraction between adjacent nodes. This model embodies two of the three aesthetic criteria|making edge lengths uniform and keeping nonadjacent nodes far apart. Eades's algorithm generates a random drawing and then performs optimization on it until it reaches a stable local optimum. 1 Actually, there are earlier papers on force-directed placement in the VLSI literature, for example [KS80], [BQ79].
3
Several papers have proposed variants of Eades's model. Kamada and Kawai fuse the attractive and repulsive forces into a single spring force which obeys Hooke's Law [KK89]. There is one such spring between every pair of nodes, and its ideal length is proportional to the graph-theoretic distance between the nodes. Davidson and Harel use the spring embedder model for part of their aesthetic cost function but do the optimization with simulated annealing[DH91]. Fruchterman and Reingold's \force-directed placement" algorithm mixes the spring embedder and simulated annealing approaches[FR91]. All of the published algorithms for drawing general undirected graphs are heuristic. Indeed, the individual problems of achieving uniform edge lengths and of minimizing the number of edge crossings are both NP-hard [EMW86] [GJ83] [MO85]. Hence, an optimal solution is for all practical purposes unachievable. Rather, people have proposed a variety of heuristics to produce near-optimal drawings of graphs. In general, their algorithms have some theoretical foundation, but the only way to evaluate their performance is experimentally.
3 Problems with Existing Algorithms The published algorithms for drawing undirected graphs have three fundamental problems: they are too slow, they do not produce consistently good drawings; and they are not based on a solid theoretical foundation. Given the previously cited hardness results, no practical (i.e. polynomial time) algorithm is likely to produce optimal drawings. The published heuristics, however, have a variety of problems. Not only are the algorithms slow, but their time bounds are either unknown or arbitrary. Eades's spring embedder algorithm and its variants place nodes randomly and then perform local optimization on the drawing. The optimization involves iterating either according to a xed schedule or until achieving a stability threshold. In either case, the algorithms do not have meaningful bounds on running time. With output quality, the situation is far worse: none of the algorithms have any bounds for how the drawings they produce compare to drawings that are optimal (with respect to some aesthetic cost function). In practice, the output quality of existing algorithms is inconsistent for general graphs. Sometimes the user can tune a drawing algorithm by using it interactively and varying its parameters, but this approach is at best a partial solution. The fundamental problem is that there is not enough theoretical understanding of graph drawing. Much of the work on drawing undirected graphs has involved throwing general optimization methods at the problem, e.g. Davidson and Harel's simulated annealing algorithm. Given that the optimization problems are NP-hard, general methods are unlikely to produce good drawings e�ciently. Rather, it is necessary to better understand the theory of graph drawing and thereby design more speci c heuristics. 4
For special cases of graphs, there is a better understanding of the theory. Eades and Wormald have shown that the linear-time median heuristic for drawing bipartite graphs on two layers produces at most three times the optimal number of edge crossings [EW91]. This result is especially relevant to the layering method for directed graphs, since any pair of adjacent layers is a bipartite graph drawn on two layers. There are also many results on drawing planar graphs (see [DETT93]).
4 Proposed Algorithm This section describes the proposed graph drawing algorithm in detail. It rst describes the aesthetic cost function and its computation. It then discusses the incremental strategy for node placement. Finally, it describes the algorithm's local optimization procedure. Figure 3 outlines the algorithm in terms of these components. A key feature of the algorithm is its modularity. All of its components are independent and are therefore easy to replace. This modularity gives the algorithm a exibility which is crucial to its utility across the wide range of graph drawing applications. 1. Read graph from input stream as list of nodes and edges. 2. Compute node ordering from minimal height spanning tree. 3. For each node N, in the order determined by step 2: Sample drawing space to find initial placement for N. Perform local optimization at N and its neighbors. 4. Perform local optimization at every node for fine-tuning. 5. Output drawing as either text or graphics.
Figure 3
4.1 The Aesthetic Cost Function
The graph drawing algorithm seeks to satisfy three aesthetic criteria: uniform edge lengths, even distribution of nodes, and a minimal number of edge crossings. This subsection describes both the quanti cation of these aesthetic criteria and the computation of the aesthetic cost function which the algorithm uses to place and move nodes. 5
4.1.1 The Components of the Cost Function
The aesthetic cost function is a weighted sum of three components, each corresponding to an aesthetic criterion. The rst two components are spring embedder forces: an attractive force between adjacent nodes and a repulsive force between all pairs of nodes. As noted in [FR91], there is a simple relationship between the target edge length and the weights assigned to the attraction and repulsion components. The third component of the cost function is the number of edge crossings. The algorithm assigns default weights to these components, but one can easily modify them in order to vary the aesthetics of the output.
Target Edge Length
The algorithm assumes that there is an target edge length, computed according to a Euclidean metric and measured in units of grid cells on the drawing space. This length is denoted by and determines the ratio between the weights of the attraction and repulsion components of the cost function. In general, the smaller the value of , the faster the algorithm; on the other hand, a larger value can signi cantly improve the quality of the output. For reasons of computational e�ciency, , like all parameters of the algorithm, must be an integer. The results section discusses the issue of choosing an target edge length and the in uence that this choice exerts on the performance and running time of the algorithm. l
l
l
Attraction between Adjacent Nodes
In accordance with the spring embedder model, there is an attractive force between adjacent nodes. If is the edge length, then the associated cost is d
( )=
fa d
wa d
2
As in [DH91] and [FR91], the algorithm uses the square of the length, rather than the length itself, to reduce the amount of computation. Computing the length would require that the value of the cost function have a oating point representation, and would also involve taking a square root. In contrast, computing the square requires only two multiplications and one addition, and does not introduce oating points into the algorithm. Experimentation has not shown any bene t from using the more computationally expensive operations.
Repulsion between All Pairs of Nodes
The node repulsion component is the same as that in [DH91]: ( )=
fr d
6
wr d
2
Again, using the square of the distance reduces computation and allows the algorithm to avoid the use of oating point representations. Nodes can never occupy the same cell in the drawing, so there is no issue of dividing by zero.
Relationship between , , and l
wa
wr
Consider the simple graph of two nodes connected by an edge. If the edge length is , then the sum of the attraction and repulsion costs is d
( )+ ( ) =
fa d
fr d
wa d
2
+
wr d2
The optimal edge length is the value of that minimizes this sum.2 Setting the rst derivative of the sum to equal zero: d
2
wa d
Solving for yields: d
d
?2
wr
r =
d
4
r
3
=0
wr wa
Since the target edge length is, in fact, the target optimal edge length: l
l
=
4
wr wa
Edge Crossings
The edge crossings component of the cost function is a constant multiple of the number of crossings in the drawing. If is the number of edge crossings, then the associated cost is ( )= n
fc n
wc n
4.1.2 Computation of the Cost Function
Since the placement and local optimization procedures repeatedly invoke the cost function to determine the best position for a node, the procedure that computes the cost function is the inner loop of the algorithm. Therefore, the methods for computing the cost function represent an attempt to optimize as much as possible. All computation is in integer arithmetic. Moreover, because the drawing process never modi es more than one node at a time, the algorithm can compute the cost function incrementally, determining only the di�erence in 2 Technically, this argument is only valid for the simple case described | a graph of only two nodes connected by an edge. Nonetheless, it is a reasonable approximation for general graphs.
7
cost due to placing or moving a node. To make the computation yet more e�cient, the algorithm maintains an auxiliary data structure called a uniform grid [AFKN89] to speed up the average case computation of the number of edge intersections. The uniform grid also allows the algorithm to approximate the node repulsion component by ignoring far away nodes, as in the \grid variant" of [FR91].
Incremental Computation
A completely naive computation of the cost function for a drawing of nodes and edges would require ( ) operations to compute the attraction component, ( 2 ) operations to compute the repulsion component, and ( 2 ) operations to compute the number of edge intersections. Since, by assumption, the graph is connected,3 is ( ), so the total amount of time to compute the cost function this way is ( 2) operations. The algorithm, however, never needs to compute the total cost of a drawing from scratch. Rather, it can compute the di�erence in cost that results from placing or moving a node|the only operations it can perform on a drawing. If the degree of the node is , then this incremental method requires only ( ) operations to compute the attraction component, ( ) operations to compute the repulsion component, and ( ) operations to compute the number of edge crossings. Again, the dominant cost is that of computing the number of edge crossings, so the total is ( ) | much better than ( 2 ). V
E
O E
O V
O E
V
O E
O E
d
O d
O V
O dE
O dE
O E
Uniform Grid Technique
Incremental computation of the cost function is a vast improvement over the naive method, but it is not e�cient enough. The problem is computing the number of edge crossings, since the algorithm must check if any of the new edges intersect any of the edges in the drawing. In practice, however, the number of edge intersections is much less than . Under the approximation that the edges have mean length and that their positions and orientations are independently and identically distributed random variables, there is a much more e�cient method to compute the number of edge crossings. The uniform grid technique is described in [AFKN89]. The idea is simple: overlay the drawing space with a coarser grid, called the uniform grid. For example, if the drawing space were a 64 by 64 grid, the uniform grid might be an 8 by 8 grid, where each cell of the latter would correspond to an 8 by 8 section of the drawing space. Each cell of the uniform grid maintains two lists: one of the nodes in that cell, and one of the edges that pass through that cell. d
E
dE
l
3
If the graph is disconnected, the algorithm draws each connected component separately.
8
Figure 4 illustrates the uniform grid technique for a simple example. Here, the 16 by 16 drawing space is overlaid with a 4 by 4 uniform grid. Each cell of the uniform grid maintains a list of the nodes and edges in that cell. For example, the only occupied cell in the top row of the uniform grid contains the node node1 and the edges 1 and 2. Every operation on the drawing space|placing, moving, or deleting a node or an edge|requires updating the uniform grid accordingly. The update for the node lists is trivial, since a node can only occupy one cell; for the edge lists, the algorithm determines which cells the edge occupies and updates them. Hence, the overhead for placing or moving an edge is proportional to the number of uniform grid cells it occupies. EDGES: 1,2 node1 �A
EDGES:
� A � A � A � A � A EDGES: 2 EDGES: 1 � A � A2 � A � A � A �1 A � A � A 2,3 1 EDGES: � EDGES: 1, 3 A � A node3 � � � � � � � �� � � 3� � � � � �� 1,�3 ��EDGES: 3 � � �
EDGES: node2
Figure 4
9
[AFKN89] presents a simple method to enumerate edge crossings using the uniform grid technique; the procedure presented here is an adaptation of that method for incremental computation. To determine the intersections of a given edge with all other edges in the drawing requires two steps. The rst is to compute which uniform grid cells the edge occupies. The second is to determine, for each of these cells, if the given edge intersects any of the edges which occupy that cell. The procedure enumerates the intersections it nds, ignoring the duplicates. The key to using the uniform grid technique is choosing an appropriate coarseness ratio. If the uniform grid is too ne, it is no more e�ective than using the original drawing space. If it is too coarse, it becomes an unstructured list of the nodes and edges in the drawing. The best choice for this ratio is , some constant multiple of the target and, by assumption, average edge length. This choice implies that the expected number of uniform grid cells occupied by an edge is (1). The expected number of edges that occupy a uniform grid cell is ( 2 ), where is the length in original p grid cells of a side of the drawing and the uniform grid is coarser by a space. Hence, if is proportional to factor of , then the algorithm can compute the number of intersections of a given edge with all other edges in (1) expected time,4 and the overhead for operations on the drawing is (1) expected time per placement or movement of an edge. The expected space overhead for the uniform grid is ( ). As stated previously, this analysis depends on the assumption that the edge lengths and positions are independently and identically distributed random variables; this assumption is at best an approximation. Nonetheless, the uniform grid technique is an e�ective heuristic in practice. The algorithmcan also use the uniform grid technique to implement the \grid variant" described in [FR91], which approximates the repulsion component of the cost function by ignoring far away nodes. If the algorithm only considers the repulsive force for nodes within a constant radius of the given node, then it can compute the repulsion component in (1) operations. Cl
O
O
E
s
s
E
s
l
O
O
O E
O
4.1.3 Modifying the Cost Function
While it is easy to modify the weights for each component of the cost function; it is also possible to make much deeper modi cations. For example, an attempt to apply the algorithm to directed graphs would require that the cost function prefer a downwards orientation of edges. Another possibility is that the cost function might include a component for repulsion between nodes and edges, as in [DH91]. In fact, the design of the algorithm permits substantial exibility in choosing the details of the cost function. 4 This result seems more intuitive when one considers that, given the assumptions, the expected number of intersections for a given edge is O(1).
10
The only requirement for the cost function is that it be expressible as a function of the nodes and the edges in the following form:
X
(
fn1 ni
X )+
X ( )+
ni
fe1 ei
(
fn2 ni ; nj
)+
X
(
fe2 ei ; ej
)+
X
(
fne ni ; ej
)
i;j
i;j
i;j
i
i
ei
In other words, the cost function may only contain terms that depend on a single node or edge, a pair of nodes or edges, or a node and an edge. This property guarantees that the algorithm can compute the cost function in an e�cient incremental manner, given that the placement and movement procedure can only a�ect the position of a single node. In the general case, computing the change in cost will require ( ) operations, dominated by the third term (pairs of edges) in the sum. Indeed, computation is faster for special cases, such as the algorithm's \standard" cost function described previously. Although this framework for the cost function is highly exible, there are some important properties of drawings which it cannot consider. Determining overall symmetry in the drawing, for example, requires a function that depends on all the nodes of the graph. The restrictions on the cost function re ect an inevitable tradeo� between exibility and e�ciency. Another consideration is the issue of integer versus oating point representation. In general, the former is more e�cient, but the latter may o�er more
exibility and accuracy. O dE
4.2 Placing the Nodes
4.2.1 Order of Node Placement
The basic idea is to draw the graph from the center outwards. To do so, the algorithm must rst determine which node to label as the center of the graph and then perform a breadth- rst traversal of the graph, starting at that node. This process enumerates the nodes of the graph in decreasing order of centrality. The only challenge is to determine the center. Graph theory provides a useful de nition of the center of a graph. Let our graph be = ( ); then a center of G is any node that minimizes max 2 ( ), where ( 1 2 ) is the length of shortest path connecting 1 and 2. Then, to enumerate the nodes in order, we simply take a breadth- rst traversal of the graph starting at one of its centers. An example illustrates this ordering intuitively. Consider the \star of David" graph in Figure 5. The thirteen nodes fall into three categories: the center (labeled 1), the six inner corners adjacent to the center (labeled 2), and the six outer corners (labeled 3). Figure 6 shows the breadth- rst traversal of the graph as a rooted tree. G
v
V d c; v
V; E
c
d v ;v
v
v
11
To compute a center, the algorithm performs a breadth- rst traversal of the graph from every node and picks one which produces a tree of minimal height. Each traversal takes ( ) operations, so the total running time is ( ) operations. O E
O V E
3
1
� Ll HH �, � lH , ��, L lHH L � H , � , L l � l HH
?@ ? @2 3@ ?2@ ? 3 @ ? @1? @? @2? 2 ?@ ?@ ?@ ? @ ? @3 ? @ 3 2@ ?2 @3?
Figure 5
2
2
3
3
2
2
2
2
3
3
3
3
Figure 6
4.2.2 Initial Placement of Nodes
The problem of initially placing a node in the drawing is a tradeo� of quality versus speed. To be guaranteed the best initial placement for a node, the algorithm would have to compute the cost of placing that node in each unoccupied cell on the drawing space. Since the number of cells in the drawing space is proportional to the number of edges of the graph, this procedure would require ( ) evaluations of the cost function for each node placement. This cost is unacceptably high; accordingly, the algorithm samples intelligently at far fewer cells and allows the local optimization procedure to ne-tune its guess. The sampling procedure used in the current implementation is similar to the \template" method described in [Wat89]. The algorithm always places the rst node in the center of the drawing space. When initially placing a node, the algorithm iterates through the list of its placed neighbors.5 For each neighbor, it considers the template of cells exactly one cell or cells away from the node in each of the eight compass directions. The sampling procedure also considers the template around the barycenter6 of the neighbors. Finally, the algorithm samples the four corners of the drawing space. If all of these cells are occupied, the algorithm gives up and suggests using a larger drawing space. Otherwise, it places the node in the sampled cell which o�ers lowest cost for placing the node. O E
l
5 The node-ordering procedure guarantees that all other nodes other than the rst will have at least one of their neighbors placed before them. 6 The barycenter of a set of points is the geometric analogue of the center of mass of a set of equal point masses.
12
X X X
X
X X ?X? X ?X? X X? X X ?
X
X X?
? ? X ?X p? X
X X X X X
X? ?
X? ?
X? ? ? ?
X X X X ?q X X? X X ? X
X
? ?
X
? ?
X
X
Figure 7
X
Figure 7 illustrates this sampling procedure. Here, the new node to be placed is adjacent to nodes p and q, and is 4. The sample points are marked with X's. The number of cells sampled in this method is proportional to the node's degree, and the algorithm must compute the cost function for each sample point. There are other sampling strategies for node placement. One approach is to randomly generate the sample points. Experimentation showed that this approach is less e�ective than the template method. Another approach is to use the topology of the drawing, e.g. pick one sample point from each region of the drawing. This approach looks promising: its main disadvantage is that it requires that the algorithm maintain the topology of the drawing. A topological approach also may require that the edges bend. l
13
4.3 Local Optimization
The local optimization procedure is the most critical component of the algorithm. Even if the node-ordering and initial placement procedures were perfect, the algorithm would still need local optimization to correct mistakes made because of incomplete information. Without local optimization, the algorithm would make mistakes like the one depicted in Figure 8. The optimal way to draw a path of three nodes is to place them equally spaced on a straight line, but the optimal way to draw a cycle of four nodes is as a square. An incremental algorithm, however, cannot make this \realization" until it places the fourth node, by which time it is too late to correct its earlier mistake of placing the rst three nodes on one line. Moreover, the initial placement procedure is not perfect, so local optimization can make up for its inaccuracy by immediately improving the initial guess. node1 node1 node1
node1 Q
Q
node2
node2
node3
� � node3
node2
Q Q � �
Q Q node4 � �
Figure 8 When the algorithm performs local optimization at a node, it samples near the current position using the same sixteen-cell template as the initial placement procedure.7 If any of these cells have a lower cost than the node's current cell, the algorithm moves the node to the better cell. This algorithm repeats this process until the node is in a position which is locally optimal with respect its template. Whenever the local optimization procedure succeeds in moving a node, it calls itself recursively on the neighbors of the improved node. This recursion propagates the optimization process throughout the drawing when one improvement res o� a chain of improvements in its neighbors, their neighbors, and so forth. Since the placement of a node is most likely to in uence the costs associated with its previously placed neighbors, the recursion allows the algorithm to use the new information to correct earlier mistakes. 7 The sampling procedure for local optimization, like that for initial placement, can easily be changed.
14
The running time of this recursively propagated local optimization procedure depends on how much the algorithm can improve the drawing. An unsuccessful attempt to perform local optimization at a node performs only a constant number of computations of the cost function. Accordingly, the ratio of number of operations spent in local optimization to the number of successful improvements is, in the worst case, constant. The algorithm essentially gets what it pays for: if it spends a large portion of its running time performing local optimization, then the drawing actually needs the improvement. Another way to look at this running time is to say that some graphs are just more di�cult to draw than others, and that this di�culty, which shows in the corrections to the initial placement of nodes, determines the running time of the algorithm. After initially placing a node, the algorithm immediately performs local optimization at that node and at its neighbors. After the algorithm has placed all the nodes, it ne-tunes the drawing by performing local optimization at every node.
5 Results This section illustrates the performance of the algorithm, both qualitatively and quantitatively. The qualitative part is a study of drawings produced by the algorithm. The quantitative part de nes a trio of measures for the quality of a drawing and compares the proposed algorithm with those of [DH91] and [FR91] on a test set of graphs. This paper does not discuss the concrete running time of the algorithm, because it is by necessity machine dependent. The analysis in [Tun92] shows how the algorithm performs when implemented on an IBM RS-6000 workstation. Typical running times for graphs of under a hundred nodes are less than three seconds. The implementation of [FR91] runs at a comparable speed, but it uses a xed schedule of iterations, so its running time is a function of the number of nodes. The simulated annealing algorithm of [DH91] is too slow to be practical in its present form.
5.1 Examples
The drawings presented here illustrate the strengths and weakness of the algorithm. All drawings use the default settings for the cost function. A table at the end provides quantitative information about the examples. One problem with existing graph drawing algorithms is that a small change in the choice of parameters can drastically a�ect the output. To quote Fruchterman and Reingold, \the algorithm should work reasonably well almost always, without the user having to ddle with options" [FR91]. Accordingly, the proposed algorithm only expects the user to choose one parameter|the target edge length {as a quality control setting. A low value for su�ces for most sparse l
l
15
graphs, which require very little local optimization. For dense graphs, a larger can substantially improve the drawing quality. At the same time, increasing slows down the algorithm, since the neness of the drawing results in more local optimization. A small change in rarely has a signi cant e�ect on the performance of the algorithm. The examples here are LaTEX les produced by the proposed algorithm and directly incorporated into this document. The implementation of the algorithm consists of less than a thousand lines of ANSI C. Since the code is portable and deterministic, it is quite machine-independent.8
l l
l
5.1.1 Planar Graphs Trees
The proposed algorithm treats trees like all other graphs; that is, it draws them according to the standard aesthetic criteria, rather than the conventional format for rooted trees. The node-ordering strategy ensures that the algorithm draws the tree breadth- rst, starting from its graph-theoretic center. The results are aesthetic, crossing-free drawings. Figure 9 shows a complete binary tree of thirty-one nodes. Another example of a highly symmetric tree, Figure 10 shows a complete 2-3 tree of twenty-one nodes. Figure 11, a Fibonacci tree of thirtythree nodes, shows how the algorithm performs on an asymmetric tree.
Planar Meshes
The proposed algorithm handles planar meshes much like it handles trees: its node-ordering strategy nds the center and allows the initial placement of nodes to be almost perfect, so that the algorithm avoids being bogged down in local optimization. Figure 12 shows a triangular mesh of thirty-six nodes. Figure 13 shows a square mesh of twenty- ve nodes.
Polyhedra
In the default settings, the algorithm draws graphs of polyhedra so that they appear to be projections of three-dimensional shapes.9 Figures 14 to 16 illustrate how the algorithm draws a cube, a dodecahedron, and an icosahedron.
5.1.2 Non-Planar Graphs
Figures 17 to 20 are examples of classic nonplanar graphs. Figure 17 is 6 , the complete graph on six nodes. Figure 18 shows a nine-node torus, while Figure 19 shows the sixteen-node torus or hypercube. Finally, Figure 20 shows a three-level pyramid or multigrid. K
With the exception of the choice of constants discussed in the previous section. It is possible, by varying the settings, to obtain crossing-free drawings of polyhedra; see [Tun92]. 8 9
16
5.1.3 Random Graphs
Figures 21 and 22 demonstrate the performance of the proposed algorithm on random graphs. The two drawings, a tree, and sparse graph, are aesthetic but lack structure|which makes sense for drawings of random graphs. Attempts to produce an aesthetic drawing of a random dense graph were futile. � 18l 19� 16 l9� � 17 8 29 28 T � T � T4� T14 � 30 A 2aa5 11,,23 A15 7 # # c c22 31,, cc3!!1 10 �l l 6T � 21 20 % 26aa13% T12 24 � D D 27� 25
? C4? D 21@ 2�H 15 �1 � D�� H6� 3 � @9�� � L � ? � L �� � LL 20? 5 14 L 8 �L L L LL 12 13 LL 18 19
Figure 9
Figure 10
26 20 AA 24 25bb? ? 18 23 19 B " B" 30XX29H 15 22HH H27� �� 21bb""14 16 17 � � 32 28 13 � 31� 11bb , 33"" 6 5PP12 , 8(((10 7�� 9 ��4ee 2 3 1
36 28 21 15 10 6 3 1 A �A �A �A �A �A �A � A35 � A 27� A20� A14� A9� A5� A2� A �A �A �A �A �A � A� A 34 26� A19� A13� A8� A4� A �A �A �A �A � � A� A� A� A� A33 25 18 12 7 A �T �A �T � A32� T24 � A 17� T11� A �A �A � A31 � A 23� A16� A �A � � A A30 22� A � A 29�
Figure 11
Figure 12
17
16 � �
@ @7� D D
17
11 C C
10
5
16
11
6aaa
17 ! !! ! 22
12
7aaa
23
13
8
a 19
14
!! ! ! 9
a 20
15
!! 21!!
24aaa 25aaa
18
Figure 13
8
JJ
JJ
J
J
J
J
J J
J J
J J
J1 J4 6J
7J
J J
J J
J
J
J J
J
J J
J
J
J
a1 a2
3 4
!5 !! ! 10
2
3
Figure 14
16a " " � aaa " XX�X 12 3aaa
� X19 8B
� 14
B ?J
�18 6H 2 B J � ? H �� ?J B 10 @? J @ � ?H13 J �� � A ? � @ J ? 7A 20 5 J � A J9� � A15 � P � P P AA � ? P1� � 11P PP ? @ P @4? 17
4ZH ,LH ,? H ? L ZH , ? Z HH P 9 10 L Z P , ��B � H � A P P2 L , � � � � B � A �� h � � , � h L 5JA hh � h h �hhL�� A � � BB� h 1Sh A � � h AJ � ?12 hh� hh A� � 11 AJJ � ? AA � S ## ? � A 7BH #S � H A� AB HH �A # S � S3� H A8#(((( AB � � � ( ( � ( ( AB6� �
Figure 15
Figure 16
18
6H @ A H
1 �� ? � @ H � � ?� A @ H � ? � A @ HHH �� � ? A @ �H HH? �� � A � @ H ? H�H �A� @ � A ? � HH @5? 2� 4 � A ? @ � ? A @ � ? A @ � ? A @ A � ? @ A � ? @ � ? A @ � @ A3?
XX 4P XXX �� P P PPXX P5hh Xh �� Xh Xh h6 X � �� � � � �� � � �� �� � �1X �� � ` ` � `X � X `` � X � 2�PX X �P � XP � XP XP X X3 � P � �� �� � �� �� � �� � �� �� hX 7 X � hX � � hX hh � h8��P X �� XX PX P XP X P P9��� X
14 " "7 " CC " B " " " " C 1" " 10 B C C C B C C C B 12 C C" B C C "4 C ""C C C "C C B " C C " " C B " " C C 6 C " 9 C C 16 C " 3 C C " " C C C " "C "C "C C " C" C C 13 5 C C C C C C C C C C 15 C "8 " C C "" C "" C11 " C2 " " "
,10 l , l , l , l , l13 4l 9 , ,T �T , , , l, , , , , T T � 7 a a �l aa, , , � T T � l T14 � ,a , l T12� 1, 3 8 " " A � T T , , � , � T"" � ,T, A , " A �" T �, T , A� T, T� 2" 6, 11 l , , l , l , l l5,
Figure 17
Figure 18
Figure 19
Figure 20
19
28 �21HH27 � � 14 DD 24� 7 � 18 15 26Baaa �33 23� 2hhh6 ? � 31� 8Z 17 c 18 � ? # � � B ? 21 27 13 # c B� b b32 @ 10Z � @ 28 � 3aa Z12 L 23 J � J�22� 26 Z#12�H H � 7HH 3 8� c L c#9H#H 17hh24� � L X 10 H 16 31 ! ! X X ! c ! %15 c19 25T 1 5 H�H16a?? # % ( ( 5 ( 1 TT20 T29T 9% a25���30 11� LLa"" � 4 @@29 22 T30J 2 6�Z � J32 � 4 Z13 11T 20 � T14 19�
Figure 21
Figure 22
5.1.4 Quantitative Summary of Examples
Figure Description 9 10 11 12 13 14 15 16 17 18 19 20 21 22
Complete Binary Tree Complete 2-3 Tree Fibonacci Tree Triangular Mesh Square Mesh Cube Dodecahedron Icosahedron
K6
Torus Hypercube Pyramid Random Tree Random Sparse Graph
Nodes Edges l 31 21 33 36 25 8 20 12 6 9 16 14 32 33
5.2 Quantifying the Quality of a Drawing
30 20 32 84 40 12 30 30 15 18 32 36 31 40
3 3 3 2 2 1 2 4 1 8 2 2 2 5
In order to compare the performance of graph drawing algorithms objectively, it is necessary to de ne quantitative measures for the quality of a drawing. Such measures must take into account the three aesthetic goals: uniform edge lengths, node distribution, and minimal edge crossings. As the introduction notes, however, these criteria are competitive, and there is no reasonable way to assign absolute weights to these three criteria. Instead, the quality of a drawing will consist of three values, each of which re ects one of the criteria. 20
The drawing must be normalized, since the quality of the drawing should be independent of the choice of overall scale. Dividing all of the coordinates by the mean edge length yields a drawing where the mean edge length equals 1, hence referred to as the normalized drawing. The measure of the uniformity of edge lengths, denoted Q1, is the variance of the edge lengths in the normalized drawing. The lower this value, the more uniform the edge lengths. In the optimal case, when edge lengths are all equal, the variance equals zero. The measure of node distribution, denoted Q2 , is the sum, over all pairs of nodes, of node repulsion costs in the normalized drawing. The node repulsion cost from any pair of nodes is the reciprocal of the square of the distance between them, just as in the cost functions of both the proposed algorithm and that of [DH91]. Finally, the measure of edge crossings, denoted Q3, is simply the number of edge crossings in the drawing. These three measures make it possible to quantitatively compare the quality of two drawings of the same graph. If a drawing achieves lower values than another in all three categories, then the rst is unambiguously the more aesthetic of the two. Otherwise, only an intelligent (and biased) observer can decide which criteria are more important for drawing a given graph.
5.3 Comparison with Published Algorithms
Here the proposed algorithm is compared with those of [DH91] and [FR91] on a test set of thirty graphs. All three algorithms were run strictly in their default settings, i.e. there were no changes in parameters, command-line or otherwise, among the thirty test graphs. Not allowing the settings to vary ensured that the comparison would be both tractable and fair. The choice of graphs for the test set is necessarily arbitrary, but the fact that many of the test graphs were used as examples in [DH91] and [FR91] implies that these graphs are \typical" in the eld. The test set of graphs is divided into four groups according to size and density. For each category there are two tables. The rst gives verbal and quantitative descriptions of the graphs. The second shows how each algorithm performs on the those graphs|the running times and the three measures of quality for the drawings. As de ned above, Q1, Q2, and Q3, denote the uniform edge length, node distribution, and edge crossing quality measures, respectively. The lower these values, the better the quality of the drawing. In order to make the tables readable, the graphs in each group are rst numbered in a table and then referred to by those numbers in a subsequent table which shows the performance of the three algorithms on them.
21
5.3.1 Small, Sparse Graphs
These are graphs of about sixteen nodes with an average degree of at most three: # Description Nodes Edges 1 Path 16 15 2 Cycle 16 16 3 Complete Binary Tree 15 14 4 K3 3 6 9 5 Dodecahedron 20 30 6 Square Mesh 16 24 7 Random Tree 15 14 8 Random Graph 16 20 ;
The performance results for the three algorithms: #
Proposed Algorithm
1 2 3 4 5 6 7 8
0 .0012 .0005 .0082 .0037 .0007 .0001 .0011
Q1
Q2
.0858 .1124 .1297 .5090 .2643 .1841 .1231 .1629
Q3 0 0 0 1 5 0 0 1
Q1
.0031 .0009 .0055 .0058 .0009 .0023 .0048 .0031
[FR91]
Q2
.2393 .1114 .1561 .4670 .2684 .3416 .1677 .1640
Q3 1 0 0 3 6 7 1 1
Q1
.0081 .0055 .0073 .0093 .0034 .0066 .0108 .0028
[DH91]
Q2
.2079 .2222 .3070 .4981 .3659 .2827 .3126 .2356
Q3 0 0 3 1 14 5 0 2
On these graphs, the proposed algorithm performs better than the other two with respect to all three measures.
5.3.2 Small, Dense Graphs
These are graphs of about sixteen nodes and an average degree of at least four: # Description Nodes Edges 9 Wheel 13 24 10 Triangular Mesh 15 30 11 Hypercube 16 32 12 K6 6 15 13 Icosahedron 12 30 14 K12 12 66 15 Random Graph 16 40 16 Random Graph 16 64 22
The performance results for the three algorithms: #
Proposed Algorithm
9 10 11 12 13 14 15 16
.0036 .0001 .0089 .0119 .0143 .0040 .0061 .0042
Q1
Q2
.2925 .2015 .5125 .8257 .5481 1.461 .6249 .8606
Q3
0 0 10 3 6 185 22 117
Q1
.0036 .0006 .0001 .0051 .0021 .0021 .0017 .0017
[FR91]
Q2
Q3
.3431 5 .2029 0 .4670 24 .5418 15 .4151 23 .7418 391 .3810 36 .5445 160
Q1
.0064 .0045 .0072 .0130 .0060 .0041 .0062 .0039
[DH91]
Q2
Q3
.3327 0 .3505 12 .4798 35 .9182 4 .4765 20 1.503 214 .6187 42 .8617 164
Here, the algorithm of [FR91] is best at minimizing Q1 and Q2, the spring embedder components of the cost function, but it does not do as well with Q3, the number of crossings. This result is not surprising, since Fruchterman and Reingold's algorithm was not explicitly avoiding crossings. The proposed algorithm performs similarly to that of [DH91] with regard to Q1 and Q2, but does much better than both [DH91] and [FR91] in terms of Q3.
5.3.3 Large, Sparse Graphs
These are graphs of fty to sixty nodes with an average degree of at most three: # Description Nodes Edges 17 Path 48 47 18 Cycle 48 48 19 Complete Binary Tree 63 62 20 Fibonacci Tree 54 53 21 Hexagonal Mesh 54 72 22 Square Mesh 49 84 23 Random Tree 63 62 24 Random Graph 60 80 The performance results for the three algorithms: #
Proposed Algorithm
17 18 19 20 21 22 23 24
0 .0021 .0005 .0005 .0008 .0004 .0009 .0029
Q1
Q2
.0329 .0474 .0677 .0661 .0939 .0921 .0638 .1642
Q3 0 0 0 0 5 0 0 20
Q1
.0016 .0021 .0018 .0025 .0011 .0009 .0024 .0011
[FR91]
Q2
.1672 .1719 .1316 .1743 .2170 .1622 .1410 .2095
23
Q3 6 10 18 12 26 22 13 44
Q1
.0071 .0068 .0071 .0049 .0060 .0039 .0065 .0030
[DH91]
Q2
Q3
.3474 56 .3983 41 .3395 80 .3465 71 .4599 165 .3591 130 .4124 87 .3842 135
For large sparse graphs, as for small ones, the proposed algorithm is best for all three measures.
5.3.4 Large, Dense Graphs
These are graphs of about sixty nodes and an average degree of at least four. There are not many interesting moderately dense graphs of this size in the literature; hence three of the six test graphs are randomly generated ones. Moreover, the implementation of the algorithm of [DH91] is not con gured to handle graphs of over 100 edges. # 25 26 27 28 29 30
Description Nodes Edges Wheel 61 120 Torus 64 128 Triangular Mesh 55 135 Random Graph 60 120 Random Graph 60 150 Random Graph 60 180
The performance results for the two algorithms: #
Proposed Algorithm
25 26 27 28 29 30
.0053 .0037 .0000 .0033 .0038 .0029
Q1
Q2
.4415 .2591 .0906 .4707 .7621 .8944
Q3
57 116 0 163 404 828
Q1
.0020 .0007 .0005 .0009 .0006 .0007
[FR91]
Q2
.4270 .2818 .1400 .3333 .4216 .5341
Q3
143 168 41 291 495 992
As with the small dense graphs, the algorithm of [FR91] does better with respect to the spring embedder measures, but the proposed algorithm achieves substantially fewer crossings.
5.3.5 Summary of Comparison
The spring embedder measures favor the proposed algorithm for sparse graphs and [FR91] for dense ones. [FR91] performs almost as well as the proposed algorithm for small, sparse graphs, but achieves notably worse results for larger ones. [DH91] achieves signi cantly worse results on both sets of sparse graphs. On dense graphs, small and large, [FR91] achieves the best results for the spring embedder measures. The proposed algorithm and [DH91] perform similarly on small, dense graphs. Logically, these measures should favor the spring embedder model of [FR91]. 24
The edge crossing measure strongly favors the proposed algorithm over the other two. Although the authors of [FR91] express concern with minimizing edge crossings, their algorithm does not explicitly avoid them. In contrast, the proposed algorithm explicitly includes edge crossings in the aesthetic cost function and succeeds at producing drawings with very few crossings, except for very dense graphs. For small graphs, [DH91] and [FR91] perform similarly in terms of edge crossings; for large graphs, [FR91] achieves far fewer crossings. None of the three algorithms produce satisfactory drawings for most large dense graphs. It is unclear whether these graphs are inherently ugly, or whether the algorithms are simply not up to drawing them well.
6
Conclusion
The proposed algorithm produces conventionally aesthetic drawings for moderately sized graphs at an acceptable speed, and it is exible enough to accommodate a wide variety of aesthetics. Nonetheless, there is still plenty of room for improvement, especially for drawing larger and denser graphs. The proposed algorithm, like other algorithms for genearal undirected graphs, does not separate the problem of determining an embedding from the problem of choosing exact coordinates for nodes. A two-phase approach that separates these steps seems promising. Any approach with provable output properties would be a great step towards understanding the theory of graph drawing. Hopefully the ideas proposed in this paper will help push forward the horizons on this problem.
References [AFKN89] V. Akman, W. R. Franklin, M. Kankanhalli, and Narayanaswami. \Geometric computing and uniform grid technique." ComputerAided Design, 21(7):410{420, September 1989. [BQ79] M. Breuer and N. Quinn. \A forced directed component placement procedure for printed circuit boards." IEEE Transactions on Circuits and Systems, 26(6):377{388, 1979. [DETT93] G. DiBattista, P. Eades, R. Tamassia, and I. Tollis. Algorithms for drawing graphs: an annotated bibliography. Technical report, Brown University, June 1993. [DH91] R. Davidson and D. Harel. Drawing graphs nicely using simulated annealing. Technical report, Department of Applied Mathematics and Computer Science, Weizmann Institute of Science, April 1991. Revised version. 25
[Ead84]
P. Eades. \A heuristic for graph drawing." Congressus Numeran-
tium, 42:149{160, 1984.
[EMW86] P. Eades, B. McKay, and N. Wormald. \On an edge crossing problem." In Proceedings of the Ninth Australian Computer Science Conference, pages 327{334. Australian National University, 1986. [EW91] P. Eades and N. Wormald. Edge crossings in drawings of bipartite graphs. Technical report, Department of Computer Science, University of Queensland, December 1991. to appear in Algorithmica. [EX89] P. Eades and L. Xuemin. \How to draw a directed graph." In Proceedings of the IEEE Workshop on Visual Languages (VL '89), pages 13{17, 1989. [FR91] T. Fruchterman and E. Reingold. \Graph drawing by force-directed placement." Software | Practice and Experience, 21(11):1129{1164, November 1991. [GJ83] M. Garey and D. Johnson. \Crossing number is NP-complete." SIAM Journal of Algebraic and Discrete Methods, 4(3):312{316, 1983. [KK89] T. Kamada and S. Kawai. \An algorithm for drawing general undirected graphs." Information Processing Letters, 31:7{15, April 1989. [KS80] Joseph B. Kruskal and Judith B. Seery. \Designing network diagrams." In Proceedings of the First General Conference on Social Graphics, pages 22{50, Washington, D.C., July 1980. U. S. Department of the Census. Bell Labs Technical Report No. 49. [MO85] Z. Miller and J. Orlin. \NP-completeness for minimizing maximum edge length in grid embeddings." Journal of Algorithms, 6:10{16, 1985. [STT81] K. Sugiyama, S. Tagawa, and M. Toda. \Methods for visual understanding of hierarchical systems." IEEE Transactions on Systems, Man, and Cybernetics, SMC-11(2):109{125, February 1981. [Tun92] D. Tunkelang. An aesthetic layout algorithm for undirected graphs. Master's thesis, Massachusetts Institute of Technology, 1992. [Wat89] H. Watanabe. \Heuristic graph displayer for G-BASE." International Journal of Man-Machine Studies, 30:287{302, 1989.
26