Missing:
A Real-time System for Sensor Information Interactive Visualization with Multi-touch Technology Kevin O’ Mahony, Jian Liang, Kieran Delaney NIMBUS Centre Cork Institute of Technology Cork, Ireland {kevin.omahony, jian.liang, kieran.delaney}@cit.ie
Abstract—Access to digital information from sensor networks is traditionally confined to common computer interfaces and interaction paradigms. New forms of novel Human Computer Interaction (HCI) paradigms are required to be developed for supporting how we currently engage with the collected sensor information. In this paper we introduce Sensor Information Interactive System (SIIS) that presents sensor information collected from a smart object with a multi-touch interface. This system aims to exploit the interaction capabilities of multi-touch technologies by supporting more efficient activities and presentation with digital sensor information, making it more accessible and meaningful. The SIIS system is validated with both 2-D and 3-D applications to demonstrate the effectiveness and flexibility of multi-touch interactions and usability of the multi-touch interface for engaging with real-time sensor information. Index Terms—Multi-touch interface; Sensor information visualization; Strain mapping; Internet of Things
I. I NTRODUCTION The interface between people and computing devices is rapidly changing as the boundaries between computer technologies and everyday objects, surfaces and environments are being blurred. A transformation is occurring in which everyday objects and surfaces are embedded with new forms of computational technology. Progressive research and development is determining the transformation of a network of interconnected computers (the Internet devices) evolve to a network of interconnected objects. Internet-accessible everyday objects, surfaces and environments embedded with new forms of computational technology are creating a world of an “Internet of Things” (IoTs) [1]. As everyday objects within our environments become embedded with new forms of sensing capability, the interfaces by which we interact to control and monitor interesting information will require more intuitive interaction paradigms than currently existing HCI paradigms. Most conventional ways of presenting sensor information fall into numeric formats including charts and tables of numbers, which are not so comprehensive. Traditional interfaces are inherently designed for single user/cursor interaction with peripheral devices such as the mouse and the keyboard. In this paper, we introduce
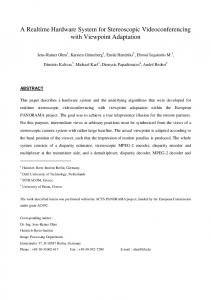
the Sensor Information Interactive System (SIIS) (Fig. 1) which utilizes a new mechanism to interact with sensor information collected from sensor networks. It provides us with a new platform for intuitive visualization and interaction with sensor information through a multi-touch interface rather than clicking a mouse and reading numeric data from a conventional computer screen. Currently, it consists of two tables; one is a multi-touch table; the other is a smart dinner table [2]; two tables are connected through the Internet, based on asynchronous information requests and responses which are functionalities simplified from the Ajax architecture [3]. In the experimental environment, the smart table consists of a wireless sensor network connected to dozens of sensors which are mounted on the top. The multi-touch table interface provides capabilities of real-time monitoring and interactivity to collected sensor information from the smart table. The SIIS provides us with a new platform to interact with sensor information rather than clicking for selection with a mouse and reading numeric data from a conventional computer screen. The rest of the paper is organized as: Section II reviews the state of the art of multi-touch/gestural interactive mechanisms for information processing. Section III focuses on introducing the infrastructure of SIIS and its main features. Section IV and V separately describe how we implement SIIS and the validation scenarios and results. Finally, Section VI concludes this paper and our work to date. It also briefly describes our work in the future. II. R ELATED WORK Multi-touch interaction can potentially reduce the limitations by which we currently interact with information as it provides more degrees of freedom for intuitive interaction. It has gained significant development efforts from companies like Apple and Microsoft. Representative products are iPhone [4] and Surface [5] which integrates multi-touch interaction capabilities with common objects: a cell phone and a table. Our preconceptions of digital information being constraint within the boundaries of computer screens and PDAs are changing as multi-touch/gesture interaction systems have enabled digital information to be accessed from walls, tables and
Fig. 1.
Architecture of SIIS
other surfaces. Popular surface computing technologies such as Microsoft’s Surface demonstrate where user interfaces are embedded onto a surface of a table. A multi-touch collaborative wall invented by Jeff Hann of Perspective Pixel [6] has gained much attention and its applications have been used in many contexts. And more recently Sixth Sense [7] implemented by Pranav Mistry at the MIT Media Lab, has demonstrated the scalability of surface computing where information is projected onto various surfaces. Optical tracking in conjunction with gesture recognition enables common surfaces like walls and physical objects become interactive interfaces. These projects demonstrate the affordances of surface computing facilitating people to interact, in a way that feels familiar in the real world. They have shown how accessible and flexible digital information can be where people can directly interact using a more natural form of interaction such as multi-touch gestures. However they have not shown where multi-touch interaction could also facilitate monitoring and interaction with real-time information collected from practical deployed sensors; especially where the information is crucial in exploiting the inner or outer properties of the sensed objects. A mechanism of intuitive demonstration and simple interaction is quite necessary and feasible for efficiently handling sensor information based on multi-touch technology. Current research has primarily focused upon utilising gestural systems for stand-alone applications, where data services are deployed locally and there is no support for external technologies like sensor networks. The project Wireless Sensor Networks: a building block for Mass Creativity and Learning [8] presents an early stage of integration of a WSN with multi-touch technology . In this work a multi-touch interface displays creative visualisation animations reflecting the change in the environment where temperature, CO2 and light sensors monitor the alternating environmental conditions. However, in this project, users can only monitor sensor information through animation. It is unable to provide users with optimal retrieval
of specified sensor information; but such user customization requirements are very common in engaging with sensor information. III. S ENSOR I NFORMATION I NTERACTIVE S YSTEM The main purpose of developing SIIS is to enable intuitive visualization and interactive capabilities to deal with realtime sensor information harvested from our smart object. Thereafter, the SIIS consists of two subsystems: a multi-touch system and a smart object. The following paragraphs describe the subsystems individually and how they are integrated. A. Multi-touch Interface Illustrated in Fig. 1, is the multi-touch system implemented in SIIS, which is based on optical tracking and computervision technique. Diffused Surface Illumination (DSI) [9] is selected to incorporate lighting the flat screen display surface with infrared light (Fig. 2). Finger touches on the display interface cause reflection of the infrared light beam which can be detected by the infrared camera. The camera is only susceptible to infrared light as a band pass filter is used to block out all visible light except for the same wavelength of the emitted infrared light. Optical tracking software processes the images from the infrared camera. Detected images of infrared reflections are in shape of “blobs”; these “blobs” are processed into touch points, which can be utilized by multitouch software later. DSI setup, which is presented in Fig. 2, is closely based on the setup of Frustrated Total Internal Reflection (FTIR) [6], which was developed and popularized by Jeff Hann. However the IR-emitting surface, in our DSI system, uses a special type of transparent Plexiglas called Endlighten arcrylite which is different than ordinary Plexiglas used with FTIR, where the surface of the acrylic is covered with a thin layer of silicon. Open source cross-platform solution Community Core Vision (CCV) [10] is the optical tracking software used in
Fig. 3.
Fig. 2.
DSI system setup in SIIS
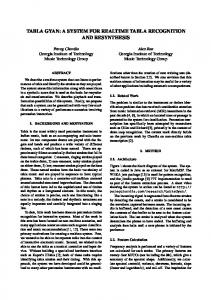
SIIS for computer vision and machine sensing. It interfaces with the video stream from the camera and outputs the tracking information such as coordinates, sizes of “blobs” and touch events (finger down, moved and released). CCV can also be customized for different multi-touch displays through configuration, calibration and settings’ optimization. In SIIS, the selected multi-touch software incorporates the TUIO framework [11] which is used to encode/decode the tracking data using the Open Sound Control (OSC) format [12]. B. Smart Object Definition of smart object varies according to different context. In SIIS, our smart object is a common object in the living environment with embedded sensing, processing and communicating capabilities. It is able to sense and propagate sensed data to collecting points through wired/wireless network or shared between devices within a network. Collected data can be utilized in meaningful visual models, which represent interesting profiled information of the real smart object. In our implementation of the SIIS, the smart object is a wooden dinner table, on which 60 strain gauges are deployed at 30 points in orthogonal pairs as shown in Fig. 3. These strain gauges are assigned to 10 wireless sensor nodes deployed in 10 sections; one node is located in each section and directly connected to 6 strain gauges. Collected sensor data is transmitted from each node to a base station through a twotier hierarchy wireless sensor network. The first tier consists of sensor nodes and cluster heads. 10 sensor nodes are divided into 2 clusters; 5 nodes are involved in each cluster organized with a star-type topology. The second tier consists of cluster heads and the base station implemented with AODV routing protocol [13] enabling the ad hoc capability. C. System Integration Two subsystems are integrated through web technology including client/server scripts and database. A data centre located in a laptop consists of MySQL database 5.1, Apache server 2.2 and PHP server 5.2. Incoming data packets received
Strain gauges deployment on smart table
on the base station are passed to the data centre through the UART connection. After being parsed, extracted sensor information is stored into the database; then it is available on the multi-touch interface through web services provided by the web server in the data centre. On the multi-touch interface, JavaScript are used to specify requirements of sensor information for real-time visualization in 3-D/2-D application modes. Users’ customization of information is translated into queries by JavaScript. Through this infrastructure, all information about the smart table is able to be remotely accessed over the Internet according to users’ specification initiated by touch inputs on the multi-touch interface. IV.
SYSTEM IMPLEMENTATION
The implementation of SIIS is based on the principle of providing an intuitive operative interface for users, nontechnique users especially, to access real-time sensor information through a more meaningful way, rather than plain numeric data displaying in tables and boxes. Direct natural gestures (touch for example) are utilized for controlling information acquisition as opposed to mouse clicking. A. System specification The detailed technique requirements of SIIS are categorized as sensor information acquisition, information presentation and HCI which are listed below: • Information acquisition - The default refresh interval for sensor information is set to 1 second. Ajax architecture contributes as providing capabilities of asynchronous information exchanging and non-block processing. It also isolates the data centre and the smart object from the multi-touch interface. • Presentation - Meaningful presentation of information is the major advantage of SIIS. Heat map visualization is selected to represent strain information across the whole surface of the smart object. Colour diffusion illustrates the strain distribution on the surface of the smart table. The value of the colour is calculated through interpolation based on the discrete strain information collected from strain gauges. • HCI - Configurable interaction is available on the multitouch interface. The interface enables users to directly
touch multiple points on the virtual smart table simultaneously for acquiring further information. Acquired information is displayed in an alphanumeric format. The advantage of the HCI in SIIS is that sensor information about different parts on the surface of the smart table can be reviewed simultaneously as the user touches multiple points on the multi-touch interface at the same time. B. System Development Implementating SIIS comprises the development of the data centre and the development of the multi-touch interface. Raw sensor data collection is introduced in the previous work [2]. After parsing, extracted information is stored into MySQL database on the data centre. A web server is also set up on the data centre executing PHP scripts, which are in charge of processing received requests for information. The client is the multi-touch interface which initiates those requests through JavaScript. The SIIS’s multi-touch interface software is developed with Unity3D [15] game engine using uniTUIO [16] library which consists of specified C# scripts that support multitouch events handling. 3-D models of the smart table and environment are created in Cinema 4D [17] and exported as FBX files [18] which can be directly imported into Unity3D. Interactivities of GUI components such as windows, buttons, icons and menus are all scripted through JavaScript and C# scripts. JavaScript also takes responsibility of coordinating information acquisition. The received information is used to generate the real-time heat map, or displayed in tables. All information requests initiated by JavaScript communicate with server scripts asynchronously. Thereafter, GUI tasks running on the interface won’t be interrupted theoretically. The SIIS’s GUI design is also optimized for multi-touch interaction based on systems guideline for designing gestural interfaces as specified by Stacey D Scott et al [19] and Dan Saffer in Designing Gestural Interfaces [20].
V. SYSTEM VALIDATION Validation of SIIS consists of two sets of experiments; firstly, functional experiments in the applications both 3-D and 2-D scenes; secondly, informational experiments in both 3-D and 2-D contexts. Experiment setup is illustrated in Fig. 4 in which an example screenshot of SIIS’s 3-D scene is also shown in the space above the multi-touch interface. Functional experiments (see Fig. 5) involve all noninformational operations on the multi-touch interface. • Function activation in both 3-D and 2-D scenes through direct touches (see Fig. 5(a)) on the multi-touch interface. • 3-D/2-D scene switching. User switches from the 3-D scene to the 2-D top view of the smart table’s surface by directly touching on the table in the 3-D scene, as shown in Fig. 5(b). In the 2-D scene, user switches back to 3-D by touching a functional button. • First-person-view navigation in the 3-D scene, see Fig. 5(c). User navigates around the smart table in the virtual environment. • Basic multi-touch interactions in the 2-D scene, which are virtual object moving, scaling and rotating, as displayed in Fig. 5(d).
Fig. 5. (a) Multi-touch interactions; (b) Touch switch from the 3-D scene to the 2-D scene; (c) Touch navigation in the 3-D scene; (d) Touch control in the 2-D scene
Fig. 4.
Multi-touch Interface (left); Smart Object (Right)
Informational experiments have been done to validate realtime information visualization and customized information acquisition. • Visualization of real-time sensor information in both 3D and 2-D environments as demonstrated through a heat map of strain distribution. – Standard weight is put on the surface of the smart table. The position of the weight on the surface of the
•
smart table is displayed in Fig. 6(a); the screenshot of the real-time strain heat map is illustrated in Fig. 6(b). – Hand pressure implemented on the surface of the smart table. The position of hand pressing on the surface of the smart table is displayed in Fig. 6(c); the screenshot of the real-time heat map of strain distribution is presented in Fig. 6(d). Single or multiple touch acquisition of customized sensor information related to the active sensing area of the smart table in the virtual 2-D environment. The example operation and the screenshot are displayed in Fig. 7(a) and Fig. 7(b) individually.
the current experimental setup and software implementation. Multiple sensor information is able to be acquired at the same time according to coordinates of touches. However, numeric information is only displayed in preset areas on the interface for the consideration of the system performance. In the next stage, the performance issue needs to be solved by using a powerful workstation and optimizing interpolation algorithms for visualization. More smart objects will be integrated; and actuations will be enabled to allow smart objects to be reactive to instructions initiated from the gestural multi-touch interface. Portable devices like iPhone and iPad [21] are also being considered for supporting SIIS applications in the next stage. ACKNOWLEDGMENT This work is partially supported by the Irish Higher Education Authority. R EFERENCES
Fig. 6. (a) Weight’s pressure on the smart table; (b) Screenshot of the realtime heat map of the weight’s pressure; (c) Hand’s pressure on the smart table; (d) Screenshot of the real-time heat map of the hand’s pressure
Fig. 7. (a) Information acquisition on multi-touch interface; (b) Screenshot of information acquisition
VI.
CONCLUSION AND FUTURE WORK
In this paper, we presented a novel mechanism and an implementation of a system enabling real-time visualization and multiple touch interactivities with sensor information on a multi-touch interface. The SIIS takes advantages of multi-touch technology and changes the way we access information collected from networked sensors. This system is validated through scenarios of experiments on aspects of real-time visualization and customized multi-touch gestures to review numeric information simultaneously. Experimental results illustrate that in both 3-D and 2-D environments, realtime visualization is achieved; but performance lag exists in
[1] Communication From The Commission To The European Parliament, The Council, The European Economic And Social Committee And The Committee Of The Regions, Internet of Things- An action plan for Europe, Brussels, June 18th.2009,COM(2009) 278 final. [2] Liang, J., Lishchynska, M., and Delaney, K. “Distributed Adaptive Networked System for Strain Mapping”, Proceedings of UBICOMM’09. [3] Garrett, J. J. “Ajax: A New Approach to Web Applications”, http: //adaptivepath.com/ideas/essays/archives/000385.php, 2005 [accessed 14th, April] [4] Apple iPhone, http://www.apple.com/iphone [accessed 13th April, 2010] [5] Microsoft Surface, http://www.microsoft.com/surface/Default.aspx [accessed 13th April, 2010] [6] Han, J. Y. “Low-Cost Multi-Touch Sensing through Frustrated Total Internal Reflections”, Proceedings of the 18th annual ACM symposium on User interface software and technology, 2005 [7] Mistry, P., Maes, P., Chang, L. “WUW - Wear Ur World - A Wearable Gestural Interface”, Proceedings of the 27th international conference extended abstracts on Human factors in computing systems, 2009 [8] Hsu, S., Tygar, J. D. “Wireless Sensor Networks: a building block for Mass Creativity and Learning”, Proceedings ACM Creativity & Cognition 2009, Understanding the Creative Conversation Workshop, October 2009 [9] Diffused Surface Illumination. http://nuigroup.com/forums/viewthread/ 1982/ [accessed 14th April, 2010] [10] Community Core Vision. http://ccv.nuigroup.com/ [accessed 14th April, 2010] [11] Kaltenbrunner, M. “reacTIVision and TUIO: A Tangible Tabletop Toolkit”, Proceedings of the ACM International Conference on Interactive Tabletops and Surfaces (ITS2009). Banff, Canada. [12] Wright, M., Freed. A. “Open Sound Control: A New Protocol for Communicating with Sound Synthesizers”, International Computer Music Conference, Thessaloniki, Greece, 1997. [13] Gomez, C., Salvatella, P., Alonso, O., and Paradells, J. “Adapting AODV for IEEE 802.15.4 Mesh Sensor Networks: Theoretical Discussion and Performance Evaluation in a Real Environment”, In International Symposium on a World of Wireless, Mobile and Multimedia Networks, 2006. [14] Yick, J., Mukherjee, B., Ghosal, D. “Wireless sensor network survey”, Computer Networks: The International Journal of Computer and Telecommunications Networking. Volume 52, Issue 12, August 2008. [15] Unity3D, http://unity3d.com/ [accessed 14th April, 2010] [16] XTUIO, http://www.xtuio.com/ [accessed 14th April, 2010] [17] Cinema 4D, http://www.maxon.net/ [accessed 14th April, 2010] [18] Autodesk FBX, http://usa.autodesk.com/adsk/servlet/pc/index?id= 6837478&siteID=123112 [accessed 14th April, 2010] [19] Scott, S. D., Grant, K. D., and Mandryk, R. L. System guidlines for colocated work on a tabletop display Springer 2003 [20] Saffer, Dan. In Interactive Gestures: Designing Gestural Interfaces, O Reilly Media, Inc, 1005 Gravenstei Highway North, Sebastopol, CA 95472, 2008 [21] Apple iPad, http://www.apple.com/ipad [accessed 14th April, 2010]