Journal of Data Science 9(2011), 607-623
To Do or Not To Do Business with a Country: A Robust Classification Approach Kuntal Bhattacharyya1 , Pratim Datta2 and David Booth2∗ 1 Indiana State University and 2 Kent State University Abstract: In the face of global uncertainty and a growing reliance on third party indices to gain a snapshot of a country’s operations, accurate decision making makes or breaks relationships in global trade. Under this aegis, we question the validity of traditional logistic regression using the maximum likelihood estimator (MLE) in classifying countries for doing business. This paper proposes that a weighted version of the Bianco and Yohai (BY) estimator is a superlative and robust (outlier resistant) tool in the hands of practitioners to gauge the correct antecedents of a country’s internal environment and decide whether to do or not do business with that country. In addition, this robust process is effective in differentiating between “problem” countries and “safe” countries for doing business. An existing “R” program for the BY estimation technique by Croux and Haesbroeck has been modified to fit our cause. Key words: Global supply chain, outlier management, robust logistic regression, country risk.
1. Introduction Over the past quarter century, economic, socio-cultural, and geo-political mobility, at par with technological advancements and the deregulation of trade, have made global sourcing a reality. In his best-selling book “The Lexus and The Olive Tree”, Thomas Friedman observes: “Globalization is not a phenomenon. It is not some passing trend. Today, it is an overarching international system shaping the domestic politics and foreign relations of virtually every country, and we need to understand it” (Friedman, 2000; p. 7). Supply chains span the globe. Take for example the global supply chain of Dell Inc. for a PC assembly. To assemble a PC, Dell sources memory chips (RAM) and optical drives (CD-RWs, DVD-RWs) from Japan, network cards (for Wi-Fi or Ethernet), monitors, and cooling fans from Taiwan, hard drives from Singapore, ∗
Corresponding author.
608
Kuntal Bhattacharyya, Pratim Datta and David Booth
video cards from Hong Kong, sound cards from France, microprocessors from the USA, keyboards from Mexico, and so on. As supply chains spread globally, risks of operational disruption become less controllable and more costly. As an example, in June of 2009, Mexico lost $57 million per day from operational threats related to the H1N1 virus; furthermore, two days after the H1N1 was defined as a pandemic by the World Health Organization (WHO), the US closed all land routes to and from Mexico (Shah 2009). Supply chain managers need to consider such risks and/or uncertainties in making off-shoring and trade-partnering decisions across countries. Looking back at Dell’s supply chain, if due to unavoidable circumstances like the outbreak of H1N1, Mexico fails to deliver the keyboards within Dell’s scheduled delivery window, the end-customer does not receive the finished good (the Dell PC) in time. The dependence of Dell on multiple countries for its finished product illustrates the importance of the choice of a country in today’s global supply chains. In global supply chains, operational risks thus encompass disruptive threats tied to a trading partner’s country of origin. These operational risks stem from governance problems, geographic separation and cultural gap between trading partners, and bipartite limitations of communications in information transparency (Aron, Clemons and Reddi, 2005). In short, a lack of arms-length transactions, imperfect and asymmetric information, risk of the loss of intellectual property, costs of monitoring reliability, quality, and threats, and operating in regulatory mazes are just a sample of the myriad economic, technological, socio-cultural, and political uncertainties that affect the performance of global supply chains. Therefore, an improved understanding of country-level operational risks is a prelude to initiating global sourcing and trading. As assessment yardsticks, third party indices, by constructing a multifaceted view of a country’s internal environment as pointed out by Aron, Clemons and Reddi (2005), often provide useful information as harbingers to a country’s operational risks. Bhattacharyya et al. (2010) provides a good overview of these third party indices and their role in understanding country operational risks. In a flat and uncertain world, it is thus rewarding for practitioners and researchers alike to understand the relationship of a country’s governance environment to operational risk and the subsequent consequences on the decision to do business with that country. The country thus offers an institutional aegis; and as the world gets “flatter”, the choice of a country for doing business becomes more critical than ever (Doidge et al., 2007). Thus, we ask: how can companies effectively classify and choose countries for global business? In addressing this selection procedure, we investigate the success rate and validity of prevailing selection techniques in providing correct, intuitive answers for future decision making by studying a sample of 81 member countries of the World Trade Organization (WTO). Due to
A Robust Classification for Doing Business
609
the dichotomous nature of the outcome variable in our discussion (the choice of “doing” vs. “not doing” business with a country), logistic regression is a natural choice for prediction purposes among academicians and practitioners, alike. For a good review of the epistemological aspects (nature and use) of logistic regression in applied research, a reading of Peng, Lee and Ingersoll (2002) is advocated. In our research on the prevailing selection procedure using logistic regression, we are particularly interested in how this procedure copes with countries having extreme “operational risk” ratings. This paper designates these extreme cases as problem countries. These problem countries, which are not representative of the rest of the countries in our dataset, are defined as outliers in statistics. Traditional logistic regression methods use the maximum likelihood estimator (MLE), which defines a predicting solution that tries to balance the effect of outliers (problem countries in our context) and the effect of the vast majority of the remaining data, and is hence, a good representation of none (Booth, 1981; Pregibon, 1981). A predicting solution influenced by outliers can thus lead to misleading classifications of doing (or not doing) business with a country, which can have dire consequences. In addition, a predicting solution under the influence of an outlier raises serious questions about the true statistical significance of the variables (the third party indices in this study) used to explain the outcome decision of doing vs. not doing business with a country. In addressing these issues, this paper proposes that a weighted version of the Bianco and Yohai (BY; 1996) estimator, free of distributional assumptions and outlier-effects, is a superlative tool in the hands of practitioners to gauge the correct antecedents of a country’s internal environment and is thus capable of making better, more intelligent, and more informed decisions whether to do or not do business with a particular country. The remainder of this paper is arranged as follows: Section 2 addresses the theoretical background and concerned literature pertaining to inefficiencies with logistic regression and the efficiency of robust methods. Section 3 lays out the research design and sample used for this study. Section 4 discusses the results; we compare and contrast the outcomes of the traditional MLE Logistic Regression to those of a Robust Logistic Regression on the same dataset. Finally, Section 5 concludes with a discussion of the results and the contributions of this study. 2. Theoretical Background and Literature Logistic regression, like most other multivariate methods, suffers from poor outlier management. To circumvent this problem with outliers, in the past quarter century, many researchers have chosen the route of obtaining robust estimates of the parameter in a logistic regression model. Of these researchers, Pregibon (1982), Stefanski et al. (1986), Copas (1988), Kunsch et al. (1989), Carroll and
610
Kuntal Bhattacharyya, Pratim Datta and David Booth
Pederson (1993), Bianco and Yohai (1996), and more recently Croux and Haesbroeck (2003), Bondell (2005), and Bianco and Martinez (2009) deserve special mention. Pregibon (1982), in his attempt to reduce the influence of outliers in logistic regression, analyzed the well-known vasoconstriction data set (Finney, 1947) and proposed to modify the goal function using a monotone loss function ρ (in the Huber type family) in order to give less weight to those observations which were poorly predicted by the model. However, the resulting estimators were not consistent. Stefanski et al. (1986), in realizing the threat of misclassified observations in creating outliers also proposed estimators to down weight them. Copas (1988) contrasted these two forms of robust estimates: the robust-resistant estimates due to Pregibon (1982) and an estimate based on a misclassification model. Copas concluded the estimate from the misclassification model to be a preferred method as it withheld the robustness from Pregibon’s method while reducing sample size bias. However, the estimates derived under Copas’s misclassification model were not consistent in the logistic model. Carroll and Pederson (1993), riding on methods which down-weight on the basis of extreme leverage and/or extreme predicted values, provided a simple method that corrected the misclassification estimate to restore consistency in logistic models. Later on, Bianco and Yohai (1996) introduced a more robust and more consistent class of M-estimators by including a bias correction term to Pregibon’s work and by using a bounded loss function. In this paper we have used a weighted version of the Bianco and Yohai (BY; 1996) estimator that was introduced by Croux and Haesbroeck (2003). The weighted version of the BY estimator as proposed by Croux and Haesbroeck (2003) is an objective weight function that depends only on a robust Mahalanobis distance of the explanatory variables. The estimator is indexed by a tuning constant, variation of which yields a trade-off between robustness and efficiency (Bondell, 2005). The presence of un-weighted leverage points may inflate the estimator of the covariance matrix and spoil the test statistic. Down-weighting an outlying point in the space of explanatory variables, thus, prevents high leverage points. As the weights are based only on the values taken by the explanatory variable, the resulting estimator is consistent without any more distributional assumptions, and is also more robust than the weighted maximum likelihood estimator to vertical outliers. 3. Research Design and Hypotheses 3.1 Choice of Variables and Related Hypotheses Every year, Economist Intelligence Unit (EIU), the research wing of The
A Robust Classification for Doing Business
611
Economist magazine draws upon peerless databases of macroeconomic, microeconomic, and socio-demographic data and forecasts for 203 countries and produces a ranking of countries based on the risk of business operations in these countries. This listing has widely been used by practitioners for sourcing purposes (Somerville and Taffler, 1995; Oetzel et al., 2001). The level of risk is specified in a range of 0-10, 10 being highest risk and 0 being lowest risk. While EIU lists the various criteria that fit the definition of “operational risk” in a country, the exact design used to come up with the listing is kept confidential, arguably for business competitiveness. This creates two problems: one, a company that sources globally does not have the transparency of understanding the features that go into choosing a country for doing business. As a result, in the event of disruptions, it is hard to point out problem areas that could be addressed and negated; two, a company that sources globally would ideally want to have flexibility to design a sourcing strategy that allows it to predict the future from the existing scenario. In this regard, the EIU listing almost resembles a hard-copy of facts that dictates: take it or leave. Following Bhattacharyya et al. (2010), we have thus used specific third party indices to define a country’s internal environment, which in turn dictates a country’s operational risk. EIU estimates the operational risk of a country by virtue of its (i) foreign trade and payment issues, labor market and macroeconomic risks, all of which tie with the attributes of a third party index measuring economic freedom - Heritage Foundation’s Economic Freedom Index (HFEFIndx); (ii) tax policies, financial risks, regulatory environment, and the overall standard of local infrastructure, all of which tie with the attributes of another widely used third party index measuring financial standards and compliance - Moody’s Credit Rating (Moody); and (iii) government effectiveness, political stability, security, and legal environment, all of which tie with the attributes of another third party index measuring economic growth and liberty - The World Economic Forum’s Global Competitive Index (WEFGCIndx). We are thus defining a country’s internal environment as a mix of the country’s business environment (a measure of economic freedom and financial standards and compliance) and its socio-economic environment (a measure of economic growth). Our outcome of interest in this study is the choice a company makes in doing (or not doing) business with a country. To evade controversy, we decided to design our experiment such that a country with operational risk rating equal to or greater than 5 would not be chosen for doing business, whereas, a country with rating less than 5 would be chosen1 . For a detailed understanding of the three 1
Practitioners and Academicians are encouraged to exercise flexibility in this regard. As an example, a very conservative sourcing manager may re-design our model such that countries with risk rating less than 4 would be chosen for doing business; alternatively, an aggressive manager may choose to consider countries with risk rating less than 6 for doing business!
612
Kuntal Bhattacharyya, Pratim Datta and David Booth
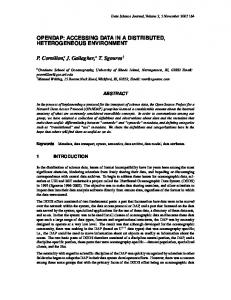
constructs (independent variables) used in this study, i.e. economic freedom, economic growth, and financial standards and compliance, as well as their impact on a country’s operational risk, we advocate a reading of Bhattacharyya et al. (2010). We accordingly hypothesize the following: H1 : Countries with more economic freedom will have less operational risks than countries with less economic freedom and are hence more favorable to doing business. H2 : Countries with higher financial standards and compliance will have lower operational risks than countries with lower financial standards and compliance, and are thus more favorable to doing business. H3 : Countries with higher economic growth rates will have less operational risks than countries with lower economic growth rates, and are thus more favorable to doing business. Figure 1 summarizes these relationships and the related hypotheses.
H1 + Economic Freedom Financial Standards and Compliance
H2 +
Decision to do Business
H3 + Economic Growth Figure 1: Working model and hypotheses
3.2 Choice of the Sample We empirically investigate 81 member countries2 of the World Trade Organization (WTO) using archival data collected from UN agencies, independent think tanks, the WTO, and the EIU. Our sample of 81 countries out of the 153 WTO 2 This dataset with a detailed country list has previously been used in a different research on understanding operational risks by Bhattacharyya et al. (2010).
A Robust Classification for Doing Business
613
member nations is approximately 52 percent of the WTO members. We have 10 countries from Africa, 18 from Asia, 9 from Eastern Europe, 7 from the Middle East, all 3 countries in North America, 12 from South America, and 22 countries from Western Europe. It is, thus, safe to assume that our dataset is neither regionally nor geographically biased and representative of the WTO member set and is not likely to taint any inferences in our study. As these third party indices had different scaling systems (as an example, the Heritage Foundation Economic Freedom Index uses a 100-point scaling system, while Moody’s and the World Economic Forum Global Competitive Index use a 7-point scale), we transformed all the indices into a 10-point scale. Given that the data originates from independent sources and observations, there is no propagated bias from the use of a common method to assess the antecedents and outcomes. The third party indices used in the analysis are world bodies with global data, and are hence devoid of any country specific bias. 3.3 Choice of the Statistical Method for Analysis The connection between operational risk and choice of doing business was made as follows: any country with operational risk greater than or equal to 5 (on a measured scale of 0 through 10) was given a value of ‘0’, i.e. not suitable for doing business; thus all countries with operational risk ratings less than 5 are given a value of ‘1’, i.e. suitable for doing business. The binary nature of our dependent variable (0 or 1) has properties that violate the basic Gauss-Markov assumptions of ordinary least squares (OLS) techniques. First, the error term follows the binomial distribution instead of the normal distribution, therefore invalidating all statistical techniques based on the assumption of normality. Second, the variance of a dichotomous variable is NOT constant, thus creating instances of heteroscedasticity as well. Third and finally, neither of these two violations can be remedied through transformations of the dependent or independent variables. This is where logistic regression comes to the rescue. Since presentation of the non-metric character of our dichotomous (business vs. no business) dependent variable as two groups of interest (i.e. a binary variable with values 1 and 0, respectively) is parsimonious, logistic regression was a natural choice. Its unique relationship between dependent and independent variables require a different approach in estimating the variates, assessing goodness of fit, and interpreting the coefficients. We randomly chose 80% of the 81-country WTO dataset and used those 65 data points for ‘training’ the data for logistic regression analysis. We used the remaining 16 data points for cross-validation of classification. We use the following model specifications to test our hypotheses: Log[P/(1 − P )] = β0 + β1 ∗ X1 + β2 ∗ X2 + β3 ∗ X3 + ε,
(3.1)
614
Kuntal Bhattacharyya, Pratim Datta and David Booth
where Log [P/(1 − P )] = the Logit value in logistic regression, P 1−P
= probability of business = 1, = probability of NO business = 0,
β0 = Intercept, X1 = Economic Freedom (Heritage Foundation Index; HFEFIβ1
ndx), = Logistic coefficient for X1 ,
X2 = Financial Standards & Compliance (Moody’s Credit rating; Moody), β2 = Logistic coefficient for X2 , X3 = Economic Growth (Word Economic Forum Global Competitive Index; WEFGCIndx), β3 = Logistic coefficient for X3 , ε = Unexplained Error. 3.4 The Need for Robust Estimations The fact that the maximum likelihood estimator (MLE) of the logistic regression coefficient β can be severely affected by outlying observations is now a well established fact (Croux et al., 2002; Bianco and Martinez, 2009). Croux et al. (2002), in their discussion of the MLE’s breakdown behavior in the logistic regression model showed that the MLE broke down to zero when severe outliers were added to the dataset. The weighted version of the BY estimator as proposed in this paper is a weight function that depends on a robust Mahalanobis distance of the explanatory variables. As the weights are based only on the values taken by the explanatory variables, the resulting estimator is expected to be more consistent without any more distributional assumptions, and is also more robust than the weighted MLE. In addition, a proper understanding of the Wald-type z statistic for the tests of hypotheses on individual logistic regression coefficients in the MLE logistic regression model as advocated by Bianco and Martinez (2009) and successfully implemented by Hauser and Booth (2010, 2011) in the robust scenario, are critical. Bianco and Martinez (2009) showed that the BY estimates in a Wald-type statistic yielded an asymptotic central Chi-square distribution, similar to that generated by the classical Wald statistic. With the knowledge of an asymptotic chi-squared distribution of the Waldtype z statistics, we thus re-analyze the WTO dataset by using a robust ‘outlier
A Robust Classification for Doing Business
615
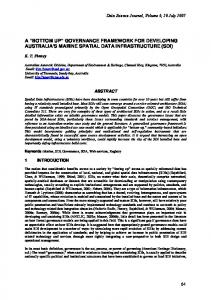
resistant’ estimation, utilizing Bianco and Yohai’s (1996) robust estimation procedure in the logistic regression model as described in Croux and Haesbroeck (2003) that now gives us a prediction equation without the influence of outliers. The following section compares and contrasts the results from the MLE vs. the robust estimators. The results are found to be much less affected by outliers when compared to the MLE effect. 4. Results The non-linear nature of the logistic transformation requires that the maximum likelihood procedure be used in an iterative manner to find the most likely estimates of the coefficients. The Hypothesis for this test is as follows: H0 : β1 = β2 = β3 = 0, Ha : at least one β 6= 0, i.e., if we reject H0 , at least one of the predictors is a good predictor, and hence the model is workable. As regards to the fit of the MLE logistic regression model explained in equation (3.1), the p-value of the chi-square tests for the maximum likelihood procedure reveals a value < 0.001, which is significant at the usual 0.05 level; hence we reject the null hypothesis and conclude that the model is workable. We apply our fitted model to the 16 data points out of our 81 data points that were chosen randomly for the analysis, and conduct a cross-validation of the classification. Only two out of the 16 were misclassified. We conducted a residual analysis on the MLE logistic regression model to confirm the validity of the results (Pregibon, 1981). The residual plots (Figure 2) for the MLE logistic regression model that was earlier statistically inferred to be ‘workable’ clearly suggest the presence of non uniform variance across the plane, which is due to outliers. To be precise, our residual analysis shows seven data points (countries) with extreme residuals (higher or lower) than the others in the data set; these are identified as outliers in Table 1. The prediction equation from this regression model, based on the maximum likelihood of occurrence of an event (in this case, the event is ‘doing business’), tries to balance the effect of these extreme countries and the effect of the remaining vast majority of data, and is hence, a good representation of none (Booth, 1981; Pregibon, 1981). In order to mitigate the effect of these outliers in our predicted model and thus provide a robust model that can be utilized by practitioners operating globally, we use Bianco and Yohai’s (1996) robust estimation procedure in the logistic regression model as introduced by Croux & Haesbroeck (2003) to provide an ‘outlier resistant’ estimation. Table 2 illustrates the coefficients of the explanatory variables used in the MLE logistic regression and compares the results with those of robust logistic regression.
2 0
1
3 2 1
-2
-2
-1
-1
0
Residuals
3
Kuntal Bhattacharyya, Pratim Datta and David Booth Quantiles of standard n
616
-10
-5
0
5
10
-2
-1
0.0
0.2
0.4
1
2
0.00 0.10
0.20 0.30
Ordered deviance resi
Cook statistic
0.20 0.30 0.00 0.10
Cook statistic
Linear predictor
0
0.6
0
20
h/(1-h)
40
60
Case
Figure 2: Residual Plots for MLE Logistic Regression
Table 1: Outliers in the MLE logistic regression model Data Points
Country
Residual
13 27 49 41 56 39 45
Egypt Jordan South Africa Poland Romania Latvia Saudi Arabia
2.56 1.21 0.94 0.92 -1.02 -1.42 -1.94
80
A Robust Classification for Doing Business
617
Table 2: Comparison between MLE logistic regression and robust logistic regression models3 . Regular MLE Logistic Regression Coefficients
Estimate
Std Error
Intercept -28.810 10.123 HFEFIndx 5.6399 2.2339 Moody 1.0033 0.4196 WEFGCIndx -1.8423 1.6996
Wald z -2.846 2.525 2.391 -1.084
BY Robust Logistic Regression
p-value Estimate
Std Error
0.00443 -29.081 6.478 0.01158 7.023 1.807 0.01680 1.187 0.237 0.27837 -3.396 1.134
Wald p-value z -4.489 3.886 5.008 -2.994
0 0 0 0
3
The R program used in this paper is available from the corresponding author upon request.
The results in Table 2 reveal interesting results that justify the use of robust classification techniques to mitigate the influence of outliers in a prediction equation. At first sight, it is clear that while the estimates do not differ too much in the regular method vs. the robust method, the standard errors for each of the coefficients decrease considerably with the robust method. As a result, the corresponding Wald z statistics are much larger in the robust method when compared to the regular maximum likelihood method, thereby validating the fact that the Wald z statistics of the non-robust MLE method were subdued due to the effect of the outliers. To maintain consistency, we fitted our robust logistic regression model to the 16 data points out of our 81 data points that were chosen randomly for the analysis, and conducted a cross-validation of the classification. Once again, only two out of the 16 were misclassified. Table 3 lists the outliers from our robust model that are drastically different from the ones pointed by the regular MLE model (Table 1). Implications of these outcomes are discussed in detail in the next section. Table 3: Outliers in the robust logistic regression model Data Points
Country
Residual
64 3 59 53 52 62 10 33 61 36 46 19
Venezuela Bangladesh Ukraine Syria Switzerland United States Denmark Luxembourg United Kingdom New Zealand Singapore Hong Kong
14.3 10.75 10.68 10.42 -10.3 -10.3 -10.63 -11.07 -11.5 -15.4 -16.13 -17.17
618
Kuntal Bhattacharyya, Pratim Datta and David Booth
Finally, Table 2 helps us analyze and discuss the results for each of our hypotheses based on the estimation of our hypothesized model in Figure 1. Hypothesis 1 argued that greater economic freedom reduces operational risk, and thus favours doing business. The coefficient of economic freedom index is significant and positive both using the robust technique (β1 = 7.023, p = 0) as well as using the MLE technique (β1 = 5.639, p = 0.011). We thus conclude that (i) ‘the economic freedom index impacts the decision to conduct business with a country’, and (ii) that a country with higher economic freedom will be an easier choice for doing business. Hence, our results support this hypothesis. Hypothesis 2 argued that better financial standards and compliance reduces operational risk, and thus favours doing business. The coefficient of financial standards and compliance index is significant and positive both using the robust technique (β2 = 1.187, p = 0) as well as using the MLE technique (β2 = 1.003, p = 0.0168). We conclude that (i) ‘the financial standards and compliance index impacts the decision to conduct business with a country’, and (ii) that a country with higher financial standards and compliance will be an easier choice for doing business. Hence, our results support this hypothesis. The fact that a robust classification technique calculates a prediction equation without the influence of outliers leads us to the most interesting revelation from Table 2 in regards to our third hypothesis that establishes the superior nature of robust estimators (like the BY estimator used in this work) in treating data with outliers. Hypothesis 3 argued that greater economic growth will reduce operational risk, and thus enhance doing business. The regular MLE logistic regression results, which were influenced by outliers, advocated against our hypothesis (β3 = −1.84, p = 0.278). However, the ‘outlier resistant’ estimation using robust techniques bounces back with a statistically significant coefficient of the economic growth index (β3 = −3.396, p = 0), though the direction of causality as posited in our hypothetical model was reversed. The next section discusses this important finding as well as the anomaly of relationship direction in detail. 5. Discussion and Conclusion “I abhor averages. I like the individual case. A man may have six meals one day and none the next, making an average of three meals per day, but that is not a good way to live.” ∼Louis D. Brandeis, US Supreme Court Justice, 1916-1939 For entrepreneurs and mature businesses competing in a global economy, business survival hinges on a calculated, rather than a rash, insight on sourcing and market strategies. Consequently, companies need to rely on third party assessments of a country’s internal environment as a prelude to business decisionmaking. Third party indices, which serve as proxies to various facets of a country’s
A Robust Classification for Doing Business
619
internal environment, are instrumental in affecting the decision to do business in a country. Offering support to our hypotheses, all our three indices were statistically significant in describing the role of indices in choosing countries for business. This paper offers important contributions to research and practice. Firstly, the results in this article support our central argument that a robust logistic regression is a better classification tool to make decisions involving dichotomous outcome variables. Had we not conducted a robust classification based on our residual analyses, we would have deemed the economic growth variable to be statistically insignificant (based on a p-value of 0.278 from the MLE estimation) and inferred accordingly. The robust estimation, without the influence of outliers, reverses those results, making the economic growth index statistically significant, and thus completely changes the dynamics of the internal environment of a country that need to be studied before choosing it for doing business. Clearly, the robust model is a more precise tool in the hand of practitioners for application purposes, given that the model is devoid of the influence of outliers. Secondly, the fact that the results of our analysis yielded a negative coefficient for the economic growth index, thereby refuting our initial take from hypothesis 3 that better economic growth results in more business, calls for a discussion and an understanding of the dynamics. As evident from our discussion in the “Research Design” section, some of the elements that help us to understand economic growth (World Economic Forum Global Competitive Index 2010) include democracy, rights, and liberty. However, our results suggest that absence of democracy, rights and liberties can still lower operating risk in a country, thereby instilling trade. Bahrain, a small Persian Gulf country, is a case in point. Bahrain wins rich accolades for its vibrant and competitive banking market with few government restrictions. The indices for economic freedom and financial standards and compliance have in this process, traditionally overlooked the fact that Bahrain has had traditional monarchy and that the government has suppressed dissent for the past three decades. Amnesty International has, in the past noted that Bahrain’s political detainees have included “children as young as 10” (Solomon 2000)! Yet Bahrain ranks high in the list of favourable countries for doing business, adding fuel to our results that a low socio-economic environment can continue to garner high trade volumes. Third and finally, Tables 1 and 3 that show outliers from a regular MLE logistic regression and a robust logistic regression method respectively, tell a very interesting story regarding the success of using robust estimations in decision making involving variables with outliers. Table 1 shows that the regular maximum likelihood logistic regression model defined in equation (i) tries to balance the effect of these outliers as well as the rest of the data (and hence does injustice
620
Kuntal Bhattacharyya, Pratim Datta and David Booth
to both sides). The fact that Latvia and Romania are low risk countries (based on residual sign and magnitude), while Poland (one of the fastest developing of all Eastern European countries) is a high risk country based on Table 1 is enough to question the validity of the classification. On the same note, Jordan has consistently been an US ally in world trade, while in this classification it is defined as a high-risk nation! Table 2 is a revelation for practitioners in that (i) these outliers are a completely different set from the outliers identified from the non-robust process; (ii) the robust model is devoid of any influence from these outliers and is good to use globally on any country and (iii) since negative residual values indicate low operational risks for countries and positive residual values indicate high operational risks for countries, practitioners can be relaxed about choosing a country from this list with a negative residual and should be very wary about choosing a country from this list with a positive residual. A quick look at the country list in Table 2 reveals that the results are etched in reality. We consider the results in Table 2 as congruent to a “smell test” of the validity of robust classifications. In other words, these are true outliers, and countries like Venezuela, Bangladesh, and Syria that have a high residual not only are at high risk of doing business with, but also are outliers in the sense that they do not follow the stable pattern of decision making as explained by the prediction equation of the robust regression. These are countries with high probabilities of unrest and instability, and the authors suggest special country-specific measures beyond regular statistical forecasting techniques in choosing these ‘problem countries’ for conducting business. Supply chain decisions are core to any business. This paper studies the choice of a country for doing business in the light of its internal environment. It turns out that a country’s competitive environment and socio-economic environment are good indicators for making this choice. In an era where information is only privy to a few and where the presence of not-so-reliable sources of information is abundant; information asymmetry, arising from miscued signals in decision making, can lead to dire consequences. Practitioners should find renewed hope in utilizing the ratings from these third party indices as proxies of a country’s internal environment to guide their decision of doing business with a country. As a corollary, firms are advised to have a better understanding of the antecedents of a country’s competitive environment (as measured by Heritage Foundation’s Economic Freedom index and Moody’s credit rating) and the country’s socio-economic environment (as measured by the World Economic Forum Global Competitive Index) before negotiating a business proposition with a prospective country. Last but not the least, this paper establishes robust logistic regression as a superior technique in classifying dichotomous outcome variables, when
A Robust Classification for Doing Business
621
compared to its MLE counterpart. Acknowledgements We would like to thank Dr. Croux and Dr. Haesbroeck for their R program, BYLOGREG that was modified in this paper to meet the appropriate needs. References Aron, R., Clemons, E. K. and Reddi, S. (2005). Just right outsourcing: understanding and managing risk. Journal of Management Information Systems 22, 37-55. Bhattacharyya, K., Datta, P. and Offodile, F. (2010). The impact of third-party indices on global operational risks. Journal of Supply Chain Management 46, 25-43. Bianco, A. M. and Yohai, V. J. (1996). Robust Estimation in the Logistic Model, in Robust Statistics, Data Analysis, and Computer Intensive Methods, 1734; Lecture Notes in Statistics 109, Ed. H. Rieder, Springer Verlag, New York. Bianco, A. M. and Martinez, E. (2009). Robust testing in the logistic regression model. Computational Statistics and Data Analysis 53, 4095-4105. Bondell, H. D. (2005). Minimum distance estimation for the logistic regression model. Biometrika 92, 724-731. Booth, D. E. (1981). The analysis of outlying data points by robust regression: a model for the identification of problem banks. Industrial Mathematics 31, 85-98. Carroll, R. J. and Pederson, S. (1993). On robust estimation in the logistic regression model. Journal of the Royal Statistical Society, Series B 55, 693-706. Copas, J. B. (1988). Binary regression models with contaminated data. Journal of the Royal Statistical Society, Series B 50, 225-265. Croux, C., Flandre, C. and Haesbroeck, G. (2002). The breakdown behavior of the maximum likelihood estimator in the logistic regression model. Statistics and Probability Letters 60, 377-386.
622
Kuntal Bhattacharyya, Pratim Datta and David Booth
Croux, C. and Haesbroeck, G. (2003). Implementing the Bianco and Yohai estimator for logistic regression. Computational Statistics and Data Analysis 44, 273-295. Doidge, C., Karolyi, A. and Stulz, R. M. (2007). Why do countries matter so much in corporate governance? Journal of Financial Economics 86, 1-39. Finney, D. J. (1947). The estimation from individual records of the relationship between does and quantal response.Biometrika 34, 320-334. Hauser, R. P. and Booth, D. (2010). Predicting bankruptcy with robust logistic regression. Journal of Data Science, Submitted. Hauser, R. P. and Booth, D. (2011). CEO bonuses as studied by robust logistic regression. Journal of Data Science 9, 293-310. Kunsch, H., Stefanski, L. and Carroll, R. (1989). Conditionally unbiased bounded influence estimation in general regression models, with applications to generalized linear models. Journal of the American Statistical Association 89, 543-549. Oetzel, J. M., Bettis, R. A. and Zenner, M. (2001). Country risk measures: how risky are they? Journal of World Business 36, 128-145. Peng, C. J., Lee, K. L. and Ingersoll, G. M. (2002). An introduction to logistic regression analysis and reporting. The Journal of Educational Research 96, 3-14. Pregibon, D. (1981). Logistic regression diagnostics. The Annals of Statistics 9, 705-724. Pregibon, D. (1982). Resistant fits for some commonly used logistic models with medical applications. Biometrics 38, 485-498. Shah, M. Is your supply chain catching flu? A Blog Report. May 24, 2009. http://www.infosysblogs.com/supply-chain/2009/05/is your supply chain catching.html. Solomon, C. Cracks in the Glass Ceiling. Business Services Industry, September 2000. May 22, 2009. http://findarticles.com/p/articles/mi m0FXS/is 9 79 /ai 65650779/. Somerville, R. A. and Taffler, R. J. (1995). Banker judgment versus formal forecasting models: the case of country risk assessment. Journal of Banking and Finance 19, 281-297.
A Robust Classification for Doing Business
623
Stefanski, L., Carroll, R. and Ruppert, D. (1986). Optimally bounded score functions for generalized linear models with applications to logistic regression. Biometrika 73, 413-424. World Economic Forum Global Competitive Index 2009-2010. Received August 9, 2010; accepted December 20, 2010.
Kuntal Bhattacharyya Marketing and Operations Department Scott College of Business Indiana State University Terre Haute, IN 47809
[email protected] Pratim Datta Department of Management and Information Systems Kent State University P.O. Box 5190 Kent, OH 44242-0001, USA
[email protected] David Booth Department of Management and Information Systems P.O. Box 5190 Kent, OH 44242-0001, USA Kent State University
[email protected]