A Semantic Environment Model for Crowd Simulation in Multilayered Complex Environment Hao Jiang∗ Institute of Computing Technology of the Chinese Academy of Sciences Graduate School of the Chinese Academy of Sciences Wenbin Xu† Tianlu Mao‡ Chunpeng Li§ Shihong Xia¶ Zhaoqi Wangk Institute of Computing Technology of the Chinese Academy of Sciences
Abstract Simulating crowds in complex environment is fascinating and challenging, however, modeling of the environment is always neglected in the past, which is one of the essential problems in crowd simulation especially for multilayered complex environment. This paper presents a semantic model for representing the complex environment, where the semantic information is described with a three-tier framework: a geometric level, a semantic level and an application level. Each level contains different maps for different purposes and our approach greatly facilitates the interactions between individuals and virtual environment. And then a modified continuum crowd method is designed to fit the proposed virtual environment model so that realistic behaviors of large dense crowds could be simulated in multilayered complex environments such as buildings and subway stations. Finally, we implement this method and test it in two complex synthetic urban spaces. The experiment results demonstrate that the semantic environment model can provide sufficient and accurate information for crowd simulation in multilayered complex environment. CR Categories: I.3.7 [Computer Graphics]: Three-Dimensional Graphics and Realism—Virtual Reality; Keywords: semantic environment model, crowd simulation, environment representation, continuum crowd
1 Introduction Recently, with the rapid development of the techniques, more and more applications related on crowds are appeared, which include ∗ e-mail: † e-mail: ‡ e-mail: § e-mail: ¶ e-mail: k e-mail:
[email protected] [email protected] [email protected] [email protected] [email protected] [email protected]
electronic games, film effects, virtual reality training system, urban public safety research, evacuation planning for emergency situations, and so on. Although many researchers have gained lots of great achievements in crowd simulation community, the modeling of the virtual environment is always neglected. The simulated environments sometimes are too simple so that there is no need to consider this issue. But in the complex environment, it is always multilayered and contains thousands of objects, so we have to design an elaborated representation model of the environment to facilitate not only our programming but also simulation. In fact, crowd simulation consists of two indispensable aspects. The first one is about environment representation. The virtual human chooses the path and action according to his/her location and surrounding information. For example, sensing obstacles and other agents to make avoidance, keeping standing pose in escalator and walking on flat surface. Consequently, the behavior animation of virtual pedestrians depends heavily on the interpretation of the virtual environment. But only a few works mentioned the modeling technique for multilayered complex environment. The second aspect is about crowd behavior generation. Several methods were distinguished such as flocking model, particle based and behavior system. These techniques can display various crowd motion characteristics, but only a few results are obtained in multilayered complex environment. Our work focuses on simulating large crowds in multilayered complex environment. In this paper, we present a novel hierarchy environment model to ease the simulation task in multilayered complex environment. And then a modified version of the continuum model from [Treuille et al. 2006] is used to exhibit smooth and continuous crowd movement upon the environment model. Our system has been tested on several challenging scenarios and acquired some visually plausible results. This paper is organized as follows: in Section 2, we review the previous works on environment representation and crowd models. And our three level environment model is presented in Section 3. Then, we introduce its applications which involved simulation technique, test cases and the experimental results. Finally, we draw some conclusions and further discussions.
2 Related Work In this section, we briefly review some relevant methods for environment representation and crowd models.
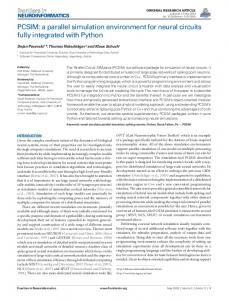
Figure 1: Hierarchy environment model.
2.1
Representation of the Environment
Navigation is probably the most crucial behavior for crowds that can be simulated on a computer [Thalmann and Musse 2007]. Local controlled crowd models need tailored technique to solve the navigation problem. And in fact, these techniques are different interpretation of the environment used to guide the individual to their goals. Bayazit et al. presented a graph-based roadmap containing topological information and adaptive edge weights for global planning [Bayazit et al. 2002]. Sung et al. employed a fast path planner based on probabilistic roadmaps to navigate characters through environments [Sung et al. 2005]. Lamarche and Donikian presented an hierarchical path-planning algorithm based on topological precomputations [Lamarche and Donikian 2004]. An threelayer method for agent steering was introduced by Goldenstein et al [Goldenstein et al. 2001]. Kamphuis and Overmars extended path planning to exhibit realistic coherence [Kamphuis and Overmars 2004]. Sud et al. used Voronoi graphs to compute and update navigation graphs [Sud et al. 2007a]. Yersin et al. presented a hybrid architecture in which different regions exploit different planning algorithms according to their level of interest [Yersin et al. 2008]. Sud et al. used adaptive roadmaps to perform dynamic, global path planning simultaneously for independent agents [Sud et al. 2007b]. A two level navigation algorithm that combined a global roadmap and local planning method based on RVOs was introduced by van den Berg [van den Berg et al. 2008].Though each of the above mentioned techniques could be used to navigate many agents in a virtual world, none of them exhibited application results in multi-layered complex urban space which is the major concern of this paper. Pettre et al. [Pettre et al. 2006] proposed a novel navigation planning algorithm which could extract topologic information automatically and recognize walkable regions from geometric model of an uneven and multi-layered virtual environment, however, it is difficult to gain full-scale knowledge of objects and regions if there is no hand-marking but only use the geometric database directly. In [Shao and Terzopoulos 2005a; Shao and Terzopoulos 2005b], Shao and Terzopoulos modeled the virtual environment as a hierarchical collection of maps. With each of these maps designed for different purpose, the combination can support accurate and efficient environmental information storage and retrieval. As far as we know, this is the only one explicit environment model used in crowd simulation but it didn’t consider the special features of regions and objects in synthetic spaces.
2.2 Crowd Models In order to obtain highly autonomous characters animated in dynamic virtual worlds, cognitive modeling was introduced [Shao and Terzopoulos 2005a; Funge et al. 2005; Aylett and Cavazza 2001]. Cognitive models govern what a character knows, how that knowledge is acquired, and how it can be used to plan actions [Funge et al. 2005]. Though aforementioned works show ultra-realistic results but considerable efforts are needed to refine the accurate model. Crowd behavior generation method can trace back to the seminal work of Craig Reynolds in 1987 [Reynolds 1987]. The individuals in Reynolds’ model were called boids, and the behavior model showed that complex behaviors of the simulated flock can be obtained by simple local rules for the individuals. Reynolds later expanded his work to include additional behaviors such as seek, pursue and evade [Reynolds 1999]. Musse et al. introduced a system which took sociological aspects into account to simulate crowd behavior [Musse and Thalmann 1997]. Brogan and Hodgins proposed an algorithm for controlling the movements of the creatures with significant dynamics [Brogan and Hodgins 1997]. Pelechano et al. accounted for psychological effect to decide agents’ actions [Pelechano et al. 2005]. Musse and Thalmann presented a hierarchical behavior model for real time simulation of virtual human crowds [Musse and Thalmann 2001]. Dirk Helbing and his team studied the characteristic features of escape panics and proposed social force model. This model assumed a mixture of sociopsychological and physics forces influencing the crowd behaviors in panic situations [Helbing and Molnar 1995; Helbing et al. 2000]. Sung et al. used a probabilistic method to steer characters to their goal [Sung et al. 2004]. Chenney described a technique for representing and designing velocity fields using flow tiles [Chenney 2004]. The cellular automata based models are simple and efficient [Kirchner et al. 2003; Tecchia et al. 2001]. Shao and Terzopoulos integrated cognitive components and rule-based model to attain fully autonomous pedestrians simulation in a large urban environment [Shao and Terzopoulos 2005a]. Pelechano et al. applied a combination of psychological and geometrical rules with a social and physical force model to simulate the motion of dense crowds [Pelechano et al. 2007].Hengchin Yeh et al. introduced the concept of composite agents to model emergent behaviors among individual agents [Yeh et al. 2008]. Another topic in crowd simulation is data-driven method of simulating a crowd of individuals that exhibit behaviors imitating real human crowds (e.g. [Lee et al. 2007; Lerner et al. 2007; Courty and Corpetti 2007]). Given a set of trajectories extracted from real video, these methods have been exploited to learn from these ex-
amples and then reproduced natural behaviors in simulated crowds. But their techniques are sensitive to the quality of real data especially in crowded situation. Recently, a novel approach to simulate crowds was inspired from fluid dynamics. Hughes introduced a model which describes crowds as a continuum density field and presents a dynamic potential function to guide the density field optimally toward its goal [Hughes 2002; Hughes 2003]. Motivated by Hughes’ concept, Treuille et al. proposed a continuum crowd model [Treuille et al. 2006]. Their method transformed Hughes’s continuous crowd field into a particle representation which formed the basis for their stable, efficient simulator. Compared to agent-based methods, this model allows simulating thousands of pedestrians in real time and could demonstrate several observed phenomena, such as lane formation and vortex forms. This technique unifies local collision avoidance and global planning in one simulation framework, and therefore it solved their conflict naturally and exhibit smoother individuals’ motion than that has been previously reported. Therefore the model used in this paper to simulate crowds is based on this continuum framework.
3 The Proposed Environment Model The cooperative relationship between the virtual humans and the environment is essential in crowd simulation. Pedestrians need perceive their surroundings and react appropriately. Many issues need be solved, for example, which features of the objects or the regions need to be modeled, how to organize large number of objects and facilities, and which kind of representation of the topologic relations can support efficient and accurate query.
3.1 Geometric Level The geometric level is the basis of our entire environment model. The main part of this layer is 3D geometric model of the environment that is employed for display and the semantic information extraction for the next semantic representation layer. Figure 2 demonstrates the geometric model of a building floor.
3.2 Semantic Level The semantic layer is composed of structure map, topologic map and height map which help us to identify or query semantic information of the environment, and all of them are established by our semantic modeling tool that facilitates extracting semantic information from 3D geometric model. 3.2.1 Structure Map
In a complex environment, there are numerous objects, like handrails, walls, windows, pillars and so on, distributed widely in different regions. In order to facilitate organization and implementation, we divided the whole space into several independent but adjacent regions according to common sense. We called these naturally separated regions, like an entire floor, stairs, or a corridor, as Block, and all the objects placed in the same region are included into the block. The division method based on blocks is easy to understand and implement.
And the environment used in our project is very complex and usually has more than one floor such as railway station, subway station and office buildings. In this kind of environment, separate floors are connected by stairs or escalator and each story contains lots of objects. As far as we know, few existing techniques have used to simulate crowds in this kind of environments. Most of them only considered simple environments with few rooms or open scenes. Therefore a reasonable and efficient environment modeling framework is urgently needed for us to deal with this kind of complex situation. In this section, we present the Hierarchy Environment Model, as illustrated in Figure 1, which includes comprehensive and sufficient environment information for simulating crowd in complex environment. We subdivide this model into three layers and will introduce them respectively in following paragraphs.
Figure 2: 3D geometric model of an office floor.
Figure 3: Example of the environment structure. According to above definition, we could structure a complex scene as several blocks, and each block denotes an independent 3D subspace and contains all inside objects. A simple example of environment structure is illustrated in Figure 3. In our model, every block or object has some specific attributes that classified as basic and special attributes. For each block, the basic attributes involve name, bounding box, etc.. In addition, if it is a stair block, its special attributes will include length, step height and step number, and if it is a escalator block, start-up sign, constant horizontal velocity and transport direction will be added to block’s attribute set as the special attributes. For each object, the basic object attributes include name, type, material, bounding box, etc.. If the object is a door or a window, its special attributes will include open sign and different geometric shape when it is opened or closed. These basic and special attributes could help to decide crowd motion and behavior; in fact, we have also used them to simulate fire disaster in an office building.
The structure map of the environment is a new concept in the environment model compared to the model presented in the references [Shao and Terzopoulos 2005a; Shao and Terzopoulos 2005b]. Our structure map describes not only dependent relationship between objects and blocks but also specific attributes for each object and each block. In the simulation process, these data and information are queried frequently through the structure map. 3.2.2 Topologic Map
Topologic map is mainly used to store and retrieve the connective relations between separated regions (blocks). Each node in the topologic map corresponds to one block. And we will add a directed edge from node A pointed to node B if individuals can move from Block A to Block B. The directed edge is used to indicate the connectivity between blocks (see Figure 4).
accurate than the so-called distance between regions. We will label the entrances for each block manually using our semantic tool when all the blocks in an environment are decided. As shown in Figure 6, the big rectangular frames correspond to nodes of top topologic map, and the small solid rectangular boxes represent Connective Points (CPs).The entrances (CPs) are interconnected by two sets of directed edges, inner edges (black solid edge in the figure) and outer edges (blue dotted edge). The inner edges describe the connective relationships between CPs in the same block. On the contrary, the outer edges represent connected CPs belong to different blocks. Generally speaking, every two entrances in the same block are connected, but in the escalator block, there exist only one directed edge because the escalator runs in one direction (like Block C in Figure 6). If we changed running direction of the escalator, we just need adjust the sub-map edge.
Figure 4: An example of the topologic map. In the path planning algorithm, it is often put forward queries like how much does it cost if an individual move from Block A to Block B. The topologic graph presented by Shao and Terzopoulos [Shao and Terzopoulos 2005a; Shao and Terzopoulos 2005b] could be employed to answer the above questions, but it is difficult to get the accurate cost even failure to work. For example, if two adjacent regions connected at more than one places, the ordinary topologic map could hardly to provide accurate path cost for decision-making of the virtual pedestrians because the map does not maintain any distance information. And the ordinary topologic map only keeps the connective relationship between different regions but neglects the accessibility inside each region; therefore an unpredictable result will be returned when some special regions, like single-direction street or single-direction escalator, exist in the environment.
Figure 6: Sub-map in the node of topologic map (the topologic map as shown in Figure 4). The path cost between two entrances is stored at each edge. In practice, because the two entrances connected by any outer edge are close enough, we always overlook the outer edge cost (the outer edges’ costs are set to zero). So we only need compute the cost of inner edges. Given an environment, the topologic map and the edge cost could be computed offline in advance. For every block, we regard each entrance as a target and use potential field method [Treuille et al. 2006] (only considers the length cost) to auto-compute the cost moving from other entrances in the same block. However, the actual cost could also reflect other factors such as the crowdness of the block in addition to the distance. 3.2.3 Height Map
The environment height coordinates are indispensable for crowd animation especially in multilayered environment. It is a common way to store digital surface elevations through height map.
Figure 5: Two Connective Points associated to block entrances. (Yellow rectangle represents a Connective Point).
In our system, the height map is separately generated for each block via our semantic tool (see Figure 7). And we can get 3D position of any points on the surface where the height map is covered.
3.3 Application Level For providing more accurate results, we expand the basic topologic map by embedding a sub-map into every node of topologic graph to store connectivity information between entrances of this block. Each node of the sub-map represents one entrance of the block (we called them CP: Connective Point, which is illustrated in Figure 5). We think the distance between entrances is more valuable and more
For the purposes of providing efficient interaction between pedestrians and the environment, we will rely on the information of semantic level to generate some high-level maps such as object perception map, individual perception map and individual path map in the application level.
Figure 8: Illustration of the individual path map (the topologic map shown in Figure 4 and Figure 6).
individual path is shown in Figure 8. We assume the initial location of the individual is in Block D and the target position is in Block A (the topologic map shown in Figure 4 and Figure 6), the final global path, for example, Start → CP:d2 → CP:b1 → CP:b2 → CP:a2 → Goal, that contains some nodes involved the current position, the goal and several Connective Points (CPs); the path could guide individuals to go to the destination through numerous blocks. In our system, the global path mentioned above is enough for individual navigation. Actually, we could easily extend this map by considering obstacles for providing accurate local navigation in every block if necessary. Figure 7: Height map.
3.3.1
Object Perception Map
In our model, entire environment is divided into several blocks and each block maintains a list of all objects placed in this region. If we want to fetch all objects in a small sub-region, we have to check each object in the object list one by one. To avoid these repeated operations, we map the 3D sub-space of each block onto a horizontal uniform grid. And each cell of the uniform grid records all the objects overlapped with this small area. As a result, we could just search the object list of several cells instead of the whole list. 3.3.2
Individual Perception Map
Like object perception map, a two-dimensional uniform grid in every block is used to store all the individuals located at the block. Each grid cell keeps an individual list that occupied in its small area. Once we update individual’s new position, we then refresh the individual list of the cell where the pedestrian currently placed. The main purpose of the map is to empower the efficient query of nearby pedestrians, and it also facilitates trajectory tracking for the analysis of crowd flow characteristics. 3.3.3
The individual path map presented here is based on our environment structure. Although the concept of the path map have already been provided in [Shao and Terzopoulos 2005a; Shao and Terzopoulos 2005b], the contents are different.
4 Application We have developed a simulation system based on our semantic environment model, and the complete source code of the system includes about 50,000 lines of C++ code. In addition, we also developed a tool for efficiently modeling the environment, which semiautomatically manipulates on 3D geometric model. Depend on this tool we can quickly make a semantic file which will be loaded in our crowd simulation system. Consequently, with a single 3D geometric model, we can easily start a simulation task through this set of software in several hours. Some real public places have been tested in our system. We elaborately rebuild the most elements of these scenes and accomplish many tests for different human flows. Currently, real time computation is not the system request but our system is capable of replaying simulation results with ten thousands pedestrians in real time. Exactly, in our system we can save the simulation records of more than 50,000 people in 30 minutes and replay it. Our tests ran on ordinary PC with Intel Core2 Duo E8300(2.83GHz), 3.5G RAM, NVIDIA GeForce 8800GT(512MB video Memory).
Individual Path Map
4.1 Modified Continuum Crowd Model Many of the crowd simulation systems are goal-directed. Each individual will be assigned a goal when the individual is initialized. We need to find a global path for every pedestrian according to their initial and target locations. Using our block based topologic map, a relative less nodes can lead to quick search. And an example of
The aforementioned environment model could represent the complex environment appropriately; and following paragraphs describe how we implement crowd simulation based on the environment information.
(a) Urban subway station.
(b) A seven-storey office building.
Figure 10: Some semantic information of two scenarios (3D geometric models, colored blocks and sketch map of objects are illustrated from left to right).
Figure 9: Discretizing and connecting grids for potential field computation.
As a global controlled method, the continuum model [Treuille et al. 2006] naturally solved the conflict between local collision avoidance and global planning and could produce smooth individual trajectory. Thereby we designed a modified version to fit our environment model so that it could be used in complex and multilayered environment. The continuum model is based on dynamic potential field that is discretized in space, and we refer the reader to the reference [Treuille et al. 2006] for further details. Because the whole scene is divided into several blocks in our hierarchical environment model, and the objects’ geometric information can be inquired only through the block, so the most direct approach is discretize the sub-space of each block into a regular grid for potential field computation, but if we only do these, all grids are isolated and could not directly drive the crowd from one block into its adjacent block, therefore we need a tailored scheme to discretize every block and then connect the adjacent grids. For computing potential field and conveying people between blocks, an intuitive idea is to align the adjacent grids and then we can build seamless connection between them easily. So we define a global coordinate system and use uniform grid to discretize every block. As shown in figure 9(left), the example environment is comprised of three blocks, each block is discretized under a shared global coordinate system; grid cells belong to different block are aligned along
the both x- and y-axes, and then connective relations are established between border cells of adjacent grids by carefully checking the adjacent Connective Points (CPs) through our topologic map. The visualization results of connected grids are illustrated in figure 9(middle). After connecting adjacent grids, we need to mark the state of each grid cell as walkable or non-walkable. Object list of each block could be accessed from environment structure map, and then every obstacle object will be mapped onto the grid to determine the state of nearby cells. And the accuracy depends on the size of the grid cell. If get the entire connected grids, we can easily construct the dynamic potential field through numerous blocks. An example of the potential field is shown in figure 9(right). Like the original continuum model, the individuals have the same goal will put into the same group and will be guided to their goal through potential field, but in our approach, they can move crossing different blocks. So we naturally achieved that simulating groups of people in multilayered environment if these blocks belong to different building floors. We chose the continuum framework because it could exhibit smoother individuals’ motion than that has been previously reported. But we are also working on agent-based model in order to use more information of our environment model and generate more complex individual behaviors.
4.2 Test Cases We have applied the proposed environmental modeling techniques to modeling a big subway station and an office building. Some modeling results of these environments such as 3D geometric models, colored blocks and sketch map of objects are illustrated in Figure 10 from left to right. As shown in Figure 10(a), the first scenario is a big urban subway station in a city that is comprised of a capacious platform and a station hall connected by four escalator and four stairs. During the great events, the number of passengers will rapidly increase, thus the station faces a security risk. So we hope to simulate some ex-
(a)
(b)
(c)
Figure 11: Crowds in urban subway station
(a)
(b)
(c)
Figure 12: Crowds in an office building
treme instances. As shown in Figure 10(b), the second place is a seven-storey office building. If a fire accident happened, more than two thousand people working in here need evacuate from this building. And we hope to simulate an evacuation process in a fire drill.
4.3
Simulation Results
The scene of the subway station is composed of nearly 1,000 objects and separated into 15 blocks. The cell size of the grid is 0.25 meters. There is a critical stage when two bi-direction trains arrived and all passages exit the railway carriages simultaneously. Screenshots of this simulated scene are demonstrated in Figure 11. We culled half of the scene to show the crowd in the stair of multilayered station in Figure 11(a). On the underground platform, crowded area in front of the stair and escalator is shown in Figure 11(b), and Figure 11(c) showed an overlook of the station hall. The scene of the office building is composed of 1523 objects and separated into 101 blocks. The cell size of the grid is 0.5 meters. An evacuation process with 2,081 individuals was simulated in the office building. Some simulation snapshots are shown in Figure 12. The left picture showed crowd escaped from the office in the initial stage of simulation. And then many people evacuated to the first floor as shown in Figure 12(b), and Figure 12(c) showed the congested stairs. Related animations can be viewed in the companion video. We can see from these results that the hierarchy environment model precisely describes above representative places and efficiently supports the crowd simulation in these multilayered complex environments.
5
Conclusions and Future Work
In this paper, we present a novel hierarchy environment model for representing multilayered complex environment and a modified version of the original continuum model used to exhibit smooth and continuous crowd movement based on our environment model.
On one hand, our environment model is suitable for representing multilayered complex environment. All of the environment information is extracted from 3D geometric model through automatic identification and manual marking. It greatly facilitates the interactions between individuals and their environment. On the other hand, we modify the original model described in [Treuille et al. 2006] so as to fit well with above hierarchy environment model. Using our method, we can achieve naturally crowd navigation in multilayered complex environment. And our system was tested on several challenging scenarios and acquired some visually plausible results. For future work, we are interested in incorporating agent-based method into our environment model to fully explore the environment information and to obtain various individual behaviors. Another possible work would be to solve for the potential function across non-uniform grids so as to focus the computing resources in interested regions. In addition, we found a fresh problem of flow controlling, such as to limit human flow on stairs and escalators, which is very important if we need more accurate simulation results, and we are doing more study to provide a solution.
Acknowledgements This work is supported and funded by National Natural Science Foundation of China Grant No. 60533070, 60603082 and 60703019, National 863 Foundation of China Grant No. 2006AA01Z336 and 2007AA01Z320. Also we would like to thank the anonymous reviewers for their valuable comments and suggestions.
References AYLETT, R., AND C AVAZZA , M.
2001.
Intelligent virtual
environment-a state of the art report. In Proceedings of Eurographics 2001 STARs. BAYAZIT, O. B., L IEN , J.-M., AND A MATO , N. M. 2002. Better group behaviors in complex environments using global roadmaps. In Int. Conf. on the Sim. and Syn. of Living Sys. (Alife), 362–370. B ROGAN , D., AND H ODGINS. 1997. Group behaviors for systems with significant dynamics. Autonomous Robots 4, 1, 137–153. C HENNEY, S. 2004. Flow tiles. In ACM SIGGRAPH/ Eurographics Proceedings of Symposium on Computer Animation, 233–242.
P ELECHANO , N., A LLBECK , J., AND BADLER , N. 2007. Controlling individual agents in high-density crowd simulation. In Proceedings of ACM SIGGRAPH / Eurographics Symposium on Computer Animation, 99–108. P ETTRE , J., D E H EROS C IECHOMSKI , P., M AIM , J., Y ERSIN , B., L AUMOND , J.-P., AND T HALMANN , D. 2006. Real-time navigating crowds: scalable simulation and rendering: Research articles. Comput. Animat. Virtual Worlds 17, 3-4, 445–455. R EYNOLDS , C. W. 1987. Flocks, herds, and schools: A distributed behavioral model. Computer Graphics 21, 4, 25–34.
C OURTY, N., AND C ORPETTI , T. 2007. Crowd motion capture. Comput. Animat. Virtual Worlds 18, 4-5, 361–370.
R EYNOLDS , C. W. 1999. Steering behaviors for autonomous characters. In Proceedings of Game Developers Conference, 763– 782.
F UNGE , J., T U , X., AND T ERZOPOULOS , D. 2005. Cognitive modeling: Knowledge, reasoning and planning for intelligent characters. In Proceedings of SIGGRAPH 99, 29–38.
S HAO , W., AND T ERZOPOULOS , D. 2005. Autonomous pedestrians. In Proceedings of ACM SIGGRAPH / Eurographics Symposium on Computer Animation, 19–28.
G OLDENSTEIN , S., K ARAVELAS , M., M ETAXAS , D., G UIBAS , L., A ARON , E., AND G OSWAMI , A. 2001. Scalable nonlinear dynamical systems for agent steering and crowd simulation. Computers and Graphics 25, 6, 983–998.
S HAO , W., AND T ERZOPOULOS , D. 2005. Environmental modeling for autonomous virtual pedestrians. In Proceedings of SAE Symposium on Digital Human Modeling for Design and Engineering.
H ELBING , D., AND M OLNAR , P. 1995. Social force model for pedestrian dynamics. Physical Review 51, 5, 4282–4286.
S UD , A., A NDERSEN , E., C URTIS , S., L IN , M., AND M ANOCHA , D. 2007. Real-time path planning for virtual agents in dynamic environments. In Proceedings of IEEE Virtual Reality Conference, 91–98.
H ELBING , D., FARKAS , I., AND V ICSEK , T. 2000. Simulating dynamics feature of escape panic. Nature 407, 6803, 487–490. H UGHES , R. L. 2002. A continuum theory for the flow of pedestrians. Transportation Research Part B 36, 6, 507–535. H UGHES , R. L. 2003. The flow of human crowds. Annual Review of Fluid Mechanics 35, 169–182. K AMPHUIS , A., AND OVERMARS , M. H. 2004. Finding paths for coherent groups using clearance. In Proceedings of 2004 ACM SIGGRAPH /Eurographics Symposium on Computer Animation, 19–28. K IRCHNER , A., NAMAZI , A., N ISHINARI , K., AND S CHAD SCHNEIDER , A. 2003. Role of conflicts in the floor field cellular automaton model for pedestrian dynamics. In 2nd International Conference on Pedestrians and Evacuation Dynamics, 51–62. L AMARCHE , F., AND D ONIKIAN , S. 2004. Crowd of virtual humans: a new approach for real time navigation in complex and structured environments. Computer Graphics Forum 23, 3, 509– 518. L EE , K. H., C HOI , M. G., H ONG , Q., AND L EE , J. 2007. Group behavior from video: a data-driven approach to crowd simulation. In Proceedings of the 2007 ACM Siggraph/Eurographics Symposium on Computer Animation, 109–118. L ERNER , A., C HRYSANTHOU , Y., AND L ISCHINSKI , D. 2007. Crowds by example. Computer Graphics Forum 26, 3, 655–664. M USSE , S. R., AND T HALMANN , D. 1997. A model of human crowd behavior: Group inter-relationship and collision detection analysis. In Computer Animation and Simulation ’97, 39–51.
S UD , A., G AYLE , R., A NDERSEN , E., G UY, S., L IN , M., AND M ANOCHA , D. 2007. Real-time navigation of independent agents using adaptive roadmaps. In VRST ’07: Proceedings of the 2007 ACM symposium on Virtual reality software and technology, ACM, New York, NY, USA, 99–106. S UNG , M., G LEICHER , M., AND C HENNEY, S. 2004. Scalable behaviors for crowd simulation. Computer Graphics Forum 23, 3. S UNG , M., KOVAR , L., AND G LEICHER , M. 2005. Fast and accurate goal-directed motion synthesis for crowds. In SCA ’05: Proceedings of the 2005 ACM SIGGRAPH/Eurographics symposium on Computer animation, 291–300. T ECCHIA , F., L OSCOS , C., C ONROY, R., AND C HRYSANTHOU , Y. 2001. Agent behavior simulator (abs): A platform for urban behavior development. In Proceedings of ACM/EG Games Technology Conference, 17–21. T HALMANN , D., AND M USSE , S. R. 2007. Crowd Simulation. London : Springer. T REUILLE , A., C OOPER , S., AND P OPOVIC , Z. 2006. Continuum crowds. ACM Transactions on Graphics (SIGGRAPH ’06) 25, 3, 1160–1168. VAN DEN B ERG , J., L IN , M. 2008.
PATIL , S., S EWALL , J., M ANOCHA , D., AND Interactive navigation of multiple agents in crowded environments. In I3D ’08: Proceedings of the 2008 symposium on Interactive 3D graphics and games, ACM, New York, NY, USA, 139–147.
M USSE , S. R., AND T HALMANN , D. 2001. Hierarchical model for real time simulation of virtual human crowds. IEEE Transactions on Visualization and Computer Graphics 7, 2, 152–164.
Y EH , H., C URTIS , S., PATIL , S., VAN DEN B ERG , J., M ANOCHA , D., AND L IN , M. 2008. Composite agents. In proceedings of ACM SIGGRAPH / Eurographics Symposium on Computer Animation 2008(SCA’08).
P ELECHANO , N., O BRIEN , K., S ILVERMAN , B., AND BADLER , N. 2005. Crowd simulation incorporating agent psychological models, roles and communication. In Proceedings of First International Workshop on Crowd Simulation.
Y ERSIN , B., M AIM , J., M ORINI , F., AND T HALMANN , D. 2008. Real-time crowd motion planning: Scalable avoidance and group behavior. Vis. Comput. 24, 10, 859–870.