A Simple Method for Estimation of M&R Needed Pavement Sections and Costs Dae-Wook Park, Jose Leo Mission, Jung-Hwan Bae, Department of Civil Engineering, Kunsan National University, Kunsan, South Korea e-mail:
[email protected]
Soo-Hyung Lee, Korea Institute of Construction Technology Sang Jeong, Ministry of Land, Transport and Maritime Affairs
ABSTRACT In order to formulate a decision support tool for a timely performance of pavement maintenance and rehabilitation (M&R), this study develops a simple method for the evaluation of M&R needed pavement sections and estimation of costs. Data from a pavement management system (PMS) of 2200 pavement sections inspected from the year 2004 to 2007 in South Korea were used to establish relationships for the Highway Pavement Condition Index (HPCI) and pavement service life. The relationship between the HPCI values and pavement service year was established for the pavement sections grouped by pavement type and number of lanes. A sample data-set from a total of 1,005 sections surveyed and measured in the year 2008 was grouped by pavement type and number of lanes. The current service life was used as an input value to predict HPCI. The results of the analysis have demonstrated that HPCI can be used as a pavement condition index to evaluate pavement condition in Korea. Estimation of M&R needed pavement sections was efficiently conducted with the predicted HPCI values. Analyses of predicted number of M&R needed sections based on predicted HPCI indicate that M&R applications at proper time are needed to maintain overall pavements in good condition. Analyses of estimated M&R costs based on number of M&R needed sections indicate that timely maintenance and rehabilitation are more economical compared to the costs when the M&R are delayed.
1. INTRODUCTION In order to ensure the efficient serviceability of highway pavements and prolong its service year from continued deterioration due to daily wear and tear by traffic and environment sources, regular maintenance operations must be performed at specific time intervals during the service of the road pavements. Poorly maintained pavement surfaces increase travel time, decrease the capacity of the road, create unsafe conditions for the traveling public, and increase maintenance costs both for the pavement and the traveling vehicles. The cost to maintain and rehabilitate pavements increases dramatically when the restorative treatment is delayed beyond a reasonable time frame in the performance of corrective and preventive measures [1]. Because pavements represent such a large investment, they deserve constant attention to keep them in good condition to support the level of service for which they were designed. Best maintenance programs are usually attained with the help of decision support tools in a pavement management system (PMS) [2]. The setting of maintenance and rehabilitation (M&R) priorities, that is, which maintenance treatment to use and where and when to apply it, makes the maximal use of available resources. Over a planned time horizon of scheduled M&R, Wang et al. [2] established an integer linear programming model to select a set of candidate projects from the highway network. In the model,
constraints of available annual budgets and minimum requirements on pavement conditions were satisfied, while pursuing two optimization objectives; maximization of the total M&R effectiveness and minimization of the total M&R disturbance cost. Accurate and reliable assessment of pavement remaining life is required in effective decision making for pavement M&R so that the timing and locations of M&R actions can be scheduled in a way that optimizes the use of allocated budget and resources [3]. Yang [3] formulated an effective remaining-life prediction models to deal with the limited causal data in a typical pavement management system (PMS) at the network level. The major advantage of the proposed model formulation lies in its application at the network level where budget and resources prevent costly pavement structural data from being collected as part of a PMS. Once decision tools are available and future conditions and prediction scenarios for M&R are established in a PMS, a study of the cost-effectiveness of the continuous preservation approach as compared with a reconstruction strategy can also be determined [4]. Smith et al. [4] performed a study to determine the break-even point for the two strategies (i.e., after how many rehabilitation treatments reconstruction becomes as cost-effective as continuous preservation), and showed the break-even point occurs when two to three rehabilitation treatments are performed prior to reconstruction. To estimate number of M&R needed pavement sections and costs, pavement management data in Korea were analyzed to find the best pavement condition index which can represent pavement condition. The relationship between several pavement indexes and service life was analyzed. Based on the results, a software was developed to identity M&R needed pavement sections and estimate costs. 2. PAVEMENT MANAGEMENT DATA To estimate the needed number of maintenance and rehabilitation sections and costs of Korea pavement networks, the average of 2200 pavement sections of pavement management data on South Korea pavement inspection system in the year 2004, 2006, and 2007 were used. The database contain pavement distress data such as rut depth, fatigue cracking, pavement roughness, traffic volume, maintenance and rehabilitation history, construction, and other pavement structure information. A deterioration model is constructed based on the pavement management data contained in the Korea pavement inspection system. Based on rehabilitation history and construction year, each pavement section was grouped as rehabilitated and new pavement sections, and then the grouped sections were classified by number of lanes and traffic volume according to an equivalent single axle load (ESAL). Pavement service year was calculated by subtracting the construction year and rehabilitation year from the pavement inspection year.
Pavement Condition Index Used in this study At the first time, International Roughness Index (IRI) was considered as a candidate to represent the pavement condition; however, the relationship between IRI and pavement service year did not show any consistency; therefore, other pavement condition indexes were evaluated to use as a pavement deterioration model based on the relationship between pavement service year and a pavement condition index. The descriptions of two candidate pavement condition indexes are based on the Highway Pavement Condition Index (HPCI) developed by Korea Highway Corporation [5] and are used to evaluate highway pavement condition. The HPCI equation used is given as: HPCI = 4.564 – 0.348 IRI – 0.36 RUT – 0.01(TC+AREA)0.5
(1)
where,
IRI = International Roughness Index (m/km), RUT = Rut Depth (cm), TC = Thermal Cracking (m/500m), AREA = Area of alligator cracking and patching (m2/500m).
HPCI is similar to present serviceability index (PSI) developed by the AASHO Road Test, but IRI is used for HPCI while the standard deviation of roughness at a longitudinal direction is used for PSI. Maintenance Condition Index (MCI) is developed by Japanese Ministry of Construction and is based on PSI. PSI is developed in terms of ride ability of drivers while MCI is developed in terms of pavement maintenance agency whether pavement condition needs maintenance/rehabilitation or not. When the MCI value is 10, pavement condition is perfect as a new pavement while 0 represents failed pavement condition [5]. The MCI equation is following: MCI = 10 – 1.48C
MCI0 = 10 – 1.51C
0.3
MCI1 = 10 – 2.23C
0.3
MCI2 = 10 –0.54D where,
0.3
– 0.29D – 0.3D
0.7
– 0.47 σ
0.2
0.7
0.7
(2) (3) (4) (5)
MCI = Maintenance Condition Index, C = Fatigue Cracking (%), D = Rut Depth (mm),
σ
= Standard Deviation of Roughness at Longitudinal Direction (mm).
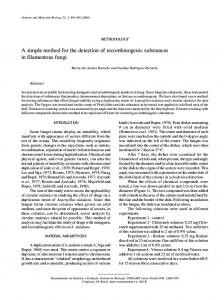
MCI is the minimum MCI value among the above MCI equations. The same sections of three years were grouped using pavement inspection data and, the HPCI and MCI values were calculated based on the pavement distress and roughness data. The HPCI and MCI values should be increased as pavement service year increases. The grouped pavement section is much easier to find the consistency of the HPCI and MCI values than when mixed pavement sections were analyzed. Some pavement sections showed that the HPCI and MCI values were increased as pavement service year increases; therefore, analysis was conducted after eliminating the sections showing the opposite tendency. After analyzing the HPCI and MCI values, it is shown that the HPCI values showed more consistency than the MCI values; therefore, it is decided to use HPCI as a pavement condition index. 3. ANALYSIS OF HIGHWAY PAVEMENT CONDITION INDEX (HPCI) Pavement distress and roughness data from each of the highway pavement section were analyzed to determine the HPCI value using Eq. (1), and the relationship between the HPCI values and pavement service year was established for the pavement sections grouped by pavement type and number of lanes. The relationships were shown in Figure 1 to Figure. 4.
5.0
4.0
HPCI
3.0
2.0
1.0
0.0 0
5
10
15
20
25
Pavement Service Life (Year)
Figure 1. HPCI Relationship for a 2-lane New Pavement 5.0
4.0
HPCI
3.0
2.0
1.0
0.0 0
2
4
6
8
10
12
14
Pavement Service Life (Year)
Figure 2. HPCI Relationship for a 2-lane Rehabilitated Pavement
16
5.0
4.0
HPCI
3.0
2.0
1.0
0.0 0
2
4
6
8
10
12
14
Pavement Service Life (Year)
Figure 3. HPCI Relationship for a 4-lane New Pavement
5.0
4.0
HPCI
3.0
2.0
1.0
0.0
0
2
4 6 Pavement Service Life (Year)
8
Figure 4. HPCI Relationship for a 4-lane Rehabilitated Pavement
10
Based from a linear regression analysis of the available highway pavement section database, the following equations are established: 2 lane new pavement:
HPCI = 3.8247 – 0.0479 X
(6)
2 lane Rehabilitated pavement: HPCI = 3.7703 – 0.0586 X
(7)
4 lane new pavement:
HPCI = 3.9219 – 0.0877 X
(8)
4 lane Rehabilitated pavement: HPCI = 3.7756 – 0.0851 X
(9)
The above regression equations are defined in general as a straight line of the form, y = b - mx
(10)
where y = HCPI, x = service life, m = the slope of the line, and b = y-intercept or the HPCI value at the start of the service life x. The negative slope denotes the deteriorating and degrading condition of the pavement with time as the service year is increased from its initial condition. It can also be seen that the new pavements have higher HPCI values at the start of their service compared to the rehabilitated pavements that have already undergone previous maintenance works in the past.
4. DEVELOPMENT OF SOFTWARE FOR M&R NEEDED SECTIONS AND COSTS The various relationship equations that were established between the HPCI value and pavement service year can be used to predict and evaluate the present and future conditions of the pavements, and determine an appropriate type of maintenance action to be performed based on an established HPCI criteria. Figure 5 illustrates the method applied using the regression equations in evaluating the current and future HPCI of a given pavement section. At the current year xc, a given pavement section has a current service year xo, the current condition of the pavement can then be evaluated using the appropriate linear regression equation given in Eqs. (6) to (9). Let yc = the predicted HPCI at the current year, and a = HPCI criteria for maintenance, the specific type of maintenance is then determined using Table 1. When no maintenance is recommended, the predicted HPCI at the current year becomes the initial HPCI or the new y-intercept b in Eq. (10) and the new x-origin is then moved from zero to xc. When the predicted HPCI is less than a or within the criteria based on Table 1, then an appropriate adjustment is made to reflect the upgraded HPCI in any given year of the newly maintained or rehabilitated pavement as discussed in the following sections. Although it also possible to perform a yearly evaluation of each of the pavement conditions using the predicted HPCI at every 1 year, the first scheduled maintenance can still be generally proposed at a few number years from the current year, say at x = xi. On the first proposed year of scheduled maintenance at xc+1, the regression equation is again evaluated for a service year x = x1 to predict the new HPCI value following the conditions of the previous years. Let yc+1 = the predicted HPCI at year xc+1, and when yc+1 < a as illustrated in Fig. 1, then an appropriate type of maintenance is performed either by rehabilitation (R) or surface treatment (S) based on Table 1. After the maintenance operation will be finished, the new HPCI for the pavement section will be upgraded to a certain percentage (f) of its initial value depending on the type of maintenance performed. Let this upgraded HPCI be equal to the new yintercept y’c+1 = b1 = f.b0, then the new x-origin is now moved at xc+1 and a new HPCI evaluation is then
made for the next proposed maintenance schedule at the renewed service year x = x2. At any future time in the service of the pavements, the database is then updated and each of the pavement’s condition is upgraded to a higher and improved HPCI value whenever a specific type of maintenance and rehabilitation is performed.
Figure 5. Scheduled maintenance and rehabilitation methodology applied using the HPCI linear regression equation for evaluation
The method shown in Figure 5 is applied for the evaluation of a single pavement section in the database only. For the evaluation of a total number Np of pavement sections in the database, a batch analysis should be performed by reading the relevant data for each pavement section inside a loop using a computer program. The flowchart for such an algorithm is given in Figure 6. For any given year, the total number of pavement sections (nX) that do not require maintenance (X) is determined. Similarly, the total number of pavement sections (nR) that requires rehabilitation (R) as well as the total number of pavement sections (nS) that requires surface treatment (S) will be known. Multiplying these numbers by the expected unit cost for maintenance or rehabilitation at any given year, the total required maintenance and rehabilitation cost is therefore estimated.
Figure 6. Flowchart for the batch analysis and HPCI evaluation for all pavement sections in a database
5. ANALYSIS RESULTS M&R needed sections based on the HPCI criteria as shown in Table 1 were analyzed using the developed software. Also, M&R costs were calculated based on number of estimated M&R needed sections. The analysis scenarios were once for different periods, that is: once per year, once per two year, once per three year, once per four year, and once per five year. A total of 1005 sections surveyed and measured at 2008 year were grouped by pavement type and number of lanes. The pavement service year were used as an input value to predict HPCI. Based on the predicted HPCI values, M&R needed pavement sections were identified as no maintenance (X) needed , surface treatment (S) needed, and rehabilitation (R) needed.
Table 1. HPCI Criteria for Maintenance and Rehabilitation Maintenance Type
HPCI Range
No Maintenance (X) Surface Treatment (S) Rehabilitation (R)
No Maintenance
>
3.0
2.5
3.0