A SIMULATION CLIENT ACHIEVES HIGH SELF-SUFFICIENCY Edward J. Williams Production Modeling Corporation Three Parklane Boulevard, Suite 1006 West Dearborn, Michigan 48126, United States E-mail:
[email protected]
KEYWORDS Documentation, Model management, Simulation management.
transfer, interfaces,
Software System
ABSTRACT Simulation has become so well regarded that many businesses, in a variety of industries, now routinely realize its benefits; many others, those new to simulation, are eager to do so. Likewise, the use of simulation, long concentrated in the heavy manufacturing sector of the economy, has diversified into all sectors. Companies new to simulation often seek entry to this technology via retention of a consulting partner company already highly experienced and competent in its application. Too often, however, the company striving to incorporate simulation into its armoury of analytical and problem-solving tools becomes mired in dependency upon consultants indefinitely, even for what should be relatively routine modifications and extensions of the model originally constructed. In this paper is documented a successful, even rapid, emergence from such dependency – a client achieving self-sufficiency in simulation. INTRODUCTION In the current case, industrial engineers at a rapidly expanding and strengthening pharmaceutical company had, by keeping abreast of both technical and business literature, noticed admiringly the increases in both productivity and efficiency often achieved via insights obtainable from discrete-process simulation analyses (Rohrer 1998). They and their managers became determined to introduce simulation technology as a routine policy into their own industrial and process engineering practices (Williams 1996). This determination specifically renounced as inadequate the mere receipt of a consultant’s report and recommendations, or even the receipt of those plus a simulation model relegated to ornamental functions, as opposed to ongoing use, modification, and extension – a model whose recommendations would be implemented confidently (Scheeres 2003). This paper will discuss first the forging of the relationship between the client pharmaceutical company and the consulting company. Next, it will describe the Proceedings 15th European Simulation Symposium Alexander Verbraeck, Vlatka Hlupic (Eds.) (c) SCS European Council / SCS Europe BVBA, 2003 ISBN 3-936150-28-1 (book) / 3-936150-29-X (CD)
specific steps taken to specify the scope of the initial study, choose an appropriate software tool, develop a prototype model, train the client engineers, and transfer the technology while removing all but the last vestiges of client dependency on consultancy. FORGING THE CLIENT-CONSULTANT RELATIONSHIP The industrial engineers at the eventual client company, seeking a consulting partner in simulation analysis, began by assessing the suitability of various candidate consultants, with particular attention to availability of university liaisons, willingness to travel to the client’s site, strong references, and willingness to invest (not spend) time in training, documentation, technology transfer, and data gathering as well as in modeling and analysis. Hence the client’s engineers made heavy use of the advice on selection of a simulation-service vendor in (Williams 1993). After the pharmaceutical company had chosen the consultancy company, managers and senior engineers of the two companies jointly constructed a contractual relationship emphasizing overall approaches, such as technology transfer directed to achievement of client self-sufficiency. Since this relationship cohered in a context of mutual trust, the discussion of myriad details was comfortably deferred to subsequent discussions, with the joint understanding that specifications of detail would be decided subsequently, as vigorously recommended by (McCormack 1984). The overall approach was confirmed to comprise a reconnoitering visit to the client site by a senior project engineer, assistance with choice and acquisition of software tools, construction of a prototype model, on-site training conducted by the same technical specialist who led the team effort of building this prototype, transfer of the model and knowledge of all techniques used in its construction to the client, and availability of brief consultations thereafter as needed. SPECIFYING SCOPE OF THE INITIAL STUDY The senior project engineer spent four business days at the client’s site to learn as much as possible about the client’s products, procedures, and the operational and economic issues and improvement opportunities of greatest concern to client management. They reached agreement to focus project attention upon a blister
packaging line responsible for the packaging of allergy pills. This line already had a reputation as a bottleneck, and management, via marketing research, was confident production demands upon this line would increase over the next few quarters. This line receives as input individual pills of various varieties (for example, pills in some batches are time-release whereas pills in other batches are not). Furthermore, the line must package these pills in blister cards containing five, ten, or twenty pills as demanded by various customers. In contrast to the plastic pill bottles familiar to individual customers having a doctor’s prescription filled at a pharmacy, blister cards hold pills encased in small plastic bubbles set against a lightweight cardboard backing. These cards are routinely used by hospitals, nursing homes, rehabilitation centers, and hospices. Such institutions must dispense large numbers of pills, keep them medically sanitary until ingestion by the patient under the watchful eye of a registered nurse, be able to quickly identify and investigate early evidence of medical problems plausibly connected with prescription regimens (such as adverse reactions between drugs, possibly prescribed by different doctors in different medical specialties), and be able to count pill inventories quickly and accurately on demand of a governmental audit (Cooper 1991).
learning and use, reasonable execution efficiency, ability to interface input and output operations with Microsoft® Excel spreadsheets, ample modeling power, ability to develop a model and its animation concurrently, and relatively low price (the last because the client’s plans for eventual self-sufficiency included purchase of multiple copies of the chosen software) (Bowden 1998). Examples of criteria relegated to low importance were compatibility of the software with Unix operating systems (of which the client has none), availability of three-dimensional animation (the client’s production systems contained no elevators, requirements for equipment clearance under bridge cranes, vertical storage systems, or other features inherently requiring three-dimensional animation for easy visualization), and high power to represent material-handling systems and equipment such as forklift trucks and automatic guided vehicles (not used at the client site). After comparing and contrasting the four candidates, engineers at the client and the consulting company jointly agreed on use of the SIMUL8® software package (Hauge and Paige 2001). The client engineers and their management then completed the purchase and installation of this software prior to the completion and delivery of a prototype model by the consultants.
Whenever production of this blister packaging line is changed from one stock-keeping unit [SKU] to another (and even packaging the very same pills into blister cards holding ten versus five pills each constitutes a change in SKU), significant changeover time overhead (typically four, six, or eight hours depending on the degree of dissimilarity between the outgoing and incoming SKU) must occur. These changeover times accommodate the absolute necessity of washing and checking all production equipment to ensure the most scrupulous cleanliness, and also to update and audit all production records as required by the Food and Drug Administration’s [FDA] stringent policies backed by the United States government. Therefore, the client engineers were particularly interested in the ability of a simulation model to help them devise production schedules to minimize this overhead, yet not cause customers’ orders to be delayed beyond their contractual delivery dates. Viewed thus, the challenges faced by the client engineers were jobsequencing problems analogous to those analyzed and attacked in (Mosca, Queirolo, and Tonelli 2002). A recent study (Johansson and Kaiser 2002) likewise illustrates the power of simulation when applied to such production challenges.
DEVELOPMENT OF A PROTOTYPE MODEL
CHOICE OF SOFTWARE Together, the client engineers and the consultants examined four candidate computer software tools capable of building discrete-event simulation models with animation. Desiderata for the chosen tool, as enumerated in (Klingstam 2001) included ease of
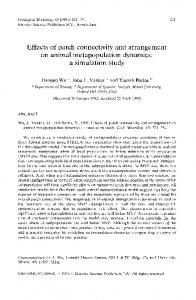
The outline of process flow provided by the returning senior project engineer to the technical specialist readily sufficed for the construction of a prototype model. In the process, a thermoformer encases individual pills in plastic bubbles, originally softened by high heat and then mounted on a card. A cartoner places a specific number (which depends on SKU) of such cards into a carton. The carton is then sent to a check weigher which vets the weight of this carton. Cartons passing this check travel to a bander, which bands six cartons together; the resulting bundle then travels to a case packer which packs six cartons into a case. The case then travels to a labeler which affixes a product-identification and a shipping label to the case. Successive machines, represented as “work centers” in SIMUL8®, are joined by accumulating conveyors. Since the machines in actual production practice have dedicated operators, the client and consulting engineers decided separate modeling of labor for machine operation was unnecessary. Irrespective of SKU currently being produced, product moving on a particular conveyor is always of the same “footprint” size. A large-capacity SIMUL8® “storage” holds individual pills at the upstream end of this process; an acknowledged modeling assumption specified that this storage would never run out of pills. The operations run on a three-shift basis; each shift is eight hours long and includes a lunch break, shorter breaks, and provision for ten minutes’ cleanup time at the beginning and at the end of the shift. A diagrammatic representation of this process appears in Figure 1 on the next page.
TRAINING OF CLIENT ENGINEERS Buffer Thermoformer
Check weigher
Labeler
Bander
Cartoner
Case Packer
Squares represent work centers; arrows represent conveyors.
Figure 1: Basic production line configuration. To make the model more convenient for the client’s engineers to use, and to ease the impending technology transfer, as much model input information as possible was placed in a Microsoft® Excel workbook, with closely related data items grouped into distinct worksheets. For example, machine cycling rates were in one worksheet, changeover times in another, and shift patterns (e.g., lengths of break times and their placement within an eight-hour shift) were in yet another. Worksheet cells intended to be changed by the user were formatted with a green background to indicate “change permitted.” Throughout, this model was documented, especially internally, with special care, since the project plan explicitly specified that it would very soon be transferred to two audiences: process engineers about to be trained in simulation concepts, the SIMUL8® software tool, and the logical processes used internally to build the model, and derivatively to managers who would need to understand its operation and significance, but not its internal details. SIMUL8® supports internal commenting of a model in three ways: clicking a “Memo” button available in each of its basic constructs such as Work Center, Storage Bin, Work Entry Point, etc.; insertion of comments within Visual Logic code via a “Comment” code line (such comments then appear in green, as is the Visual Basic tradition); and inserting comments presumably pertinent to the model as a whole via the command File/Simulation Properties. All of these methods were used. Indeed, (Oscarsson and Moris 2002) have examined in detail the importance of documentation in such instances, and techniques for making the documentation effective to various audiences.
After the prototype model was developed and verified (but not validated) by consulting engineers, it was electronically mailed to the client engineers. During the first on-site visit by the senior project engineer, he had taken care to explain the distinctions between verification and validation to the client engineers (Sargent 1996). One week later, allowing time for the client engineers to open the model on their newly acquired software and formulate basic questions about it, the technical specialist who led the effort of building and verifying it traveled to the client site for four days’ training and consultation. Client management invested aggressively in this training, allocating five production engineers to it full-time and one additional production engineer to the first half of it. The first two days of the training were essentially standardized, using a canonical curriculum which reviewed the conceptual foundations and basic methods of sound simulation practice in industry, and also examined all the essential functionality and fundamental constructs of SIMUL8®. This overview defined simulation, described the business and management motivations for using simulation (with illustrative applications), explained the functioning of the model clock (for example, it compresses time, and logically must never attempt to run in reverse), enumerated typically required inputs and available outputs, and discussed in detail a list of no fewer than fifteen frequent mistakes and their avoidance. Next, the overview instruction explained statistical concepts involved in discrete-process simulation, including the contrast between continuous and discrete distributions, the contrast between empirical and closed-form (theoretical) distributions, the importance of replication length, number of replications, and the choice of warmup time (including when warmup time should equal zero because the simulation is terminating, not steady-state). Next, the canonical training discussed SIMUL8® usage thoroughly, including use of its basic constructs, incoming and outgoing routing options (of which there are many, particularly with reference to Work Centers), specification of travel times within the model, representation of resources and their travel times, use of Labels (called “Attributes” in almost all other simulation software) and of Information Stores (called “Variables” in almost other simulation software), coding and use of Visual Logic triggered by various events in the simulated system (e.g., beginning of cycle, beginning of downtime, end of cycle, end of downtime, end of run, etc.), establishment of run parameters (run length, warmup length), customizing of the results report, and interpretation of results.
Promptly at 8am on the third day, the training leader opened the SIMUL8® model and the Microsoft® Excel workbooks upon which it depended for input and output. Each element in the model, whether work entry point, work center, conveyor, resource, storage, or work exit point, was examined in turn, and the purpose and construction of each line of underlying Visual Logic (SIMUL8®’s internal programming-logic language) was examined. The trainer “reconstructed the model out loud,” thereby conveying to the client’s process engineers the thought processes used to construct it. Examples of questions asked and answered, and issues discussed, during this phase of the training devoted to “model transfer to client,” were: 1. Why is the Routing In mode of this Work Center specified as “Passive”? 2. Why is this segment of Visual Logic code placed in “On Work Complete” instead of “On Exit” relative to the Work Center involved? 3. How can we most conveniently rearrange the results report depending on whether we would like Work Center utilizations sorted alphabetically, in upstream-to-downstream order, or by decreasing utilization? 4. In model logic, how do we distinguish between an urgent item which is allowed to go to the front of a queue and an even more urgent item which is allowed to interrupt work currently in progress at a Work Center? 5. If at some future time we would like to assign a technician to be responsible to repair several different machines, how would we use the Resource construct of SIMUL8® to represent the situation accurately? Next, the process engineers guided the training leader in the validation of the model, describing the errors which, given the project approach thus far (e.g., no member of the model development team had visited the client site prior to the current week), were inevitable and had been acknowledged as such. Examples of these errors were: 1. The batching portion of the thermoformer cycle was completely missing. 2. The unfortunate ability of some machines to produce occasional scrap had been overlooked. 3. Changeover times for switching from some SKUs to other SKUs were incorrectly specified. 4. Conveyors were the wrong lengths. 5. Intervals between downtimes were cyclebased on the production floor (for example, after a certain number of cycles, the bander would exhaust its supply of packaging tape), but time-based in the model. The trainer and the process engineers then discussed the most effective approach to repair of each error. Most of this discussion took place on the production floor, as the process engineers provided a planned and extremely valuable guided tour to the trainer. For
example, error #3 was corrected within the pertinent input Excel® worksheet (an example of the attraction of using them for input flexibility). Errors #4 and #5 were readily corrected by revision of the conveyors and the work centers respectively. For example, correction of Error #5 required changing work center downtime specification from the SIMUL8® “Auto” choice to the SIMUL8® “Detailed” choice. In the former, only the uptime percent and the average repair time are specified; in the latter, the modeler has complete control over the mean-time-to-fail and mean-time-to-repair distributions, including specification of MTTF as clocktime based, busy-time based, or cycle-based. Error #5 also required revision and reinterpretation of the Excel® input: a number previously interpreted as “mean time to fail” was changed in value and reinterpreted as “mean cycles to fail.” The first two errors in the list above required more fundamental changes to the model, such as adding constructs (e.g., work exit points representing scrap leaving the system) and/or revising Visual Logic within the system. On the fourth and last day of the on-site training and consultation, the process engineers and the trainer worked together to implement corrections of various errors, including those described above. This experience gave the engineers useful guided experience in using the software, plus experience in the techniques of model step-by-step tracing, examination of the animation, and desk-checking of output to detect the presence of errors, locate their source, and implement corrections without the introduction of new errors. Likewise, the engineers also learned, via directly “hands-on” practice, to define and run experiments with appropriate warm-up times and number of replications. When it was “time to leave for the airport” late in the afternoon, all but four of the identified errors had been corrected, and a method of correcting those remaining had been agreed upon. TRANSFERRING THE TECHNOLOGY After the trainer’s return to the consultant’s home office, both he and the senior project engineer checked frequently with the client engineers via telephone and electronic mail. Three months after the on-site training and collaborative model validation, the client engineers had corrected the remaining errors, completed model validation, and were exercising the model vigorously for ongoing experimentation. Most, but not all, of these experiments were run by making changes to the input data within the Microsoft® Excel workbook; a minority were run via changes to the model itself. As an example of this contrast, during the trainer’s site visit, changeover times were indexed into four broad product categories, whose specific changeover times were read into the model from the Microsoft Excel® workbook. Revised changeover times were then accommodated by routine worksheet changes. However, at one point, the client engineers realized they would need to add a fifth
broad product category. Via email advice, they were able to modify the loop constructs within the pertinent Visual Logic code to accommodate this revision. Since the client’s engineers needed less than ½ person-day, in aggregate, from the simulation consultants during this three-month period, both parties happily deemed the technology transfer a success and the original project plan worthy of reuse in potential future projects.
ACKNOWLEDGMENTS Professor Onur M. Ülgen, University of Michigan – Dearborn, and President, Production Modeling Corporation, Dearborn, Michigan, Chris DeWitt, Project Manager, Production Modeling Corporation, and two anonymous referees have provided valuable inspiration for, commentary on, and constructive criticisms to improve this paper.
CLIENT BENEFITS REALIZED REFERENCES The client organization has realized significant benefits accruing from ongoing use of this simulation model. Among the most significant of these benefits are the following: 1. Accurate predictions of machine utilization under a variety of different scheduling scenarios; 2. Accurate predictions of conveyor utilization and occupancy under a variety of different scheduling scenarios; 3. Greatly improved (both in accuracy and “distance to time horizon”) capacity planning, analogous to that reported for a microbrewery in (Bergin, Davidoff, and Weston 2002); 4. Increased awareness of the importance of reducing setup times by assigning and scheduling tasks concurrently whenever possible, coupled with new availability of quantitative assessment of these benefits in achieving leaner manufacturing, as espoused in (Parks 2003); 5. Realization and quantitative proof that scheduling to make long changeover times fall near the beginning or end of a shift, versus near the middle of a shift, yields both more easily implementable personnel assignment schedules and increased throughput; 6. Development of preventive maintenance schedules, using simulation, to best interface with production schedules and their inherent changeovers, as achieved in (Alfares 2002) for analogous production lines packaging powdered detergent, liquid soaps, and shampoos; 7. Valuable long-term understanding of the steps (such as rigorous data collection and development of a simulation usage strategy) required to integrate discrete-event simulation into the engineering process, as extensively documented in (Holst 2001). SUMMARY AND CONCLUSIONS This paper has described a simulation study undertaken with the specific goal of client selfsufficiency in the technology defined as having equal rank with other typical goals such as quantifiable improvements in process efficiency. The project plans defined during the forging of the client-consultant relationship proved adequate to reach this goal, and hence will be reused. The client has realized significant and quantifiable benefits from this study.
Alfares, Hesham K. 2002. “Developing Optimum Preventive maintenance Schedules Using Simulation: A Case Study.” International Journal of Industrial Engineering – Theory, Applications, and Practice 9(3):311-318. Bergin, D., Peter H. Davidoff, and F. C. “Ted” Weston Jr. 2002. “The Right Place for a Bottleneck.” IIE Solutions 34(12):34-39. Bowden, Royce. 1998. “The Spectrum of Simulation Software.” Industrial Engineering Solutions 30(5):4446. Cooper, James W. 1991. Drug-Related Problems in Geriatric Nursing Home Patients. Binghamton, New York: The Haworth Press, Incorporated. Hauge, Jaret W., and Kerrie N. Paige. 2001. Learning SIMUL8: The Complete Guide. Bellingham, Washington: PlainVu Publishers. Holst, Lars. 2001. Integrating Discrete-Event Simulation into the Manufacturing System Development Process: A Methodological Framework. Licentiate in Engineering Thesis, Division of Robotics, Department of Mechanical Engineering, Lund University, Lund, Sverige. McCormack, Mark H. 1984. What They Don’t Teach You at Harvard Business School. Toronto, Ontario: Bantam Books, Incorporated. Johansson, Björn, and Jürgen Kaiser. 2002. “Turn Lost Production into Profit – Discrete Event Simulation Applied on Resetting Performance in Manufacturing Systems. In Proceedings of the 2002 Winter Simulation Conference, Volume 2, eds. Enver Yücesan, Chun-Hung Chen, Jane L. Snowdon, and John M. Charnes, 1065-1072. Klingstam, Pär. 2001. Integrating Discrete Event Simulation into the Engineering Process: Strategic Solutions for Increased Efficiency in Industrial System Development. Thesis for Degree of Doctor of Philosophy, Department of Production Engineering, Chalmers University of Technology, Göteborg, Sverige. Mosca, Roberto, Filippo Queirolo, and Flavio Tonelli. 2003. “Job Sequencing Problem in a Semi-Automataic Production Process.” In Proceedings of the 14th European Simulation Symposium, eds. Alexander Verbraeck and Wilfred Krug, 343-347. Oscarsson, Jan, and Matías Urenda Moris. 2002. “Documentation of Discrete Event Simulation Models for Manufacturing System Life Cycle Simulation.” In Proceedings of the 2002 Winter Simulation Conference, Volume 2, eds. Enver Yücesan, ChunHung Chen, Jane L. Snowdon, and John M. Charnes, 1073-1078. Parks, Charles M. 2003. “The Bare Necessities of Lean.” Industrial Engineer 35(8):39-42.
Rohrer, Matthew W. 1998. “Simulation of Manufacturing and Material Handling Systems.” In Handbook of Simulation, ed. Jerry Banks, 519-545. New York, New York: John Wiley & Sons, Incorporated, Sargent, Robert G. 1996. “Verifying and Validating Simulation Models.” In Proceedings of the 1996 Winter Simulation Conference, eds. John M. Charnes, Douglas M. Morrice, Daniel T. Brunner, and James J. Swain, 55-64. Scheeres, Junell. 2003. “Making Simulation a Reality.” Industrial Engineer 35(2):46-48. Williams, Edward J. 1993. “Selection of a SimulationService Vendor.” Industrial Engineering 25(11):1819. Williams, Edward J. 1996. “Making Simulation a Corporate Norm.” In Proceedings of the 1996 Summer Computer Simulation Conference, eds. V. Wayne Ingalls, Joseph Cynamon, and Annie V. Saylor, 627632.
AUTHOR BIOGRAPHY EDWARD J. WILLIAMS holds bachelor’s and master’s degrees in mathematics (Michigan State University, 1967; University of Wisconsin, 1968). From 1969 to 1971, he did statistical programming and analysis of biomedical data at Walter Reed Army Hospital, Washington, D.C. He joined Ford Motor Company in 1972, where he worked until retirement in December 2001 as a computer software analyst supporting statistical and simulation software. After retirement from Ford, he joined Production Modeling Corporation, Dearborn, Michigan, as a senior simulation analyst. Also, since 1980, he has taught evening classes at the University of Michigan, including both undergraduate and graduate simulation classes using GPSS/H, SLAM II, SIMAN, ProModel, SIMUL8, or Arena®. He is a member of the Institute of Industrial Engineers [IIE], the Society for Computer Simulation International [SCS], and the Michigan Simulation Users' Group [MSUG]. He serves on the editorial board of the International Journal of Industrial Engineering – Applications and Practice. During the last several years, he has given invited plenary addresses on simulation and statistics at conferences in Monterrey, México; İstanbul, Turkey; Genova, Italy; and Rīga, Latvia.


![oakland achieves - WordPress.com [PDF]](https://m.moam.info/img/260x300/oakland-achieves-wordpresscom-pdf_6479931a098a9e90778b4605.jpg)


