Keywords: Image analysis and processing software, texture analysis, data ... There are not many software tools for quantitative image texture available. MaZda is ...
Manuscript published: Elsevier, Nuclear Instruments & Methods In Physics Research A, Volume 702, February 2013, Pages 137-140, DOI: http://dx.doi.org/10.1016/j.nima.2012.09.006
A Software Tool for Automatic Classification and Segmentation of 2D/3D Medical Images Michal Strzelecki, Piotr Szczypinski, Andrzej Materka, Artur Klepaczko Institute of Electronics, Technical University of Lodz, Wolczanska 211/215, 90-924 Lodz, Poland
Abstract: Modern medical diagnosis utilizes techniques of visualization of human internal organs (CT, MRI) or of its metabolism (PET). However, evaluation of acquired images made by human expert is usually subjective and qualitative only. Quantitative analysis of MR data, including tissue classification and segmentation, is necessary to perform e.g. attenuation compensation, motion detection, and correction of partial volume effect in PET images, acquired with PET/MR scanners. This article presents briefly a MaZda software package, which supports 2D and 3D medical image analysis aiming at quantification of image texture. MaZda implements procedures for evaluation, selection and extraction of highly discriminative texture attributes combined with various classification, visualization and segmentation tools. Examples of MaZda application in medical studies are also provided. Keywords: Image analysis and processing software, texture analysis, data classification, magnetic resonance imaging 1. Introduction Texture, as perceived by humans, is a visualization of complex patterns composed of spatially organized, repeated subpatterns, which have a characteristic, somehow uniform appearance [2]. The local subpatterns within an image demonstrate specific brightness, color size, roughness, directivity, randomness, smoothness, granulation, etc. A texture may carry substantial information about the structure of physical objects – consequently, textural image analysis is an important issue in image processing and understanding. Especially, texture plays an important role in biomedical images, where it characterizes internal structure of tissues and organs. Texture is present in vast majority of such images acquired by different modalities, including PET, MRI, CT, echocardiography, etc. Humans usually assess the texture only qualitatively, while often its quantitative analysis is required to obtain objective and reliable diagnostic information. The MaZda software package [1] was developed to perform such analysis, including texture feature computation, feature selection, data classification and
visualization, image segmentation. It was already utilized in many areas including MRI measurement protocol optimization [2] and various medical studies, to mention just the latest [3,4,5,6]. There are not many software tools for quantitative image texture available. MaZda is the only one that provides a complete analysis path for textured images, including image loader, graphical user interface for ROI definition, ROI normalization, feature estimation, statistical analysis of feature vectors, ROI classification and image segmentation. Therefore, properties and performance of other texture analysis programs, useful in specific situations, like an mtex toolbox of Matlab® or wavelet-oriented LS2W application (http://www.maths.bris.ac.uk/~wavethresh/LS2W/) cannot be directly compared to those of MaZda.
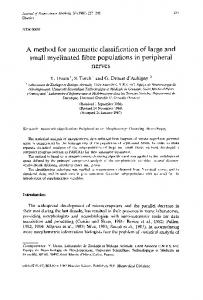
Fig. 1. Flowchart of analysis pathways in MaZda/b11 package
2. Image texture analysis There are several pathways of image analysis that are handled by MaZda package as shown in Fig. 1. Starting with the input data, there is a choice between the analysis of 2D/3D images. MaZda implements procedures for loading image files of most popular standards, including DICOM. The image analysis usually starts with definition of regions of interest (ROIs). The ROIs in MaZda can be of arbitrary shape and can overlap if required. There are almost 300 texture features evaluated based on image histogram, gradient, co-occurrence matrix, runlength matrix, autoregressive model and Haar wavelet [1]. Usually, only a limited number of features carry relevant information needed for texture discrimination. There are four feature selection criteria used in MaZda: Fisher discriminant, classification error combined with the correlation coefficient, mutual information a convex hull approach and 1-nearest neighbor classifier [7]. Further feature reduction is provided by projection techniques. Procedures implemented in b11 module comprise principal component analysis (PCA), linear discriminant analysis (LDA) [8] and nonlinear discriminant analysis (NDA) [9]. The b11 module allows also visualization of sample distributions within a feature space, statistical analysis of these distributions and classification of feature vectors. Moreover, it implements procedures for nonlinear supervised classification: 1-nearest neighbor (1-NN) classifier and an artificial neural network (ANN). The other methods implemented are useful for unsupervised data classification and cluster analysis [7,10]. These are the agglomerative hierarchical clustering (AHC), the similaritybased clustering method (SCM) and k-means algorithm. MaZda also computes feature distributions within the image (feature maps). Each point of a map represents a particular textural feature value that corresponds to a region around given point of a textured image. The map is represented by a grey-scale image. To study the feasibility of image texture segmentation based on multiple feature maps, an unsupervised method of k-means clustering was implemented in b11 module. Reliable evaluation of texture analysis methods applied for medical images representing internal organs or tissues is difficult. Usually these organs are not directly available and cannot be measured to compare obtained values (e.g. of geometrical parameters) to those estimated by an automatic computer analysis. One possible solution to this problem is application of artificial objects (phantoms) with known shape and size. Then, images of these objects are analyzed (e.g. segmented) and obtained results are compared to true phantom parameters (e.g. dimensions, area). This approach was used to evaluate image analysis results obtained by MaZda. Several physical phantoms were manufactured in the Medical Physics Department, University of Dundee, Scotland and in the Institute of Clinical and Experimental Medicine, Czech Republic [11]. A series of MR images of the phantoms were recorded using a Siemens Magnetom 1.5-Tesla scanner at the German Research Cancer Center, Germany. Then, acquired images were analyzed including texture feature estimation for phantom cross-section,
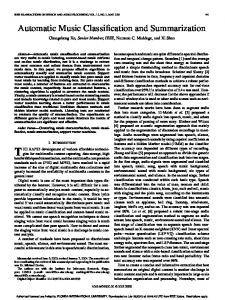
feature number reduction, generation of texture maps and finally, segmentation using different approaches. Next, the area occupied by phantom in segmented images was calculated and compared to true area of the tube cross-section. For example, when oscillator network was used as a segmentation tool, the averaged (for 50 images) segmentation accuracy (defined as the percentage of correctly classified part of segmented image) ranged from 90% to 86%, depending of the phantom type. These results reflect not only the accuracy of the applied texture analysis methods but also depend on acquisition protocol parameters (resolution, field of view) as well as on distortion and noise introduced by the scanner. The analysis accuracy using phantoms was also evaluated for other image modalities, like echo [12] and optical [13] images. 3. Applications in medical image analysis This chapter presents examples of quantitative texture analyses of images with use of the Mazda software. The first example are human foot MR cross-sections, containing heel and metatarsus bones. These 512x512-pixel images were recorded in German Cancer Research Centre, Heidelberg, Germany using a 1.5T Siemens scanner (Fig. 2a). Segmentation of these images is aimed at detection and discrimination of foot and heel bones from other tissues and image background. The extracted region is interpreted by physicians to evaluate bone microarchitecture in osteoporosis diagnosis. The stochastic image model was applied to evaluate texture features. Segmentation results of the image from Fig. 2a obtained with the oscillator network is shown in Fig. 2b. To evaluate segmentation accuracy, the Jaccard coefficient (J) was computed using the reference trabecular bone areas outlined by a physician and considered as a ground-truth. Two segmentation methods were applied, multilayer perceptron (MLP) and oscillator network (ON). Averaged J coefficient obtained for 10 cross-sections was 0.776 for MLP and 0.858 for ON, respectively. For comparison, results obtained for the MR knee bones images with the use of Gabor filter based texture features and Support Vector Machine (SVM) varied from 0.768 to 0.876 depending on the image type (phase, magnitude or both) [14]. In [15] statistical modeling based on Active Appearance Models of the knee bones was applied, obtained segmentation results were in the range from 0.565 to 0.697, depending on which knee bone was considered.
a)
b)
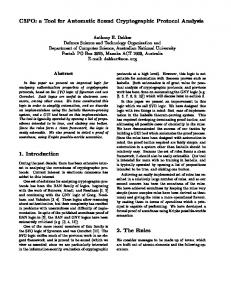
Fig. 2. Sample MR image of human foot cross-section (a – courtesy of Professor Lothar Schad). Segmentation results (b) Next case demonstrates analysis of 3D T1 MR liver images representing healthy controls and fibrotic ones. They were imaged with 3T Philips Achieva device. Sample image including segmented liver is presented in Fig. 3a. The aim of the analysis was liver tissue classification to discriminate between healthy and fibrotic one. Texture features were estimated based on 3D cubic VOIs defined inside of the liver. The NDA was performed to reduce the feature set. Sample classification results are shown in Fig. 3b. Each number in Fig. 3b represents a vector in NDA space corresponding to given VOI with liver tissue [16]. The liver diseases were diagnosed based on liver biopsy. The liver volumes were marked by experts on 3D MR data and further used as a reference. The segmentation results expressed by averaged J coefficient were 0.868 and 0,689 for ON and MLP respectively. Better performance obtained by oscillator network can be explained by its resistance both to changes of visual image information, and to noise [12]. In [17], application of level set based techniques segmentation of liver MR images was discussed. According to presented results, segmentation accuracy (evaluated by means of a Jaccard-like coefficient) ranged from 0.783 to 0.950, depending on the type of level set function used. In case of liver data classification, 10 non-overlapping 10x10x10 voxel cubic ROIs were used for each 3D image. The ROI locations in the image were selected by an expert to fit to the liver parenchyma and to avoid large blood vessels and artifacts. Classification error with the NDA classifier was equal to 8.33% over the training set. Other group of researchers reported application of MaZda for discrimination between healthy liver and liver with cysts or hemangiomas (LDA and k-NN classifiers). This approach produced misclassification rates of 16-18% on T1-weighted, and 12-18% on T2-weighted images [18].
a)
b) Fig. 3. Sample MR including segmented liver (a). Distribution of NDA features for 3D data classification (b). Class marks: 1-healthy, 2-deseased.
Analysis of MRI of the lumbar spine is another example. Sample image is shown in Fig. 4. On morphological MRI, discs were visually graded into ‘normal’, ‘bulging’ or ‘herniation’. On T2 maps, texture analysis (based on the co-occurrence matrix and wavelet transform) and geometry analysis of the discs were performed. Variance, and all three pre-selected geometric parameters differed significantly between normal and bulging, normal and herniated, and bulging and herniated discs. Since measurements in different discs of a particular subject cannot be regarded as independent, data were averaged for the different degrees of posterior disc abnormality, separately for each patient. One-way analysis of co-variance (ANCOVA) and post hoc t-tests were used to determine differences between normal, bulging, and herniated discs, with age, gender, as well as the degree of disc degeneration (Pfirrmann scale) as covariates. These tests were performed independently for the pre-selected T2 texture features and geometric parameters, as well as mean T2 relaxation times, using Bonferroni correction for multiple comparisons. These findings suggest that T2 texture features and geometric parameters are sensitive to the presence of abnormalities at the posterior aspect of lumbar intervertebral discs, and may thus be useful as quantitative biomarkers that predict disease [19].
Fig. 4. Sagittal T2 map of the lumbar spine. The red regions depict intervertebral discs -subject of texture and geometry analysis.
In fact, it has already been demonstrated that MaZda is useful for quantitative texture analysis of images obtained from medical modalities other than MR, e.g.: X-ray images (early detection of osteoporotic changes in bones [20]), echo images (classification and segmentation of heart masses [12]), optical microscopic images (assessment of cellular necrosis in epithelial cell [21]), CT images (acute ischemic stroke diagnosis [22]), confocal microscopy images (quantification and classification of brain blood vessel trees of animal models [4]). The package was also successfully employed for image analysis in food industry [1]. Rigorous assessment of the accuracy of MaZda-based texture segmentation with the use of a synthetic sponge phantom for echo images and visual texture patches for optical ones was described in [12]. 4. Conclusion The MaZda package is an efficient and reliable set of tools for quantitative analysis of medical image textures. Its efficiency was confirmed by large group of researchers who applied this software worldwide for many different texture analysis tasks. It was demonstrated that the accuracy of analysis results, obtained both for artificial phantoms and real medical images, is comparable to other state of the art techniques reported in references. Compared to other texture analysis software (e.g. LS2W), MaZda provides a complete analysis path for texture images, including feature estimation, statistical analysis of feature vectors, classification and image segmentation. Additional information on the MaZda package and its executable code can be found and downloaded from the web page http://eletel.eu/mazda of the Institute of Electronics, Technical University of Lodz. References [1] P.M. Szczypiński, M. Strzelecki, A. Materka, A. Klepaczko, Comput Meth Prog Bio. 94 (2009) 66-76 [2] M. Hajek, M. Dezortova, A. Materka, R. Lerski (editors), Texture Analysis for Magnetic Resonance Imaging, Med4publishing, Prague, 2006. [3] K. Holli, A. Lääperi, L. Harrison, T. Luukkaala, T. Toivonen, P. Ryymin, P. Dastidar, S. Soimakallio, H. Eskola, Acad. Radiol. 17 (2010) 135-141 [4] M. Kociński, A. Klepaczko, A. Materka, M. Chekenya, A. Lundervold, Comput. Meth. Prog. Bio. 107 (2012) 140-154
[5] G. De Nunzio, G. Pastore, M. Donativi, A. Castellano, A. Falini, Nucl. Instrum. Meth. A. 648 (2011) S100-S102 [6] J.J. Szymanski, J.T. Jamison, D.J. DeGracia, Comput. Meth. Prog. Bio. 105 (2012) 81-94 [7] R. Duda, P.E. Hart, D.G. Stork, Pattern Classification, second ed., John Wiley & Sons, New York, 2001. [8] K. Fukunaga, Introduction to Statistical Pattern Recognition, Academic Press, New York, 1991. [9] R. Hecht-Nielsen, Neurocomputing, Addison-Wesley, New York, 1989. [10] A.K. Jain, M.N. Murty, P.J. Flynn, ACM Comput. Surv. 31 (1999) 264-323. [11] A. Materka, M. Strzelecki, R. Lerski, L. Schad, Texture Analysis in Machine Vision, Series in Machine Percept. & Artificial Intellig., 40, World Scientific, Singapore 2000, 197206. [12] M. Strzelecki, A. Materka, J. Drozdz, M. Krzeminska-Pakula, J. D. Kasprzak, Comput. Meth. Prog. Bio. 30 (2006) 95-107 [13] M. Strzelecki, A. Materka, Proc. of the Int. Conf. ICCGV 2004, Springer 2006, 546-551 [14] P. Bourgeat, S. Ourselin P. Stanwell, S. Ramadan, Proc. of IEEE Symp. on Bio. Imag. Nano to Macro (2006) 742-745 [15] T. Williams, G. Vincent, M. Bowes, T. Cootes, S. Balamoody, C. Hutchinson, J. Waterton, C. Taylor, Automatic Segmentation of Bones and Inter-Image Anatomical Correspondence by Volumetric Statistical Modelling of Knee MRI, Proc. of IEEE Symp. on Biomed. Imag. Nano to Macro (2010) 432-435 [16] M. Strzelecki, J. de Certaines, S. Ko, Segmentation of 3D MR Liver Images Using Synchronised Oscillators Network, Proc. of ISITC 2007, Korea, 259-263 [17] C. Gang, G. Lixu, Q. Lijun, X. Jianrong, IEEE Trans. Inf. Tech. Biomed. 13 (2009) 94103 [18] M. Mayerhoefer, W. Schima, S. Trattnig, K. Pinker, V. Berger-Kulemann, A. BaSsalamah, J. Mag. Res. Imag. 32 (2010) 352-359 [19] M. Mayerhoefer, D. Stelzeneder, W. Bachbauer, G. Welsch, T. Mamisch, P. Szczypinski, M. Weber, N. Peters, J. Fruehwald-Pallamar, S. Puchner, S. Trattnig, NMR Biomed. 25(2012) 866-872 [20] S. Blouin, M.F. Moreau, M.F. Baslé, D. Shappard, Cells, Tissues, Organs, 182(2006) 182-192 [21] A. Santos, C. Ramiro, M. Desco, N. Malpica, A. Tejedor, A. Torres, M. J. LedesmaCarbayo, M. Castilla, P. García-Barreno, Automatic detection of cellular necrosis in epithelial cell cultures, Proc. of SPIE, 4322(2001) 1836-1844. [22] M.S. Oliveira, P.T. Fernandes, W.M. Avelar, S.L.M. Santos, G. Castellano, L.M. Li, Braz J Med Biol Res, 42(2009) 1076-1079