Sci
Pharm
www.scipharm.at
Open Access
Research article
A Standard Protocol for the Calibration of Capillary Electrophoresis (CE) Equipment Bodo LACHMANN *, Hannelore KOPELENT-FRANK, Christian R. NOE Department of Medicinal Chemistry, University of Vienna, Althanstraße 14, 1090 Vienna, Austria. * Corresponding author. E-mail:
[email protected] (B. Lachmann) Dedicated to em. Univ.-Prof. Dr. Dr. h.c. Mag. pharm. Wilhelm Fleischhacker in occasion of his 80th birthday. Sci Pharm. 2011; 79: 877–883 Published: Accepted:
th
October 6 2011 October 6th 2011
doi:10.3797/scipharm.1109-23 Received:
September 26th 2011
This article is available from: http://dx.doi.org/10.3797/scipharm.1109-23 © Lachmann et al.; licensee Österreichische Apotheker-Verlagsgesellschaft m. b. H., Vienna, Austria. This is an Open Access article distributed under the terms of the Creative Commons Attribution License (http://creativecommons.org/licenses/by/3.0/), which permits unrestricted use, distribution, and reproduction in any medium, provided the original work is properly cited.
Abstract Calibration of complex analytical systems is always a difficult task. Nevertheless, a suitable approach has to be designed before the systems can be introduced into routine analysis. In literature, many methods have been described for the purpose of calibrating such systems, but only a few of them deal with capillary elctrophoresis. Here, we want to demonstrate a general approach to how the calibration of this type of analytical instrument becomes feasible.
Keywords Capillary electrophoresis • Calibration of analytical instruments • GLP • ICH
Introduction In accordance to the EU-GMP guide [1] and several ICH guidelines [2], dealing with the topic of pharmaceutical analysis, calibration of analytical equipment is one of the "must" topics prior to the validation of analytical methods. In most cases, this takes place after successfully performed Design- (DQ), Installation- (IQ) and Operation Qualification (OQ). During these phases, it is demonstrated that the equipment meets the user requirements, that the equipment is appropriately installed and it is proven, and that the equipment operates within its predetermined ranges. After these basic qualification activities, a performance qualification (PQ) should take place, which shows that the equipment is able to fulfil its intended use. Part of these PQ procedures could be a first calibration of the instrument leading to a combined calibration/performance qualification report. In addition,
878
B. Lachmann, H. Kopelent-Frank, and C. R. Noe:
calibration is also part of the requalification activities, performed after a defined time period in accordance to the rules of good laboratory practice. In this contribution we want to introduce a generalised approach to how CE equipment could be calibrated. Based on a standard operating procedure (SOP) a calibration has been performed, controlling several instrumental parameters such as temperature, current stability, reproducibility of the injection system and standard deviation of peak areas and migration time, with and without internal standard. Contrary to the performance tests of most suppliers, we have used two different buffer systems to check the above mentioned parameters, e. g. buffer A at pH of 9.3 (sodium tetraborate, high EOF) and buffer B at low pH (triethyl amine pH 2.0 adjusted with phosphoric acid), suppressing the EOF nearly completely, leading to results, which are more comparable to the “normal” operation conditions than the supplier tests. In addition, peak areas and migration times are strongly influenced on the “fitness” of the capillary used, due to the fact that the migration times in an alkaline buffer system are extremely dependent on EOF, which is not the case at low pH values. For calibration purposes, two mixtures of standard substances have been used: one mixture of four aromatic acids (system 1, fig. 1) and a mixture of three aromatic amines (system 2, fig. 2). The following table (tab. 1) summarises the activities suggested for the instrument calibration: Tab. 1.
Description of planned calibration activities
Calibration Parameter Acceptance criteria Test system Reproducibility of: Peak Area / Migrationtime RSD less than 5% / 5 % System 1 and System 2, (without I.S.) 6 replicates Peak Area / Migrationtime RSD less than 3% / 3 % (with I.S.) Sample contamination / Peak area less than 1 % of System 1, injection of a blank cross contamination / carry the peak area of the after injection of the standard over standard solution solution Linearity of the Mandelic acid, injection times R not less than 0.99 injection system from 3 to 10 secondes System 1, voltage applied from Linearity of the current R not less than 0.99 15 to 30 kV Not more than 2 % Current stability over 3 min System 2, at 25 kV difference Sensitivity of the S/N not less than 25 Series of dilutions, system 1 detection system Temperature stability No change over 1 °C System 1, system 2 Linearity of the peak areas R not less than 0,99 System 1 Calibration Parameters (I.S.: one of the components used as internal standard, RSD: relative standard deviation, S/N: Signal to Noise Ratio)
Sci Pharm. 2011; 79: 877–883
A Standard Protocol for the Calibration of Capillary Electrophoresis (CE) Equipment
879
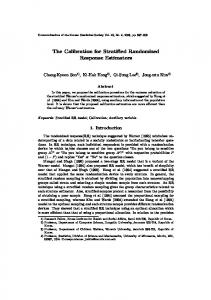
Results and Discussion The following two figures show typical electropherograms obtained with both test mixtures used: Standard Mixture 1 23
Benzoic acid
Diclofenac
Mandelic acid
mAU
13
Vanillic acid
18
8
3
-2 0
0,5
1
1,5
2
2,5
time (min)
Fig. 1.
Electropherogram of mixture 1, 25 mM sodium tetraborate, pH 9.3; 25 kV, 25 °C
Standard Mixture 2 17 15
9 7
Phenylalaninol
Phenylethylamine
mAU
11
Phenylglycinol
13
5 3 1 -1 0
1
2
3
4
5
6
time (min)
Fig. 2.
Electropherogram of mixture 2, 66 mM triethyl amine, pH 2,0; 25 kV, 25 °C
Sci Pharm. 2011; 79: 877–883
880
B. Lachmann, H. Kopelent-Frank, and C. R. Noe:
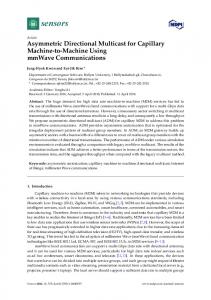
Although validation kits for CE methods are available [3] from commercial sources and generalized descriptions for the validation of CE methods have been published years ago [4, 5], we decided to develop and to perform an in-house calibration program for our CEequipment. As generally accepted, reproducibility and sensitivity in capillary electrophoresis is not as good as in HPLC. The criteria of acceptance of our program in comparison to standard calibration procedures for HPLC-equipment have been expanded. However, it has been shown that reproducibility can be poor without internal standard (see table 2, results for system 2). Keeping this in mind, the obtained correlation coefficients of the linearity testing should be evaluated critically as well (see Fig. 3).
Linearity 45000 y = 119851x + 1425,1 R2 = 0,9971
40000
y = 153804x + 875,77
35000
R2 = 0,9979 30000 y = 86904x + 1111,8
Peak Area
R2 = 0,9892 25000
20000 y = 56291x + 404,94 R2 = 0,9981
15000
10000
5000
0 0
0,05
0,1
0,15
0,2
0,25
0,3
0,35
mg/ml
Fig. 3.
Linearity data of system 1, ♦: Diclofenac, x: Vanillic acid, ▲: Benzoic acid, ■: Mandelic acid
As mentioned in the literature over 10 years ago [6], the injection system is the main source of error in quantitative CE, not only due to the small amounts injected, but also because of the type of the injection system. Nevertheless, using an internal standard, comparable quantitative results as in HPLC can be obtained, as shown by our data, in combination with a separation efficiency which can not be exceeded by any other analytical separation technique and with an extremely fast method development process. Further work will be focusing on the optimization of our protocol and on the application of this protocol to CE-units from different manufactures.
Sci Pharm. 2011; 79: 877–883
A Standard Protocol for the Calibration of Capillary Electrophoresis (CE) Equipment
Tab. 2.
881
Calibration results:
Calibration Parameter Reproducibility of: System 1 Peak Area (without I.S.) Migrationtime (without I.S.) Peak Area (with I.S.) Migrationtime (with I.S.) System 2 Peak Area (without I.S.) Migrationtime (without I.S.) Peak Area (with I.S.) Migrationtime (with I.S.) Sample contamination / cross contamination / carry over Linearity of the injection system Linearity of the current Current stability over 3 min Sensitivity of the detection system Temperature stability
Linearity of the peak areas
Results
Comments
RSD: DF 4,03 %, MA 4,76 %, BA 4,02 %, VA 3,71 % RSD: DF 0,21 %, MA 0,27 %, BA 0,36 %, VA 1,32 % RSD: DF 1,57 %, MA 1,29 %, BA n.a. (2), VA 1,42 % RSD: DF 0,19 %, MA 0,13 %, BA n.a. (2), VA 1,65 %
Passed (1)
RSD: PEA 13,1 %, PGL 13,4 %, PAL 13,2 % RSD: PEA 1,04 %, PGL 1,56 %, PAL 1,13 % RSD: PEA 0,76 %, PGL n.a. (2), PAL 0,63 % RSD: PEA 0,64 %, PGL n.a. (2), PAL 0,54 % None of the four substances was detectable in the blank R = 0,9904 for Mandelic acid R = 0,9977 between 15 and 30 kV Not more than 0.62 %
Failed (3)
S/N higher than 30 for dilution 5
Passed
stable see Figure 3 (4) DF: R = 0,9985 MA: R = 0,9990 BA: R = 0,9946 VA: R = 0,9985
Passed
Passed Passed (1) Passed
Passed Passed Passed Passed Passed Passed Passed
Passed Passed Passed Passed
Table 2: Calibration results, (1) after elimination of an outlier MA, (2) not applicable, used as internal standard, (3) last (6th) injection results in 20 % higher peak areas, compared with the first five injections, (4) calibration curves see fig. 3.
Experimental Equipment All separations were performed using a P/ACE MDQ capillary electrophoresis system with an UV detector (fixed wavelength) (Beckman Instruments, Munich, Germany). Photometric on-column detection was carried out at 214 nm. 32 Karat© software was applied for instrument control, data acquisition and analysis.
Sci Pharm. 2011; 79: 877–883
882
B. Lachmann, H. Kopelent-Frank, and C. R. Noe:
Electrophoretic conditions Uncoated fused-silica capillaries (Polymicron) of 50 µm I. D. (385 µm O. D.) with polyimide coating of the outer surface were used for all separations. Capillaries of a total length of 30 cm were used and the detector was situated 10 cm (PACE MDQ) from the cathodic end (normal polarity). The capillary was flushed with 0.1 M NaOH for 1 min and with buffer for further 1 min prior to each analysis, in addition with 0.1 M NaOH for 20 min prior to first use. Samples were injected by pressure (0.5 psi) and separations were carried out with 25 kV at ambient temperature (25 °C) (Beckman capillary cartridge coolant). Chemicals and Buffers All chemicals were purchased from Sigma-Aldrich and Acros. Separation buffer 1 was prepared by diluting a 0.1 M stock solution of sodium tetraborate, resulting in a concentration of 25 mM sodium tetratborate, pH 9,3. Separation buffer 2 was prepared by solving 1 g of triethyl amine in 150 ml of HPLC grade water and adjusting pH 2.0 by adding 85 % phosphoric acid. Samples The two test mixtures were prepared from stock solution of the following concentrations: Mixture 1 Diclofenac Sodium (DF) 131,1 mg/100 ml, Benzoic acid (BA) 105,1 mg/100 ml, Mandelic acid (MA) 22,9 mg/25 ml and Vanillic acid (VA) 21,8 mg/25 ml. The substances have been solved in a mixture of BGE and water (2+8). 100 µl of each solution has been used for the standard mixture. Mixture 2 Phenylethylamine (PEA) 25,2 mg/25 ml, Phenylglycinol (PGL) 19,5 mg/25 ml and Phenylalaninol (PAL) 20,1 mg/25 ml. The substances have been solved in water with addition of 5 ml of 0.1 N HCl. 100 µl of each solution has been used for the standard mixture.
Authors' Statement Competing Interests The authors declare no conflict of interest.
References [1]
EudraLex: The Rules Governing Medicinal Products in the European Union. http://pharmacos.eudra.org/F2/eudralex/index.htm
[2]
International Conference on Harmonisation of Technical Requirements for Registration of Pharmaceuticals for Human Use (ICH). www.ich.org, Guidelines Quality.
[3]
Beckman-Coulter P/ACE System MDQ Amine Capillary Validation Kit, Part No. 501305.
Sci Pharm. 2011; 79: 877–883
A Standard Protocol for the Calibration of Capillary Electrophoresis (CE) Equipment
[4]
Altria KD, Rudd DR. An Overview of Method Validation and System Suitability Aspects in Capillary Electrophoresis. Chromatographia. 1995; 41: 325–331. http://dx.doi.org/10.1007/BF02688047
[5]
Waetzig H, Dette C. Precise Quantitative Capillary Electrophoresis Methodological and instrumental aspects. J Chromatogr. 1993; 636: 31–38. http://dx.doi.org/10.1016/0021-9673(93)80053-B
[6]
Kunkel A, Degenhardt M, Schirm B, Wätzig H. Performance of instruments and aspects of methodology and validation in quantitative capillary electrophoresis An update. J Chromatogr A. 1997; 768: 17–27. http://dx.doi.org/10.1016/S0021-9673(97)00068-X
Sci Pharm. 2011; 79: 877–883
883