Quality Indicator) that can be attained by popular wireless networks. ... especially places like theme parks, shopping centers, and food courts. To estimate ... a passive crowd density estimation system that could be installed on existing ... WP. 2. 4. ][ â. â . â. â. â. â. = Ï Î». (1). We can calculate RSSI[dBm] by. ) 1/( log1010. mW.
A Study on Passive Crowd Density Estimation using Wireless Sensors M. Nakatsuka*, H. Iwatani* and J. Katto* *
Department of Computer Science, Waseda University 3-4-1, Okubo, Shinjyuku-ku, Tokyo, 169-8555, Japan. {nakatsuka, iwatani, katto}@katto.comm.waseda.ac.jp ABSTRACT For automatic monitoring systems and user oriented services, crowd density estimation becomes an important research topic. There are existing methods like the camera based crowd density estimation or the RFID based counting systems. However, these methods need deployment cost and enough spaces to set the sensors. In this paper, we therefore present a passive estimation system that could be easily installed on existing infrastructures. To be precise, we use RSSI (Received Signal Strength Indicator) and LQI (Link Quality Indicator) that can be attained by popular wireless networks. Furthermore, we develop a prototype system which combines visual marker detection to locate the place, Web services to collect/distribute sensor data, and augmented reality visualization to enhance the estimated crowdedness. Keywords: Crowd density, Sensor Network, RSSI, LQI, ZigBee, Wireless LAN
1
INTRODUCTION
Many places like shopping centers, airports and stations now need automatic monitoring systems of human flow on which related researches are focusing. Simultaneously, many people want to know how crowded a certain place is, especially places like theme parks, shopping centers, and food courts. To estimate, there are some examples of camera based methods [1][2]. We ourselves have developed a system that detects persons in a movie and estimates their genders and ages [2], which can be applied to people counting system. However, the camera based methods have weaknesses about where to put the camera, especially the height. Furthermore, setting a camera in a certain place may be prohibited mainly because of privacy reasons. There are also RFID based counting systems, but they force every people to have RFIDs which need considerable deployment cost. Therefore, in this paper, we propose a passive crowd density estimation system that could be installed on existing wireless networking infrastructures that uses RSSI and LQI. Since our initial target was visual wireless sensor networks, this is by-product of our research. There are some researches that relate RSSI to human activities [3][4]. Youssef et al estimated a person’s passage detection, tracking and location.
They mentioned that counting the entity is a challenge. We then try to verify the relationship between RSSI/LQI values and the amount of people using wireless nodes that are placed everywhere when ubiquitous society comes to true. We also develop a prototype system of the crowd density estimation along with marker detection, Web services and augmented reality interfaces to enable an effective presentation to the users.
2
PROPOSAL
2.1 RSSI and LQI RSSI is a signal strength obtained by monitoring the packets that are communicated between two nodes. If a human being crosses between the nodes, the RSSI value gets violated [3].If the number of people increases, the violation increases as well. Even in a condition where people are not moving, the same behavior will be observed because 60~70% of human body is composed by water. One characteristic a radio wave has is that it gets absorbed by water. So our assumption is that, as the number of people increases between the two nodes, either static or moving, the RSSI average value decreases and its variance increases. The following formula is Friis transmission equation. Let
λ[m] be radio wavelength, D[m] be distance between nodes, GT[dBi] and GR[dBi] be the antenna’s absolute gain of the sender and receiver node, and PT[W] be the electric power of the sender node. Then, the electric power of the receiver PR[W] is defined by 2
⎛ λ ⎞ PR [W ] = ⎜ ⎟ GT GR PT ⎝ 4πD ⎠
(1)
We can calculate RSSI[dBm] by
RSSI = 10 log 10 ( PR / 1mW )
(2)
On the other hand, LQI is derived by signal strength and noise interference when the physical layer receives a frame and sends it to the upper layer. We can gain the value from received packets. This value is supposed to be from 0x00 to 0xFF. By using next equation, we can convert the value to the scale from 0 to 255.
-76 -78 -80 -82 -84 -86 -88 -90 -92 -94
0
number of people 8 12 16
4
20
AVERAGE VARIANCE
18 110 16 105 14 12 100 10 95 8 90 6 4 85 2 80 0
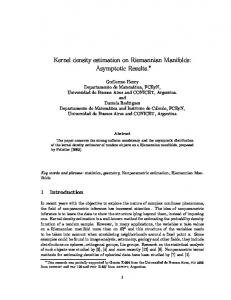
Fig.1: RSSI and the number of people when people are static (mote)
AVERAGE VARIANCE
0
4
number of people 8 12 16
25 -58 20 15 10 AVERAGE VARIANCE
0
4
number of people 8 12 16
20
20
-79 -80
5
0
4
number of people 8 12
16
-60 -62 AVERAGE VARIANCE
-64 -66 -68
0 -70
Fig.4:LQI and the number of people when people are moving (mote)
LQI = (raw _ data10 − A) × B
Fig.5: RSSI and the number of people when people are static (wireless LAN)
(3)
where raw_data is the value obtained from the received packets and A and B are experiential values. We define A as 0, and B as 1. The LQI value is from 50 to 110 in case of the sensor we use. The higher the value is, the link quality is better. The LQI has strong dependence on the PRR (packet received rate) [6][7]. As the crowd density in an environment increases (if or if not people are moving), the radio wave is absorbed by the people and the PRR drops. Therefore, similar to the RSSI case, as the number of people increase, LQI average decreases and LQI variance increases. For non human objects, metal reflects some amount of radio wave but other things like plastics and a fiber let it through well, so these aspects can be ignored[8].
2.2 Experiment Conditions We use two nodes for the experiment. One is for receiving and the other is for sending. The height where each node is placed is 0.9m for the sender and 0.7m for the receiver. The distance between the two nodes is 8.0m. We assume two main scenarios: people are moving (walking speed is around 2m/s) and people are sitting between the nodes (each person keep within 3.0m width space). We increase the crowd density for both scenarios by
0
4
number of people 8 12
25 16
20 20
-81 AVERAGE VARIANCE
-82
15 10
-83 -84
5
-85
0
Fig.2: LQI and the number of people when people are static (mote)
30 -56
107.5 107 106.5 106 105.5 105 104.5 104 103.5 103
160 140 120 100 80 60 40 20 0
Fig.3:RSSI and the number of people when people are moving (mote)
18 -57 16 -58 14 -59 12 -60 -61 10 -62 8 -63 6 -64 4 -65 2 -66 0 -67
0
4
number of people 8 12
25 16 20 15
AVERAGE VARIANCE
10 5 0
Fig.6:RSSI and the number of people when people are moving (wireless LAN)
increasing the number of people and measure the RSSI and LQI values. To derive the average and variance values, we collect 100 samples for each, which is about 20 seconds of communication. The sensors we use are MicaZ mote by Crossbow, which uses Zigbee for wireless communication. We also carry out the same experiment using a notebook computer (Let’s note by Panasonic) and a wireless LAN access point (AirStation Access Point WLA-2-G54C by Buffalo), which uses IEEE 802.11b for wireless communication.
2.3 Results and Evaluations The graphs from Figure 1 to Figure 6 show experimental results, in which average and variance values of RSSI and LQI with the number of people are plotted.
2.3.1
Zigbee Case
For experiments using ZigBee sensors (Figs.1~4), we can observe RSSI and LQI variance values for both the static and moving conditions basically increase, and the average values for both the conditions decrease as the crowed density increases. As for the RSSI in the static condition (Fig.1), the variance increases rather in a linear way, but for the moving condition (Fig.3), it increases in a logarithm way. From this observation, we can envision that the human movement raises the probability of the radio wave to be absorbed by
Wireless LAN Case
For the wireless LAN (Figs. 5,6), we can observe that the RSSI average decreases and the RSSI variance increases as the crowd density increases similar to the ZigBee case (though we did not measure LQI values due to limitation of our test environment). From this result, we can say that estimating the crowd density using signal strength in wireless LAN communication is possible, too. Also, we use a small space for this experiment, but the range power for ZigBee and 802.11b is strong enough for more broad range estimation of crowd density.
3
THE MODELING OF ESTIMATION
We have done another experiment to model the estimation. The experiment conditions are basically the same as the experiment we did on the last chapter except the distance between the two nodes are 4.5m. The scenario is also the same as the last chapter except the width of the space is 4.5 and we increased the number of people by one, from zero to nine. Also to derive the average and variance, we used 300 samples(about a minute in time measurement).
3.1 Modeling for the Results
0
1
2
3
4
5
6
7
8
9
RSSI[dBm]
-62 -63
AVERAGE linear approximation
-64 -65 -66
y = -0.475x - 61.599
-67
number of people
Figure 7:RSSI average with the number of people 30 y = 3.0627x - 0.1069 25 20 15
VARIANCE linear approximation
10 5 0 0
1
2
3
4 5 6 number of people
7
8
9
Figure 8:RSSI variance with the number of people The results are shown on Figure 7 and 8. From this result we derived an approximation formula in a linear expression.
num _ of _ people =
num _ of _ people =
(average + 61.599) − 0.475
(variance + 0.1069) 3.0527
(4)
(5)
We use them as the modeling of estimation.
3.2 Estimation using the Model 16 VARIANCE
14
AVERAGE
12
VARIANCE+AVERAGE
10
ACTUAL
8 6 4 2 0 0 15 30 45 60 75 90 105 120 135 150 165 180 195 210 225 240 255
2.3.2
-61
number of people
human. Furthermore, because the variance seems to reach the higher limit of its value as observed from Fig.3 (around 20~25), as long as the static condition value increases in a linear way, it could count up to 23~29 people in the experiment environment. On the other hand, in the static condition (Fig.1), the average decreases from -82[dBm] to -92[dBm], but in the moving condition (Fig.3), it decreases from -81[dBm] to -84[dBm] and changes a little. This is because, as the number of people increase, more radio wave is absorbed in the static condition and the RSSI average decreases drastically than in the moving condition. For the LQI values, in the static condition (Fig.2), the variance value drastically changes between 16 people and 20 people, while in the moving condition (Fig.4), it does not. This is because, in the static condition where people aren’t moving, packet losses continuously happen, resulting in a drastic drop of the variance value. On the other hand, when people are moving, sometime a lot of packets might be lost but other times they may be passed, resulting in a stable value, which contributes to accepting more people for counting. For the average value, LQI’s characteristics are almost the same as RSSI’s. According to these results, we can estimate not only crowd density but also the conditions of the people.
time[s]
Figure 9:Estimation result
difference
VARIANCEAVERAGE HYBRID 24.0098 55.05956 32.63832
Table 1: Difference of the actual data and estimation result We did another experiment in the same condition as the one we derived the model formula. The scenario is also basically the same except we decreased two people at a time from 10 to 0. To assume a real time estimation we used 75 samples(about 15 seconds in time length) to derive the average and variance. From the data, we used the model formula to estimate the number of people. The results are shown on Figure 9. We calculated the difference of the actual data and the estimated outcome (Table 1). From Table 1, the average difference is 24.0098/16=1.5006. This shows that though it is not totally robust, our proposal seems to be effective. As we can see, the variance showed better accuracy than the average. However, looking at the average estimation values, they all seem to be higher than the actual values. Though we did both experiment in the same exact condition there are delicate factors like batteries, and the angles of the antenna. If we could put some kind of an offset for the estimation, the accuracy could be improved. For the variance, the roughness of the outcome is thought to be because of the decrease of the number of samples we used for the estimation.
4
PROTOTYPE IMPLEMENTATION
In the previous section, we mentioned about crowd density estimation using RSSI and LQI values. In this section, we describe a system prototype we implemented which presents sensor data in an effective way
Crowd Density
Marker Recognition
Sensor Data
Access Web Service
Marker ID
Server
Server
Markers
Client
Red Hat Linux 9 J2SE 1.4.2-12 J2EE 1.33 Apache Tomcat 4.1.31 Apache 2.0.58 Axis 1.1rc2
Data Base
PostgreSQL 8.1.4
OS Development Environment SOAP Engine
Windows XP SP2
AR Library OS
Sensor
Visual Studio .NET 2003 .NET Framework 2.0 ARToolKit 2.71.3 OpenVRML 0.14.3 Tiny OS
Product Name
MICA2 Mote
Figure 12: Development Environment
4.1 System Configuration 3.1.1
System Architecture
Fig. 11 shows our system overview. The RSSI and LQI values are sent to the server from the sensors. When the server is accessed by the client, it calculates the average and variance values using the past 50 data. Then, we calculate the crowd density from the values using the modeling we set through experiments. The camera mounted client machine (PDA) recognizes markers to identify the data to access. According to the data it receives from the server, the system shows the crowd density using augmented reality. Fig.12 shows the development environment.
Web Services
We collect and deploy the sensor data using Web service in order to avoid platform dependency and simplify application development. The service is implemented using Axis1.1 which is a SOAP oriented Web service. By this implementation we can access the sensor data using simple methods like get_sensor_data(sensor_id), as long as we have a SOAP engine. Code
Figure 11: System Overview
Web Server SOAP Engine
3.1.2 Sensors
Client
OS Development Environment
Capacity
ARToolkit
Pattern matching
QR Code[10]
Can hold maximum of 7,089 digits of numbers
Cybercode[11]
1,677,626 patterns
ARToolkitplus[12]
2,046patterns
Sample
Other used in prototype real time detection
real time detection
real time detection
Figure 13: Examples of Two-dimensional Markers
3.1.3
Marker Detection
The maker detection is implemented using the ARToolkit [9] library. This library enables real-time marker detection. It uses pattern matching to identify each marker. Though we can create our own marker and the library can learn it, the more we create new ones the more it may fail to identify each. This brings the problem of scalability. Figure 9 shows some examples of two dimensional markers. The original QR code [10] was not for real time detection. However the capacity is scalable and it can hold information such as alphabets. This means it can contain URIs to access web services. After auxiliary experiments, we decided to combine the ARToolkit marker and the QR code. By simply embedding the ARToolkit marker to the QR code (Fig.14), the space can be saved. We decode the QR code first to get two types of information: where to access the service and which ARToolkit marker to use. After this initial process the crowed density is shown by using the ARToolkit marker. Though this method needs time to decode the QR code, it is a simple way to solve the scalability problem.
3.1.4
Augmented Reality Interface
In order to show the crowdedness in an effective and comprehensible way, we built an augmented reality enhanced interface using OpenGL part of the ARToolkit library.
4.2 Implementation The implementation result is shown in Fig.15. By embedding a marker into a floor guide and capturing the marker through a camera mounted on PDAs, the crowd density information is overlaid onto a floor guide map. As the density increases, the number of overlaid virtual people increases.
Figure 15: Prototype Implementation
5
This paper proposed a crowd density estimation method using RSSI and LQI values of wireless communication. We also showed a possibility to estimate conditions of the people, sitting or moving, for example. The estimation needs calibration and its accuracy may drop depending on human activity, but taking a sufficient amount of samples leads to stable estimation. We also presented a prototype system that utilizes the estimation result. We combined Web services, marker detection and augmented reality interface. By using this system, people can get crowd density information and other useful information visually. As future work, by combining other sensor data such as sound, magnetic and light, we try to improve estimation accuracy. We also try to build new Web applications like a restaurant search engine using the crowd density and a human navigation system that warns or avoids crowded places.
6
Figure 14: An Example of Marker Embedded Floor Guide
CONCLUSIONS
REFERENCES
[1] S.F.Lin, J.Y.Chen, and H.X.Chao, “Estimation of Number of People in Crowded Scenes Using Perspective Transformation,” in IEEE Trans. System, Man, and Cybernetics, Vol.31, No.6, pp.645-654 (2001) [2] K.Ueki, H.Komatsu, S.Imaizumi, K.Kaneko, N.Sekine, J.Katto and T.Kobayashi, “A Method of Gender Classification by Integrating Facial, Hairstyle, and Clothing Images”, ICPR 2004 (2004) [3] M.Youssef, M.Mah and A.Agrawala, “Challenges: Device-free Passive Localization for Wireless Environments”, ACM Mobicom 2007 (2007) [4] K.Vandenbussche, “Fine-grained Indoor Localization using Wireless Sensor Nodes”, Master's thesis, Delft University of Technology (2005) [5] K.R.Segal, B.Gutin, E.Presta, J.Wang and T.B.V.Itallie, “Estimation of Human Body Composition by Electrical Impedance Methods: A Comparative Study”. J Appl Physiol, 58:1565–71 (1985) [6] K.Srinivasan, P.Levis, “RSSI is Under Appreciated”, EmNets 2006 (2006)
[7] J Polastre, R Szewczyk, D Culler, “Telos: enabling ultra-low power wireless research”, Information Processing in Sensor Networks IPSN 2005 (2005) [8] L.J.Ippolito, “Radio Propagation for Space Communications Systems”, Proc. of the IEEE (1981) [9] ARToolkit http://artoolkit.scourceforge.net. [10] QRcode.com http://www.denso-wave.com/qrcode / [11] J. Rekimoto, Y. Ayatsuka, “Cybercode: Designing augmented reality environments with visual tags“, DARE 2000, pp. 1–10 (2000) [12] ARToolkitplus http://studierstube.icg.tugraz.ac.at/handheld_ar/artoolkitplus.php.