Information-An International Interdisciplinary Journal, Vol. 17(8), 2014
A SUPPORT VECTOR MACHINE APPROACH FOR CHURN PREDICTION IN TELECOM INDUSTRY Ali Rodan, Hossam Faris, Jamal Alsakran, and Omar Al-Kadi King Abdulla II School for Information Technology The University of Jordan Amman, 11942, Jordan e-mail: {a.rodan;hossam.faris;j.alsakran;o.alkadi}@ju.edu.jo
Abstract. Customer churn is an important and challenging problem that faces telecommunication companies worldwide. Recently, companies have been investing more in developing accurate prediction models which can forecast which customers are about ending their subscriptions or switching to another competitor service provider. These models can help Customer Relationship Management (CRM) in designing effective strategies to retain current customers. In this paper, a Support Vector Machine (SVM) model is developed for predicting customer churn in a local telecommunication company. In general, SVM models are parametric and the initial values of its parameters have great influence of its accuracy and performance. Therefore, a new combined evaluation metric is applied while tuning the parameters of SVM in order to maximize its effectiveness for churn management.
1 INTRODUCTION Customer churn or customer attrition is a great challenge for many companies. Customer churn happens when a customer ends his subscription and switch to another competitor. There are many factors that affect the customer’s decision to turn to another service provider. In general, such factors are related to the cost and the quality of the service. Customer churn causes serious profit loss when exceeds certain limits. On the other hand, companies realize that attracting new customers is much more expensive than preserving existing ones [1, 2]. For these reasons, telecommunication companies are paying great attention and investing more in developing a robust churn prediction model. Numerous machine learning approaches were proposed by researchers and practitioners for predicting churn customers especially in the telecommunication business. Such machine learning approaches include traditional classification methods like Decision Trees algo-
3962
Rodan et al.
rithms, Naive Bayes and Logistic Regression [3, 4, 5]. It also includes artificial intelligence based approaches like Artificial Neural Networks (ANN) and Genetic Programming [6, 7]. In literature, ANN based approaches are among the most considered and investigated approaches for churn prediction. ANNs are mathematical models inspired by the biological nervous systems. ANNs showed promising accuracy precision in predicting churn rates [6]. However, ANNs follow a category of approaches which are based on empirical risk minimization that always lead to low generalization ability of the developed models [8]. Churn data are imbalanced data by nature; where the class of interest (number of churner customers) has rare appearance in the whole dataset compared to the other class. Therefore, in such case, it is important to take into consideration that there are number of problems can rise such as the use of improper evaluation metrics [9]. In this paper, we propose the application of Support Vector Machine (SVM) for predicting churn in a telecommunication company. In our SVM application, we handle the class imbalance problem by using a simple customized evaluation metric that maximize the churn prediction power of the developed SVM model while minimizing the cost of the retention campaigns. SVM is a powerful prediction technique which has many advantages over other traditional classification and prediction techniques. One of the most important advantages is that the solution of the problem relies on a small subset of the dataset which gives SVM a great computational advantage. SVM aims to minimize the upper bound of generalization error instead of minimizing the training error [8]. SVM were successfully applied for pattern recognition, static function approximation and regression [10, 11, 12], it has been also used for time series prediction with interested results [13]. SVM has some distinct advantages such as highly accurate (globally optimal), speed (it potentially runs fast), good generalization ability, and less prone to overfitting problems [11, 12]. The following articles give more background [8, 14]. The rest of this paper is structured as follows: Section 2 gives a background on Support Vector Machines. In Section 3 the proposed SVM framework is presented. Churn Dataset Description is given in Section 4. Experiments and Results are presented in Section 5. Finally, our work is concluded in Section 6. 2 SUPPORT VECTOR MACHINES Support Vector Machine (SVM) which is introduced and developed by Vladimir Vapnik and his co-workers at AT&T Bell Laboratories [8], is a powerful supervised learning method for regression and classification problems that makes predictions using a linear combination of kernel basis functions. SVM is an implementation of the structure risk minimization (SRM)[15] principles which seeks to minimize an upper bound of the generalization error rather than minimize the empirical error
SVM Approach for Churn Prediction in Telecom Industry
3963
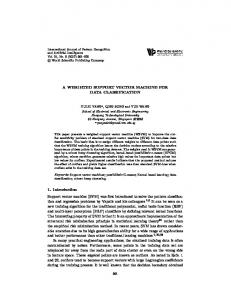
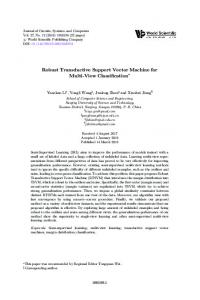
implemented in other neural networks, it uses a kernel to map the input data to a high dimensional space where the data is linearly separated in classification problems, or to find an optimal 1 hyperplane that optimize the distance between two datasets in regression problems. Figure 1 shows the optimal hyperplane in SVM that separates two datasets, the vectors near the hyperplane are called the Support Vectors (SVs). The accuracy of a SVM model largely depends on the selection of the kernel parameters [16], since these parameters have a significant impact on the performance of kernel method. The number of these parameters depend on the margin that separates the datasets. Wx + b =1 Dataset1 Wx + b >1 Wx + b =-1
Support vector margin
Dataset2 Wx + b +b
(1)
Where w and b are the weight vector and a constant respectively, which have to be estimated from the data set. ϕ is a non linear mapping function. This regression problem can be formulated as to minimize the following regularized risk function: 1
A hyperplane with maximal normalized margin with respect to the dataset.
3964
Rodan et al. n C∑ 1 Lε (f (xi ), yi ) + ∥w∥2 R(C) = n i=1 2
Where Lε (f (xi ), yi ) is known as ε−intensive loss function and given by the following equation: { |f (x) − y| − ε |f (x) − y| ≥ ε Lε (f (x), y) = (2) 0 otherwise Introducing the slack variables ξi and ξi∗ makes the problem in the following constrained form; Minimize: ∑ 1 = ∥w∥2 + C (ξi + ξi∗ ) 2 i=1 n
R(w, ξi∗ )
(3)
Subject to: yi − < w, xi > −b < w, xi > +b − yi ξi , ξi∗
≤ ε + ξi ≤ ε + ξi∗ ≥0
(4)
C is a regularized constant greater than 0 to perform balancing between the training error and model flatness. C represents a penalty for a prediction error that is greater than ε. ξi and ξi∗ are slack variables that form the distance from actual values to the corresponding boundary values of ε. The objective of SVM is to minimize ξi , ξi∗ and w2 . The above optimization with constraint can be converted by means of Lagrangian multipliers to a quadratic programming problem. Therefore, the form of the solution can be given by the following equation: f (x) =
n ∑
(αi − αi∗ )K(xi , x) + b
(5)
i=1
Where αi and αi∗ are Lagrange multipliers which are Subject to the following constraints: n ∑ (αi − αi∗ ) = 0 i=1
0 ≤ αi ≤ C
i = 1, ..., n
0 ≤ αi∗ ≤ C
i = 1, ..., n
SVM Approach for Churn Prediction in Telecom Industry
3965
K(.) is the kernel function and its values is an inner product of two vectors xi and xj in the feature space ϕ(xi ) and ϕ(xj ) and satisfies the Mercer’s condition. Therefore, K(xi , xj ) = ϕ(xi ).ϕ(xj ) There are some useful Kernel functions: • Polynomial Kernel: which generates a polynomials of order d in the input space K(xi , xj ) = (xi .xj + 1)d . • Hyperbolic Tangent Kernel: K(xi , xj ) = tanh(c1 (xi .xj ) + c2 ). • Radial Basis Kernel: which generates a radial basis function with variance p: K(xi , xj ) = exp(|xj − xi |/2p2 ). Kernel functions have a great impact on the performance of SVM. In this paper we will concentrate on Radial Basis Function (RBF) kernel to classify customer churn in a telecommunication company. 2.2 Finding Optimal SVM parameters The accuracy of the SVM model is highly dependent on the selection of the model parameters. Several parameters need to be tuned by cross validation, these parameters include C (error/margin trade-off parameter), ε (controls the width of the ε -intensive zone) which they are first decided by the user, and the Kernel parameters which are crucial for the performance of SVM.
Table 1: Confusion matrix Actual non-churners churners Predicted non-churners A B Predicted churners C D
3 PROPOSED SVM BASED FRAMEWORK High predictive churn models can effectively support retention campaigns to minimize their cost and improve marketing decisions. Campaign costs have direct impact on the design of the campaign and implicitly on the evaluation metrics of the developed churn prediction models. For example, a low cost retention campaign can target a large number of customers to maximize the probability of including churner customers as much as possible. Where in the case of high cost retention campaigns, its important to reach the smallest number of customers with the highest possible
3966
Rodan et al.
churners rate. On the other hand, churn customers have rare appearance (imbalanced distribution) in the whole dataset compared to the other class. This problem makes the classical accuracy criteria not suitable for evaluating and selecting the best SVM prediction model. Based on the confusion matrix shown in Table 1, accuracy represents the percentage of the total number of predictions that are correctly classified and can be given by Equation 6. Accuracy =
A+D A+B+C +D
(6)
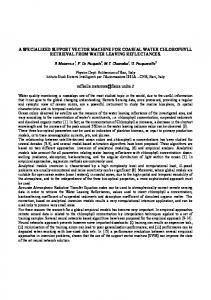
Motivated by the previous statement, we propose a framework based on SVM for customer churn prediction as shown in Figure 2. The main goal of our framework is to help customer relationship management (CRM) to achieve the maximum coverage of the retention campaign and minimize its cost. The framework considers the size and cost of the retention campaign in designing model evaluation criteria. In our proposed framework, we emphasize the link between the cost of the retention campaign and the selection of the evaluation criteria of the developed model for churn prediction. The evaluation criteria used in our framework to select the best SVM model is represented in Equation 7, where τ is a threshold constant that should be tuned by CRM to ensure a minimum level of achieved accuracy. M aximize (Churn rate), Accuracy > τ
(7)
Where churn rate represents the percentage of predicted churn in actual churn, and it can be given by the following equation: Churn rate =
D B+D
(8)
The rest of the framework describes the process of finding the best SVM model. Grid search with cross validation is applied to tune the parameters of the SVM model. Parameters tuning is performed in order to boost its prediction power. Finally, the SVM model is also assessed using the Hit rate and Lift coefficient evaluation criteria which can be given by the following equations: Hit rate =
D C +D
Lif t coef f icient =
D (C + D).CP
(9)
(10)
Where Hit rate (HR) shows the percentage of predicted churn in actual churn and actual non-churn and Lift coefficient (LC) represents the precision of model. The parameter CP represents the real churn percentage in the data set.
SVM Approach for Churn Prediction in Telecom Industry
3967
Fig. 2: Proposed SVM based framework for churn prediction
4 DATASET DESCRIPTION The data set is provided by a major Jordanian telecommunication company. The data set contains 11 attributes of randomly selected 5000 customers with a prepaid subscription for a time interval of three months. The last attribute indicates whether the customer churned (left the company) or not. The total number of churners is 381 (7.6% of total customers). The attributes along with their description are listed in Table 2. The data is normalized by dividing each variable by its standard deviation. Normalization is recommended when data variables follow different dynamic ranges. Therefore, to eliminate the influence of larger values, normalization is applied to make all variables lie in the same scale. 5 EXPERIMENTS AND RESULTS 5.1 Tuning SVM parameters One of the important factors that affect the application and performance of SVM classifier is finding the optimal SVM parameters. The first parameter is C which is a trade-off between training error and the flatness of the solution. The other parameter is γ of the RBF kernel function. Grid search is applied to automatically adjust the parameters C and γ on three levels with 3-folds cross validation. Search starts with
3968
Rodan et al.
Attribute name 3G Total Consumption Calling fees Local sms fees Int’l sms fees Int’l calling fees Local sms count Int’l sms count Int’l MOU Total MOU On net MOU Churn
Table 2: List of attributes Description Subscriber is provided with 3G service (Yes, No) Total monthly fees (calling +sms) in (JD) Total monthly calling fees (JD) Monthly local sms fees (JD) Monthly fees for international sms (JD) Monthly fees for international calling (JD) Number of monthly local sms Number of monthly international sms Total of international outgoing calls in minutes Total minutes of use for all outgoing calls Minutes of use for on-net-outgoing calls Churning customer status (yes, No)
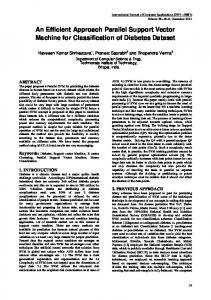
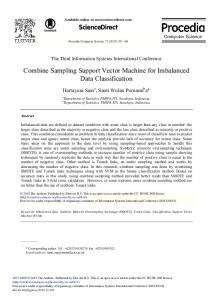
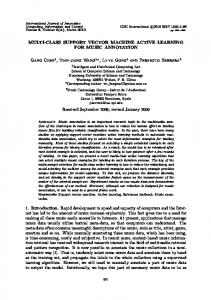
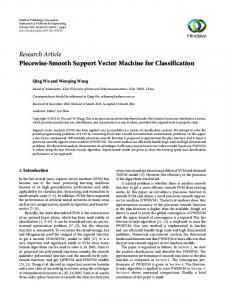
a loose grid with log2 C = {−20, −19, ...19, 20} and log2 γ = {−20, −19, ...19, 20} then it narrows twice as shown in Figures 3-a, 3-b and 3-c, respectively. The evaluation metric used in the search is given in Equation 7 where τ is the accuracy margin proposed earlier which can be determined based on the cost of the retention campaign and strategy. In our experiments, τ is set to 90% to ensure that at least 90% of the classified instances are correct. As shown in Figure 3-c, the best obtained values are log2 C = 21.5 and log2 γ = −6.8. 5.2 Evaluation and comparison The developed SVM model based on parameters tuned in the previous stage is assessed using the evaluation criteria described in section 3. This SVM model is also compared with the following common machine learning approaches used in the literature: 1)Multilayer Perceptron (MLP) Neural Network with backpropagation learning algorithm, 2)k-Nearest Neighbour (IBK), 3)Naive Bayes (NB) 4)C4.5 Decision Trees algorithm. Comparison results are shown in Figure 4. From Figure 4-a, it can be noticed that the best accuracy is obtained by SVM with 98.7%. However, as stated before, accuracy could be not the best evaluation criteria in cases of imbalanced data distributions such as churn data. Therefore, we need to take into consideration other criteria; such as hit rate, churn rate and lift. Although Figures 4-b and 4-d show that SVM got the second best results after the C4.5 decision trees algorithm, SVM achieved the best churn rate 94.3% (see Figure 4-c). 6 CONCLUSION Customer churn is an important and complex problem that faces telecommunication companies globally. This problem can lead to serious profit loss. Therefore, com-
3969
SVM Approach for Churn Prediction in Telecom Industry 0.8 −15
0.7 0.81
19.0
−10
0.6 0.805
0.5
0
19.5
0.8
0.795
0.4 Log2c
Log2c
−5
5
20.0
0.79
0.3 0.785
10
20.5
0.2
0.78
15
0.775
0.1 21.0
20
0.77
−15
−10
−5
0 Log2γ
5
10
15
20
0 −8.0
(a) Large grid
[ht]
−7.5
−7.0 Log2γ
−6.0
(b) Medium grid
20.5
0.83
0.82
20.8
Log2c
−6.5
0.81 21.0
0.8 21.3 0.79
21.5 0.78 −7.0
−6.8
−6.5 Log2γ
−6.3
−6.0
(c) Fine grid Fig. 3: Optimizing SVM parameters using different levels of grid search
SVM
SVM
0.987
MLP
0.944
0.537
NB
NB
IBK
0.947
IBK
C4.5
0.955
C4.5
0.0
0.2
0.4
0.6
0.8
0.935
MLP
1.0
0.798
0.177
0.863
1.000
0.0
0.2
(a) Accuracy
0.4
0.6
0.8
1.0
(b) Hit rate
[ht] SVM
SVM
0.943
MLP
0.632
0.925
NB
NB
IBK
0.594
IBK
C4.5
0.575
C4.5
0.0
0.2
0.4
0.6
8.817
MLP
0.8
(c) Churn rate
1.0
0.0
7.525
1.672
8.142
9.434 2.0
4.0
6.0
8.0
10.0
(d) Lift
Fig. 4: Evaluation results for SVM and traditional prediction algorithms
3970
Rodan et al.
panies always look for powerful prediction models which help in predicting those customers who are about leaving. However, developing models for churn prediction is not straight forward for many reasons. One of these, is the nature of the data (imbalanced data distribution) which makes applying the normal evaluation metrics is not appropriate. In this paper, we applied a Support Sector Machine (SVM) approach for developing a churn prediction model. In order to achieve better performance, the parameters of the SVM were optimized using a grid search with a customized evaluation metric which can be adapted regarding the cost of the retention campaign strategy. The developed SVM model were evaluated and compared with traditional classification techniques from literature. The proposed model showed promising results and high prediction power. 7 ACKNOWLEDGEMENTS Authors would like to thank the Jordanian mobile telecommunication operator Umniah for providing the required technical assistance and the data for this developed research work.
REFERENCES [1] J. Hadden, A. Tiwari, R. Roy, and D. Ruta, “Computer assisted customer churn management: State-of-the-art and future trends,” Computers and Operations Research, vol. 34, no. 10, pp. 2902 – 2917, 2007. [2] C. Kang and S. Pei-ji, “Customer churn prediction based on svm-rfe,” in Business and Information Management, 2008. ISBIM ’08. International Seminar on, vol. 1, pp. 306–309, Dec 2008. [3] B. Huang, M. T. Kechadi, and B. Buckley, “Customer churn prediction in telecommunications,” Expert Syst. Appl., vol. 39, pp. 1414–1425, Jan. 2012. [4] M. Owczarczuk, “Churn models for prepaid customers in the cellular telecommunication industry using large data marts,” Expert Systems with Applications, vol. 37, no. 6, pp. 4710 – 4712, 2010. [5] G. Li and X. Deng, “Customer churn prediction of china telecom based on cluster analysis and decision tree algorithm,” in Emerging Research in Artificial Intelligence and Computational Intelligence (J. Lei, F. Wang, H. Deng, and D. Miao, eds.), Communications in Computer and Information Science, pp. 319–327, Springer Berlin Heidelberg, 2012. [6] C.-F. Tsai and Y.-H. Lu, “Customer churn prediction by hybrid neural networks,” Expert Syst. Appl., vol. 36, pp. 12547–12553, Dec. 2009. [7] A. Idris, A. Khan, and Y. S. Lee, “Genetic programming and adaboosting based churn prediction for telecom,” in Systems, Man, and Cybernetics (SMC), 2012 IEEE International Conference on, pp. 1328–1332, Oct 2012.
SVM Approach for Churn Prediction in Telecom Industry
3971
[8] V. Vapnik, The Nature of Statistical Learning Theory. Springer, New York, 1995. [9] J. Burez and D. Van den Poel, “Handling class imbalance in customer churn prediction,” Expert Syst. Appl., vol. 36, pp. 4626–4636, Apr. 2009. [10] C. Burges, “A tutorial on support vector machines for pattern recognition,” Data Mining and Knowledge Discovery, vol. 2(2), pp. 121–167, 1998. [11] W. C. Chan, K. C. Cheung, and C. J. Harris, “On the modelling of nonlinear dynamic system using support vector neural networks,” Engineering Applications of Artificial Intelligence, vol. 14, pp. 105–113, 2001. [12] G. Q. Zhu, S. R. Liu, and J. S. Yu, “Support vector machine and its applications to function approximation,” Journal of East China University of Science and Technology, vol. 5, pp. 555–559, 2002. [13] K. Muller, A. Smola, G. Ratsch, B. Scholkopf, J. kohlmorgen, and V. Vapnik, “Predicting rime series with support vector machines,” in In the Proceedings of the 7th International Conference on Artificial Neural Networks, ICANN’97, Lausanne, Switz, pp.999-1004, 1997. [14] N. Cristianini and J. Shawe-Taylor, “An introduction to support vector machines and other kernel-base learning methods,” Cambridge University Press, Cambridge, UK, 2000. [15] V. Vapnik, “An overview of statistical learning theory,” IEEE Transactions on Neural Networks, vol. 5, pp. 988–999, 1999. [16] W. J. Wang, Z. B. Xu, and W. Z. Lu, “Determination of the spread parameter in the gaussian kernel for classification and regression,” Neurocomputing, vol. 55:, pp. 643–663, 2003.
*Corresponding author: Ali Rodan, PhD. Department of Business Information Technology, King Abdulla II School for Information Technology, The University of Jordan, Amman 11942, Jordan E-mail:
[email protected]