A Survey on Visual Query Systems in the Web Era (extended version) ⋆
arXiv:1708.00192v1 [cs.DB] 1 Aug 2017
Jorge Lloret-Gazo Dpto. de Inform´ atica e Ingenier´ıa de Sistemas. Facultad de Ciencias. Edificio de Matem´ aticas. Universidad de Zaragoza. 50009 Zaragoza. Spain.
[email protected]
Abstract. As more and more collections of data are becoming available on the web to everyone, non expert users demand easy ways to retrieve data from these collections. One solution is the so called Visual Query Systems (VQS) where queries are represented visually and users do not have to understand query languages such as SQL or XQuery. In 1996, a paper by Catarci reviewed the Visual Query Systems available until that year. In this paper, we review VQSs from 1997 until now and try to determine whether they have been the solution for non expert users. The short answer is no because very few systems have in fact been used in real environments or as commercial tools. We have also gathered basic features of VQSs such as the visual representation adopted to present the reality of interest or the visual representation adopted to express queries.
1
Introduction
In recent years, and mainly because of the arrival of the web, more and more collections of data are becoming available to everyone in fields ranging from biology to economy or geography. One of the consequences of this fact is that end users, but not experts in Computer Science, demand easy ways to retrieve data from these collections. Beginning in 1975 with Query By Example (QBE) [40] there have been many proposals in this direction, that is, to facilitate the work of the final user. In [9], the authors reviewed the so-called Visual Query Systems (VQS) from 1975 to 1996 defined as “systems for querying databases that use a visual representation to depict the domain of interest and express related requests”. In this paper, we extend the review from 1997 to date, concentrating our efforts on visual queries to structured information, for example, queries to underlying relational or XML databases. We do not consider the typical search on semistructured documents such as web pages through search engines like Google. ⋆
The author would like to thank Rafael Bello for making the initial collection of papers for this review.
Although they are also a good solution for end-users, in this survey we do not take into account natural language interfaces for database query formulation. The main goal of this survey is to answer the following question: to what extent have the VQS been the solution for novel users for querying databases? To answer this question, we have studied two features: web availability of and validatioin undergone by the systems. The first feature indicates that the system was designed to be reached easily by novel users simply by means of a web browser, without the burden of installation and with universal availability. The second feature indicates the widespread use of VQSs in practice. Thus, the more systems commercially available, the greater the extension reached by VQSs. The short answer to the question is that, as far as we know, there is only one system commercially available and designed for the web: Polaris [35]. Moreover, we have included two basic features extracted from the paper [9]: the visual representation adopted to present the reality of interest and the visual representation adopted to express queries. With respect to web features, we have also considered relevant whether the prototype deals with data formatted for the web, that is, XML data or RDF data. The rest of the paper is organized as follows. In Section 2 we state the method followed for elaborating the survey and we briefly describe the values of the relevant features included in the paper. In Section 3, we have made a systematic review of the selected features for each paper of the survey. Finally, in Section 4, we have drawn several conclusions about the VQSs.
2
Statement of the method
A survey about a particular object must determine the relevant features of the object with respect to a particular purpose. Once the features have been determined, the next step is to find the possible values of these features. Finally, we have to determine the best combinations of the pairs (feature, value) for the particular purpose. Usually, we can extract the relevant features and their possible values from published papers about the object, by assuming features in their entirety or by adapting them to new perspectives appearing after the papers have been published. Moreover, we can add features detected by ourselves which were not previously included in any paper. The survey develops through several steps, which are usually interspersed. In the first step, a complete search of sources determines the candidate papers that deal with the object. In the second step, the relevant features of the object with respect to the particular purpose are determined. Our object in this survey are the visual query systems with the purpose of facilitating querying databases to non expert in Computer Science users. The survey [9] reviews up to 80 references from 1975 until 1996 used for querying traditional databases. For this survey, we have searched for papers related with VQS from 1997 to date and we have found 194 candidate papers.
Next, we have discarded papers about query languages but without visual part (122) and papers about natural language query languages(8) because they deserve a separate survey. In the remaining 64 works, we have determined sets of ‘similar papers’ and we have discarded all but one paper in each set. A set of similar papers is composed of several papers built on different aspects of the same idea for a VQS. They also include preliminary versions of the VQS which were later on subsumed by more complete journal publications. We have found 30 similar papers. So, we have discarded 122 + 8 + 30 papers, that is, 160 papers. As a result, the number of papers reviewed in this survey is 34. In Table 1 we summarise all these figures. Table 1. Summary of paper figures
Candidate papers excluded because they do not include a visual part excluded because they deal with natural language query excluded becacuse they come from sets of similar papers Total papers included in the survey:
Number 194 -122 -8 -30 34
As for relevant features, we have extracted the following from the survey of Catarci [9]: 1. Visual representation adopted to present the reality of interest 2. Visual representation adopted to express queries The values of this feature have been determined from the work [9] and from other papers, such as [12], where the faceted option appeared. For answering the question of this paper, we have added the following features 1. Web orientation 2. Validation Let us explain briefly each of the features as well as their values. 2.1
Visual representation adopted to present the reality of interest
This feature has been borrowed from the work of Catarci [9]. The reality of interest is modeled by a designer by means of a data metamodel as, for example, the entity/relationship metamodel or a graph data metamodel. As a result of the modelization process, a data model is obtained and it is presented to the user so that (s)he formulates queries on it. The ways the data model is presented to the user are: – Diagram-based – Icon-based
– Form-based – Faceted – Unknown The category in which each selected paper falls as well as a more detailed explanation of some of the papers are given in Section 3. Diagram-based Data metamodels come with an associated typical representation for their elements. For example, in the entity/relationship metamodel, there are many representations available and one of them consists of drawing rectangles for the entity types, diamonds for the relationship types and ovals for the attributes. In the diagram-based option, the user has available a diagrammatical representation of the data model elaborated with the typical graphical representation for the elements of the metamodel. Icon-based Unlike the diagram-based approach, in this representation there are only iconic representations of some elements of the data model, but the user does not have available the complete data model. According to Catarci [9], ‘these VQS are mainly addressed to users who are not familiar with the concepts of data models and may find it difficult to interpret even an E-R diagram’. The aim of the icons is to represent a certain concept by means of its metaphorical power. The problem of these systems is how to construct them in such a way that they express a meaning which is understandable without ambiguity to the users. Form-based The typical forms of web pages serve for presenting the extensional database. This occurs in papers such as [35]. Faceted The data are modeled as faceted classifications which organize a set of items into multiple, independent taxonomies. Each classification is known as a facet and the collection of classification data is faceted metadata. The specific category labels within a facet are facet values. For example, the set of items can be architectural works. For these items, the facets are the architect, the location or the materials. The facet values for materials are stone, steel, etc Unknown As the data model always exists, this option refers to the case where the data model is unknown. For example, the data model may be presented in a paper in textual form but there is no explanation about the way it is presented to the user. For example, paper [27] hides the database and tries to guess the paths for the query from the entities chosen by the user.
2.2
Visual representation adopted to express the queries
This feature has been borrowed from the work of Catarci [9] and we have adapted it to the object of the survey by adding the Faceted value. The list of values is: – – – –
Diagram-based Icon-based Form-based Faceted Next, we describe briefly the values of this feature.
Diagram-based The diagram-based option means that the query is expressed on a diagrammatic representation of the data model. Icon-based The icon-based option includes two cases. In the first case, the system offers icons for representing the elements involved in the query. For building a query, the user drags and drops the appropriate icons into a canvas. The second case is the same as in [9], where the icons ‘denote both the entities of the real world and the available functions of the system’. Form-based Another way to facilitate the query is the form option where the user composes the query by completing options of different elements of a form. The drawback is that the query logic of the end-user does not always fit into a form. Faceted We have added as a new value ‘Faceted’ for describing a system which includes data and metadata in the same page. There, the user specifies the query by clicking on the appropriate links. We have found this situation only in one paper [12]. 2.3
Web orientation
For the web orientation, we have selected two features which are not mutually orthogonal. The first feature is whether the prototype is working on the web or has been conceived to be used in local mode. For the first situation, the value is Available on the web and this means that the final user can query the database by means of a prototype which is working on the web. The two values are: – There is no web orientation – Available on the web The second feature indicates whether the user can query data formatted for the web and the values are:
– Data not formatted for the web – Query XML data – Query RDF data The values are not orthogonal. So, a paper can have the two values. This is the case, for example, of paper [8]. 2.4
Validation
The validation of an idea can be done from several points of view. Regarding query systems, there are, at least, two dimensions: usability and performance. For example, paper [11] focuses on performance and explains query rewriting techniques that improve the query evaluation performance so that the query exection time is reduced. However, in this paper we concentrate on the usability dimension, that is, the experiments made with users in order to determine the ease of use of the proposed prototype. For this feature, the list of values is: – – – –
Only prototype Prototype tested with users Prototype tested in a real environment Commercial tool
Next, we describe briefly each value of this feature. The option only prototype means that a prototype has been built but no test has been made with users. The value prototype tested with users means that several experiments have been carried out in order to determine the usability of the prototype. The value prototype tested in a real environment means that it has been used for real tasks in a particular setting, for example in a department of a university. Finally, the option commercial tool means that the VQS has been fully implemented, offered to the public and is in real use in diverse installations. 2.5
Other features
We were initially also interested in the expressive power of the query languages of the revised papers. Here, the difficulty is that many papers do not offer the complete specification and only deal with query examples. For this reason, we had to discard this feature. As a consequence, we also had to give up to offer in this review the same queries for all the visual query systems because with the explanation of the papers we were not able to specify the queries in all the visual query systems.
3
Systematic review
In this Section, for each feature, we include comments only about a portion of the papers gathered in Table 2 and in Table 3. The reason is that we only comment on papers of special relevance with regard to the intended feature. For the rest of the papers, only the value of the feature in Table 2 and Table 3 is available.
Table 2. Visual Query Systems(1997-2003) Cite [3] [32] [6] [10] [21] [33] [25] [4] [13]
Database Query Unknown Icon Unknown Form Diagram Diagram Diagram Diagram Diagram Diagram Diagram Diagram Icon Icon Diagram Diagram Unknown Form
Web No No No No No No No No Query data [14] Icon Icon Available the web [29] Diagram Diagram No [34] Icon Icon No [28] Diagram Form Query data [26] Icon Icon No [24] Unknown Icon No [5] Unknown Icon Query data [27] Form Form No [1,15] Unknown Form Query data
Validation Only prototype Tested with users Only prototype Tested with users Only prototype Only prototype Only prototype Tested with users XML No on Tested with users Only prototype Tested with users XML Only prototype Tested with users Only prototype XML Only prototype Tested with users XML Only prototype
Table 3. Visual Query Systems(2004-2014) Cite Database Query [8] Diagram Icon
Diagram
Web Available on the web; Query XML data Query XML data Query RDF data No Query XML data No Query XML data Available on the web Available on the web Query RDF data No Available on the web No No No Query XML data
Validation Only prototype
[23]
Diagram
Tested with users
[16]
Unknown Icon
[30] [17]
Diagram Diagram Unknown Form
[37] [31]
Unknown Form Diagram Icon
[35]
Form
Form
[12]
Diagram
Faceted
[18]
Unknown Diagram
[38] [7]
Diagram Diagram
Icon Diagram
[19] [36] [39] [11]
Unknown Diagram Unknown Diagram
Diagram Icon Icon Diagram
3.1
Visual representation adopted to present the reality of interest
No Tested in a real environment Tested in a real environment Tested in a real environment Only prototype Commercial tool Only prototype Only prototype No Tested with users Tested with users Tested with users No Only prototype
In column 2 of Table 2 and Table 3, we summarise the options of the VQSs for specifying the database. Diagram-based The queries in the Conquer-II query language [6] are written in a conceptual schema based on the ORM conceptual modeling approach. In ORM, the world is modelled in terms of objects and roles and the notion of attribute is not used. Paper [10] deals with heterogeneous databases. It provides a formally defined and semantically rich data model, the Graph Model. A conceptually single database, the Graph Model Database, is built for the different heterogeneous databases and the user formulates his/her queries against this model. Paper [21] adopts the EER model to present the reality of interest. It presents the MiTRA system, composed of several modules. One of them, the Schema Visualization System, extracts database schema information and presents the
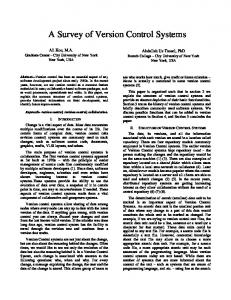
visual structure on the user’s screen in the form of an EER schema in the schema visualisation window, which is always available. Paper [33] proposes the EPISQUE interface, where the epistemic diagrams represents the real world in terms of entities, events and states. It has the idea that ER diagrams do not provide enough information so that people outside the organization can form SQL queries against the database. So, the E/R diagrams are extended to epistemic diagrams. In [4], the model of the real world is called vision. A vision is composed of visual concepts and associations between them and is a clear representation of a relational database. Several visions may be built on the same database, to deal with different kinds of users. An example of a vision can be seen in Figure 1. It is a combination of the diagram and of the icon approaches.
Fig. 1. A fragment of a vision in VISIONARY.
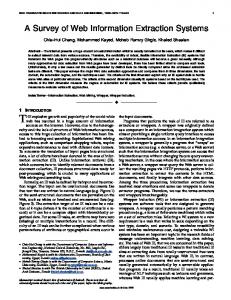
The data model in Hyperlog of [29] is called the Hypernode Model. The schema of the database is a set of hypernode types, which may be recursively defined. An example of schema in Hyperlog can be seen in Figure 2. Paper [8] presents XQBE, a tool for querying XML data. The XML schema or DTD specification is offered to the user as a starting point for specifying queries in a navigational way. In paper [23] the XML structure is visualized as a GUI tree on the left part of the SchemaBrowser. There, nodes can be activated and can serve as a basis for automatically generating a query tree. An example of a library schema is shown in Figure 3. In paper [30] the data model consists of classes and their attributes as well as associations between classes. In the interface, there are three canvases and
Fig. 2. A fragment of a schema in Hyperlog.
Fig. 3. Schema in X 2
the application model is displayed in the model canvas. The user can browse the data model to find the right concepts for the query. In [31], an interface for ordered XQuery, called IFOX, is described. In this approach, the schema is visually presented as a tree, where the elements, the attributes and the terminal elements are clearly distinguished. The XML schema is specified by the user or is built by a schema constructor. In paper [38], the database schema is specified as a unified conceptual graph. For example, the student table is represented as in Figure 4.
Fig. 4. A fragment of a schema in CGBDI.
In [7], queries are expressed on data warehouse schemas composed of tables. A typical schema consists of a fact table and several dimension tables related with the fact table. This type of structure is commonly known as a star schema. Paper [36] presents VMQL, a language for querying models used in large scale model based development. VMQL uses the respective modeling language of the source model as the query language. So, if the source model is written in UML, the queries are also written using UML. In Figure 5, we can see an example for data, in this case, a UML class diagram. Paper [11] offers an interface divided into two parts. In the left part, a diagram of an XML document is shown to represent source XML documents, lets users explore the documents, and selects parts of the documents to be used in queries.
Icon-based Paper [25] shows classes and extents. For a class, the only visible information is its icon and its name. In [26] the queries are built on the relational model. Queries are built on the Vis table, which is a logical view of a relation in the database and may be a join of more than one physical table. The attributes of this table are available as icons in the interface for building the iconic queries. Paper [34] presents a Temporal Visual Query Environment(TVQE) for historical databases. In this environment, the data model is called Temporal Graph Model(TGM) and has a set of Temporal Graphical Primitives(TGPs). The schema includes classes, attributes, relationships between classes, temporal classes, temporal attributes and temporal relationships. The database schema adopts an iconic representation which exploits a graphical notebook metaphor.
Fig. 5. A fragment of data in VMQL.
Form-based Paper [35] presents the schema in a form-based manner. The user drags the fields of a query into shelves. Polaris interacts with multidimensional relational databases in the form of spreadsheets or available inside the DBMS. Faceted In paper [12], the data are modeled as faceted classifications which organizes a set of items into multiple, independent taxonomies. Each classification is known as facet and the collection of classification data is faceted metadata. The specific category labels within a facet are facet values. For example, the set of items can be architectural works. For these items, the facets are the architect, the location or the materials. The facet values for materials are stone, steel, etc. Unknown The VISUAL system of [3] is a query language intended for handling scientific experiment data. It offers a textual representation of the object-oriented data model on which the query system is built. The data model includes classes as Frame or Particle. In paper [27], the schema is not directly presented to the user. Basically, the user specifies the beginning and the end of the query and CQL uses built-in metaknowledge about the application schema to find the complete path. For expert users, the interface has the option of seeing the complete database application diagram. This is a semantically constrained entity-relationship diagram which includes entity types and associations among themselves. Paper [17] proposes the MiMi system, a deep integration of several protein interaction databases. The entire dataset and metadata were stored in Timber, a native XML database but it is not clear how the schema is made available to the users.
Paper [16] deals with web query languages but does not offer a schema since semistructured data typically comes without a fixed schema. 3.2
Visual representation adopted to express the queries
In column 3 of Table 2 and Table 3, we summarise the options of the VQSs for formulating the query. Diagram-based Conquer-II queries [6] are mapped into SQL queries for execution in commercial DBMS. The queries are shown in textual form as a tree of predicates connecting objects. For example, a query like ‘each academic as well as their degrees (if any) that are worth more than a 5 rating’ is expressed as shown in Figure 6.
Fig. 6. Example of query in Conquer-II.
The user specifies a query by dragging to the query pane an object type from an object pick list. Then, another pane displays the roles played by that object and the user selects the appropriate ones. In this way, users specify queries without knowing the underlying structure. For specifying queries in the Graph Database Model of [10], two graphical primitive are defined: selection of nodes and drawing of edge. The primitives are used to express any query-oriented interaction with the database. For example, the query ‘retrieve the names of all the students whose age is greater than 21 and living in NY’ is expressed graphically as shown in Figure 7.
Fig. 7. Example of query formulation for heterogeneous databases.
The queries in MiTRA [21] are expressed on an EER schema. For doing so, the Graphical Query System allows users to manipulate the EER schema. It presents the available graphical query operators to the user, allowing the formulation of queries involving selection, projection, join and recursion. For example, the query ‘Find the names of all students taught by R. SMITH.’ is specified as shown in Figure 8.
Fig. 8. Example of query formulation in the MiTRA system.
In EPISQUE [33], the user creates queries in several steps. First, (s)he places restriction, projection and join on epistemic diagrams. Next, they are converted into SQL expressions and finally they are sent to the targeted db for processing. For the specification of queries in VISIONARY of [4], the notion of viewpoint is used. The expressive power of VISIONARY is limited to restricted join queries enriched with aggregation functions. The visual queries are translated into SQL and then to the DBMS. Basically, a viewpoint is a primary concept of the vision together with several associations starting from the primary concept. The formulation of a query consists of the following steps: (1) choose a primary concept, (2) edit the viewpoint, (3) choose attributes to be retrieved, (4) formulate selections on attributes and (5) order and/or group the results. Paper [29] presents Hyperlog, a declarative, graph-based language that supports database querying. A Hyperlog query consists of a number of graphs which are matched against the hypernodes in the database and which generate graphical output. The query ‘suppliers who do not supply Widge2’ is specified in Hyperlog as in Figure 9.
Fig. 9. Query in Hyperlog
Hyperlog admits the negation, conjunction, and disjunction of queries. Builtin functions and relational operators can be visualized as hypernodes, and intentional information can be derived by encapsulating programs within templates. In X2 [23], the user selects nodes of interest in the XML diagram and the system automatically generates query trees from the nodes selected. An example can be seen in Figure 10 where the query ‘I would like to see interesting recent papers on XML written by Sally Sonntag’ is shown.
Fig. 10. Query in X 2
In SEEQ [30] queries are depicted in the query canvas. They can contain operators, constants and sub-queries. For example, the query ‘find the students whose last name begins with ‘B’ and who have more than 60 credits’ is depicted in Figure 11. Paper [18] proposes a query-by-diagram language called MashQL. With this language, people query the web by building data mashups diagramatically. The paper assumes that web data sources are represented in RDF, and SPARQL is the query language to which the graphical mashup is translated. The novelty of MashQL is that it allows querying a data source without any prior understanding of the schema or the structure of the source. The specification of mashups is as follows: After a user selects the dataset in the RDF input module, the user selects the query subject in a drop-down list generated from the dataset. To add a restriction on the chosen object, a list of possible properties is dynamically generated. For the selected properties, user may then choose an object filter. The query ‘retrieve Hackers articles published after 2000 from two web locations’ expressed with MashQL is shown in Figure 12. VISQUE [7] presents as a main feature the possibility of new queries such as union, intersection, in and not in, not covered in other papers but there are also
Fig. 11. Query in SEEQ
Fig. 12. Example of query formulation in MashQL.
other complex query operations not covered in the paper. I have not found any specific example in this paper. GBLENDER [19] proposes the problem of finding those graphs of a graph database which contains a query graph. The user formulates a query by clickingand-dragging items on the query canvas. In Figure 13 we can see the formulation of a query but the paper does not offer the corresponding textual version.
Fig. 13. Example of query formulation in GBlender.
VXQ [11] offers an interface divided into two parts. In the right part, the user composes queries by exploring the diagram of the XML document displayed on the left pane of the prototype. For example, the query ‘create a flat list of all title-author pairs with the year of publication for all books published by AddisonWesley after 1991, and present these books in reverse chronological order by years and then in alphabetical order by titles for each year’ is specified as can be seen in Figure 14. Icon-based In the VISUAL system of [3], queries are implemented as objects and interact with each other for query processing. An example of a query is ‘find the particles each of which has a size equal to 3 microns and resides in the set of frames named StressFractureFrames’ (see its graphical representation in
Fig. 14. Example of query formulation in VXQ.
Figure 15). The VISUAL queries are mapped into ‘select from where’ queries in OQL.
Fig. 15. Example of query in VISUAL.
Paper [25] presents the graphical query language Kaleidoquery, whose target language is OQL. Both languages have the same expressive power. The queries follow the filter flow model. The input are class instances and their information is filtered by constraints placed on the attributes of the class. For example, Figure 16(a) represents the query ‘find the people whose age is less than 20 and whose name is Smith’. The instances from the input extent flow through the query and are filtered through the two constraints. The query ‘find the name of the companies which have at least one employee who earns more than 25000 euros and is older than 60’ is represented in Figure 16(b). The Delaunay query language interface [14] supports standard SQL clauses including select, from and where. The queries are specified on a class and the way of working is that the user arranges graphical objects that specify how to visualize objects of the class. The complete specification of a visual query is called DOODLE program. In Figure 17, we can see a DOODLE program which specifies a bar chart visualization.
Fig. 16. Example of query formulation with join in Kaleidoquery.
Fig. 17. Example of query formulation in Delaunay
In paper [34], the queries are specified on the notebook, which visualizes schemas. The approach is hybrid because it is a combination of diagrammatic and iconic representation. The query condition is specified by means of dialog boxes, which contain menus, spin boxes and sliders for specifying temporal constants, predicates on time instants or predicates on time periods. For example, the query ‘which salaries did the employees earn when they changed their level for the last time’ is represented in this system as in Figure 18, where we can see several selected and displayed nodes in the query. Paper [24] concentrates on specifying queries for Geographical Information Systems. Query diagrams are constructed using filters, represented by icons, between data input and output elements. The filter indicates the type of constraint expressed. Two types of join operations are possible: nonspatial joins and spatial joins, the latter are expressions of spatial relationships between spatial objects. In Figure 19 we can see the query ‘find all the motorway roads that cross counties with population more than 50000’ In paper [26], the SQL sentences include only SELECT, FROM, WHERE and ORDER BY clauses. Queries are specified in a Query Assembly Frame, which consists of two subframes: the Query Header Frame (QHF) and the Selection/ Search Criteria Frame (SCF). The QHF accommodates the SELECT verb and its attributes as a composite icon. The SCF receives and accommodates sequences of icons representing the Selection/Search criteria. For example
Fig. 18. Example of visual query in TVQE.
Fig. 19. Example of query formulation in a GIS.
the query ‘find the name, age and monthly salary of employees whose age is less than a particular value and has a particular skill. Order the result by age’ is expressed as in Figure 20.
Fig. 20. Example of query formulation in Iconic SQL
The language visXcerpt [5] uses a pattern-based approach to query XML data. It is well suited for visual language because the patterns are two dimensional structures that conceptually are very close to two dimensional visual representations. An example of a query in visXcerpt is ‘select product elements having an origin with vendor attribute Sanchez or origin with vendor attribute DeRuiter’. Its graphical representation can be seen in Figure 21.
Fig. 21. Example of query formulation in visXcerpt
Paper [8] presents the XQBE visual query language for expressing a large set of XQuery in a visual form. The schema-driven editing mode allows the user to build a query by means of a construction guided by available XML schema or DTD specifications. The user draws the queries by choosing the graphical constructs from the toolbar. For example, the XQBE query ‘list books published by Addison-Wesley after 1991, including their year and title’ can be seen in Figure 22.
Fig. 22. Example of visual Xquery in XQBE.
The paper [16] deals with the graphical representation of queries over semistructured data on the web represented as RDF, a W3C standard. They define a facet, which can be seen as a filter condition over an RDF graph and offer a graphical representation of it. For example, in Figure 23 we can see the query ‘get resources that Andreas Harth knows’
Fig. 23. Query on RDF data
In [31], an interface for ordered XQuery, called IFOX, is presented. The queries are represented as trees where the leaves are XSource operators, the internal nodes are XOperators such as XJoin or XUnion and the root node is the XOperator XConstruct. For example, the query ‘For each book found in http://localhost/bib.xml whose price is below 70 and where the book is also found in http://localhost/review.xml, list the title of the book and its price from each source’ is expressed in IFOX as shown in Figure 24. The query includes the operators XSource, Xjoin, XRestrict and XConstruct. In CGBDI [38], the queries are specified also as a simple conceptual graph. For example, the query ‘select for every student group, the average of student‘s cgpa, if the average is greater than or equal to 8.5’ is represented as in Figure 25 Queries in VMQL [36] are drawn by using a palette of icons which offers the icons of the source metamodel. So, there appears icons like Class, Package or Generalization. The query can be seen in Figure 26. In GMQL [39], queries attempt to find information from multimedia databases. They have chosen a reduced but meaningful set of symbols to express queries. An example can be seen in Figure 27 where, the movies satisfying that: (1) the poster of each one of these movies contains three inner image objects: two
Fig. 24. A query with join in IFOX
Fig. 25. A query in CGBDI.
Fig. 26. A query in VMQL.
‘HORSE’ and one ‘SUN’; or (2) the poster of each one of these movies contains two inner image objects: one ‘PERSON’ and one ‘DOG’ are found.
Fig. 27. A query in GMQL.
Form-based Paper [32] generalizes QBE for databases containing complex structured data. A QBT interface displays a template and the user issues a query by entering ex- amples of what (s)he is searching for in the template. In [13] the Equix system is presented. A query form is created in HTML from the DTD of the underlying database. Intuitively, the user creates an example of the document (s)he is searching for. Paper [28] presents QURSED which is a visual query system generator rather than only a visual query system. The Editor takes as input an XML Schema and generates an interface for the development of web-based query forms and reports (QFRs). An example can be seen in Figure 28. FoXQ [1], based on [15], presents a system that helps users build queries on XML documents incrementally by navigating through layers of forms. Next, the queries are translated into XQuery. For example, the query ‘return a list of all the titles in a bibliography database’ is expressed as in Figure 29. With the aid of users, in paper [27] a form-based interface for querying databases was developed (see Figure 30). This interface followed well-established guidelines on the design of human interfaces. It has four clearly distinguished zones: targets or information you want to know, sources or information you have available, semantic relationships and select conditions. Paper [17] proposes up to five interfaces to query the MiMI system. One of them is the forms interface, from which the authors discuss the pros and cons. The main pro is that it does not require knowledge of query language for novice users. The main con is that the limited number of queries available in the interface might ‘dissatisfy many users’. Paper [37] presents the GUi As View (Guava) framework for generating query interfaces from user interfaces for domain experts with little technical skills to understand query data. The rationale behind this is as follows: The interface
Fig. 28. Query interface in QURSED.
Fig. 29. Query interface in FoXQ.
Fig. 30. Query interface in CQL.
for data capturing is typically designes to be easy to use by domain experts. However, if they want to query data, there are two options: (a) have someone write a special query interface or (b) use SQL to express queries against the database schema. The proposal of the paper is to follow option (a) but the query interface is generated automatically from the user interface by the Guava framework. The approach of Guava is equivalent in expressive power to singlestatement conjunctive queries where joins are restricted to foreign keys and selection can use any of the six comparators to relate a column against a constant, but not a column against another column. In Polaris [35], the user specifies a query by means of a table, which consists of a number of rows, columns, and layers. In the rows and columns of the table, the user specifies fields of the database as well as data aggregations. Each table entry, or pane, contains a set of records, built from these data, that are visually encoded as a set of marks to create a graphic. For example, a query for showing sales versus profit for different product types in different quarters can be seen in Figure 31. The user has specifed in the vertical axis the product type and the total of sales for the product. In the horizontal axis, the user has specified the quarter and the total profit of the sales.
Fig. 31. Query interface in Polaris.
Faceted Paper [12] presents faceted user interfaces, which operate on faceted metadata by letting users select one or more values from any number of facets. The advantage for users is that the user interface can present only valid selections, but this simplification also has drawbacks: the expressivity is sacrificed by only allowing certain classes of queries, for example, only conjunctive conditions. An example of a faceted interface is Flamenco (see Figure 32) where the items are Nobel Prizes.
Fig. 32. Faceted interface Flamenco.
3.3
Web orientation
In column 4 of Table 2 and of Table 3, we summarise the orientation to the web of the VQSs. Regarding the data format, there are 9 papers [13,28,5,1,8,23,17,?,11] out of 34 which query XML data and only two papers which query RDF data [16,18]. The rest of the papers do not query web data. The papers were available on the web [14,8,35,12,7] Delaunay [14] offers a prototype implemented in Java and is available on the www. XQBE [8] XQBE is fully implemented in a tool environment published on the Web and the implementation is based on a client-server architecture. The POLARIS system [35] has been adapted to the web, so it is possible to perform analysis within a browser. With the idea of the faceted interface, paper [12] points out that several prototypes are available on the web, for example, the prototype Flamenco from the University of Berkeley. In [7], the VISQUE system is presented. This is based on a client-server architecture that includes a front-end which is a web-based authoring tool that allows users to visually interact with data elements and compose queries by example.
3.4
Validation
In column 5 of Table 2 and of Table 3, we summarise the validation method of the VQSs.
Only prototype There is a prototype of VISUAL [3] which implements a mapping from VISUAL to OQL. The paper claims that it has been designed with efficiency and ease of use. Paper [6] presents a query engine for Conquer-II written in C++. It consists of about 25000 lines of code and 83000 lines shared with InfoModeler. Paper [21] has implemented a prototype where the user can select between OMT, EER and a tabular representation for displaying schemas. On top of this, the query prototype is capable of handling select/project/join queries. Paper [29] implements an architecture of Hyperlog, which consists of several interconnected modules. The user interacts with the editor for expressing queries. Ifox [31] offers a prototype with five areas(see Figure 24): input visualization, query visualization, output visualization, operator selection and operator specification. The first area show the XML schema, the second is used for graphically specifying the query. The third shows the result of the query. The last two are about the Xoperators of the queries.
Prototype tested with users Paper [32] presents QBT and was tested with novice and experienced users. The results show that QBT is significantly more satisfying to the users than traditional form-based approaches. Paper [10] offers a multiparadigm interface ‘where various equivalent user interfaces can be defined on the basis of the same formalisms, and different databases can be dealt with in a uniform way’. They state that this interface was being tested with real users but they do not offer any result of this testing. The VISIONARY system [4] offers a section of comparison experiments with QBD* [2] and QBI [22]. As a conclusion, VISIONARY is slightly better than QBD* and much better than QBI. Paper [24] implements a prototype with the DELPHI system. Evaluation is underway with two categories of users: with experience and without experience in GIS. Iconic SQL [26] offers a fully functional and working implementation developed under Linux on a Pentium PC. They performed an evaluation to see how the context influences identification and association. For this purpose, they set people a task and asked them to pick out relevant icons. In some cases, the user did not guess correctly the icons but the more the context develops in a session, the fewer details are needed in an icon for identification purposes. The initial interface of TVQE [34] was improved based on the suggestions of users who had participated in a preliminary experiment with the TVQE prototype, giving place to the version described in the paper. The prototype was implemented in Java using JDBC as interface to the DBMS. The development of CQL [27] adopted a user-centered approach in that it ‘involves participants who are representative of the intended class of end-users in the interface development process’. The first step was the elaboration of a mock-up with the purpose of eliciting comments from end-users. These comments led to a second version of the interface. The two interfaces were implemented as prototypes and were compared. The conclusions are that end-users perform better with the second prototype and they take lesss time to formulate queries with the first prototype. Taking these results into account, they prepared the final production interface shown in Figure 30. In [7], the authors issued a study for obtaining users’ satisfaction related to the ease of use of VISQUE, which reflects that the tool is easy to use and that casual users may need some initial help with the tool. The study was done with 12 real users having domain knowledge about database systems but not about SQL. The idea of Gblender [19] was tested with three users and was centered on the response time rather than on the usability. With respect to the response time, GBlender outperforms other state-of-the-art graph proposals. The VMQL system [36] has been tested with several users in order to establish the degree of usability as compared to OCL and the logical query facility. The results show better results for all tasks done by VMQL than done by OCL. The tasks were reading queries or writing queries.
Tested in a real environment Paper [37] has been validated by the use of CORI analysts. CORI seeks to improve the practice of endoscopy by conducting studies on patient data. They distribute a software with which the clinician enters data that describes endoscopic procedures. From this data, the analysts elaborate reports for use by physicians. The Guava framework helps in extracting the data from the database. Paper [30] proposes the SEEQ system, which is utilized in the student information system of the university of the authors. The tool is implemented in Java, uses the Swing GUI toolkit and the connexion to the database is by means of JDBC. The MiMi system [17] proposes up to five interfaces and has tested them with biologists. They draw many interesting conclusions. For example, that “when users are presented with multiple ways to access the information but do not understand the underlying differences between the views, they tend to become confused and lose trust in the system”. Moreover, they have identified the problems non-expert users have with the interfaces. Some of the problems are painful relations, painful options or unexpected pain. Commercial tool The POLARIS system of [35] has been widely tested because it has been commercialized by Tableau Software as Tableau Desktop and is currently in use by thousands of companies and tens of thousands of users. With all this experience, they have validated the effectiveness of their proposal.
4
Discussion
The arrival of the web brought with it more facilities for users to query databases. As a consequence, users expect to access easily through the web databases situated anywhere in the world. For expert users, one solution is to express queries in query languages such as SQL or XQuery. However, for novice users whose main concern is to extract data from the database but not the query languages themselves, learning SQL or XQuery is a huge task that is very far from their main concern. One solution for novice users is to hide the complexity of query languages behind a visual scenary where it is supposed that the complexity is softened with the aid of visual metaphors. This is the idea of Visual Query Systems (VQS) defined in [9] as “systems for querying databases that use a visual representation to depict the domain of interest and express related requests”. In this paper, we have reviewed basic features of Visual Query Systems, such as the representation of databases and the representation of queries. We have also considered the feature of accessing data formatted for the web. Finally, we have reviewed two features we consider relevant to determine whether the VQSs ease querying for novel users: web availability and validation. Next, we discuss the results for each of these features. The majority of papers offer a diagrammatic representation of the database, only four papers an iconic one [3,14,34,26] and one paper with form representa-
tion [35]. For several reasons, there are many papers whose database representation is unknown. For example, paper [27] hides the database and tries to guess the paths for the query from the entities chosen by the user. With respect to the query representation, the distribution is more balanced between the icon(12 papers), the diagram(11 papers) and the form (8 papers) representation. A special form of query, the faceted one, appears only in one paper [12]. Regarding the data format, there are 9 papers [13,28,5,1,8,23,17,?,11] out of 34 which query XML data and only two papers which query RDF data [16,18]. The rest of the papers do not query web data. The rest of the features we have identified deal with the main question we have formulated in this paper, that is, to what extent have the VQS been the solution for novel users for querying databases? For answering this question with respect to the web availability, we can distinguish two periods. From 1997 to 2003 (see Table 2), when the web usage was beginning to spread, there was only one paper oriented to the web [14]. This was very understandable because of the time needed for reorienting the research into the new web setting. In the period 2004 to 2014, only papers [8,35,12,7] propose a web implementation (see Table 3). Although the number of web oriented papers in this period is greater than in the 1997-2003 period, the low number of papers indicates that web orientation has scarcely been taken into account. For the validation feature, we have found a great number of papers which have only a prototype or have been tested with users in reduced experiments. Only three prototypes have been tested in real environments [30,17,37] and we have found only one commercial tool [35]. So, few papers go beyond testing the prototype with a few users. As a conclusion of these two features, very few papers are web oriented and also very few papers offer a prototype which has been tested in a real environment. In fact, the combination of both features is only found in paper [35]. Then, although the visual query systems seem to be a great idea for easing the query process for novice users, the reality is that very few papers describe real implementations. So, the answer to the main question of the paper is that, for the moment, VQSs have not been a widely accepted solution for novel users. From this observation a new, more general question arises is there any solution for easing the specification of queries? If the answer is no, novel users have to learn by themselves query languages or they have to ask computer experts for the specification of queries. In the latter case, no new research would be needed in this field. If the answer is ‘we do not know’, then new research is required in order to find simple visual query languages which help novice users. We strongly believe that the idea of VQSs is a good one and that the research should continue in this direction. Recent papers such as [20] also support the idea that a solution for naive users is not available but is necessary in this world in which the use of databases is democratized. The paper proposes as a solution
visual systems in which the user writes examples of queries and the system extracts and specifies the desired query in the corresponding query language.
References 1. Robin Abraham. Foxq-xquery by forms. In Human Centric Computing Languages and Environments, 2003. Proceedings. 2003 IEEE Symposium on, pages 289–290. IEEE, 2003. 2. Michele Angelaccio, Tiziana Catarci, and Giuseppe Santucci. Qbd*: A graphical query language with recursion. pages 1150–1163, 1990. ¨ ¨ 3. Nevzat Hurkan Balkir, Eser S¨ ukan, Gultekin Ozsoyoglu, and Z. Meral Ozsoyoglu. Visual: A graphical icon-based query language. In Stanley Y. W. Su, editor, ICDE, pages 524–533. IEEE Computer Society, 1996. 4. Francesca Benzi, Dario Maio, and Stefano Rizzi. Visionary: a viewpoint-based visual language for querying relational databases. pages 117–145, 1999. 5. Sacha Berger, Fran¸cois Bry, Sebastian Schaffert, and Christoph Wieser. Xcerpt and visxcerpt: from pattern-based to visual querying of xml and semistructured data. In Proceedings of the 29th international conference on Very large data basesVolume 29, pages 1053–1056. VLDB Endowment, 2003. 6. Anthony C. Bloesch and Terry A. Halpin. Conceptual queries using conquer-ii. In ER, pages 113–126, 1997. 7. Clemente Rafael Borges and Jos´e Antonio Mac´ıas. Feasible database querying using a visual end-user approach. In Proceedings of the 2nd ACM SIGCHI symposium on Engineering interactive computing systems, pages 187–192. ACM, 2010. 8. Daniele Braga, Alessandro Campi, and Stefano Ceri. XQBE (xquery by example): A visual interface to the standard xml query language. ACM Trans. Database Syst., 30(2):398–443, 2005. 9. Tiziana Catarci, Maria Francesca Costabile, Stefano Levialdi, and Carlo Batini. Visual query systems for databases: A survey. pages 215–260, 1997. 10. Tiziana Catarci, Giuseppe Santucci, and John Cardiff. Graphical interaction with heterogeneous databases. pages 97–120, 1997. 11. Ryan H Choi and Raymond K Wong. Vxq: A visual query language for xml data. Information Systems Frontiers, pages 1–21, 2014. 12. Edward Clarkson, Shamkant B. Navathe, and James D. Foley. Generalized formal models for faceted user interfaces. In JCDL, pages 125–134, 2009. 13. Sara Cohen, Yaron Kanza, Yakov A Kogan, Werner Nutt, Yehoshua Sagiv, and Alexander Serebrenik. Equix easy querying in xml databases. In WebDB (Informal Proceedings), pages 43–48, 1999. 14. Isabel F. Cruz and Peter S. Leveille. As you like it: Personalized database visualization using a visual language. pages 525–549, 2001. 15. Martin Erwig. Xing: A visual xml query language. Journal of Visual Languages & Computing, 14(1):5–45, 2003. 16. Andreas Harth, Sebastian Ryszard Kruk, and Stefan Decker. Graphical representation of rdf queries. In WWW, pages 859–860, 2006. 17. H. V. Jagadish, Adriane Chapman, Aaron Elkiss, Magesh Jayapandian, Yunyao Li, Arnab Nandi, and Cong Yu. Making database systems usable. In SIGMOD Conference, pages 13–24, 2007. 18. Mustafa Jarrar and Marios D. Dikaiakos. Querying the data web: The mashql approach. pages 58–67, 2010.
19. Changjiu Jin, Sourav S Bhowmick, Xiaokui Xiao, James Cheng, and Byron Choi. Gblender: towards blending visual query formulation and query processing in graph databases. In Proceedings of the 2010 ACM SIGMOD International Conference on Management of data, pages 111–122. ACM, 2010. 20. Fei Li and HV Jagadish. Usability, databases, and hci. IEEE Data Eng. Bull., 35(3):37–45, 2012. 21. Ajith P. Madurapperuma, W. A. Gray, and N. J. Fiddian. A visual query interface for a customisable schema visualisation system. In IDEAS, pages 23–32, 1997. 22. A. Massari and P.K. Chrysanthis. Visual query of completely encapsulated objects. In Research Issues in Data Engineering, 1995: Distributed Object Management, Proceedings. RIDE-DOM ’95. Fifth International Workshop on, pages 18 –25, mar 1995. 23. Holger Meuss, Klaus U Schulz, Felix Weigel, Simone Leonardi, and Fran¸cois Bry. Visual exploration and retrieval of xml document collections with the generic system x2. International Journal on Digital Libraries, 5(1):3–17, 2005. 24. Andrew J Morris, Alia I. Abdelmoty, and Baher A. El-Geresy. A visual query language for large spatial databases. In Proceedings of the Working Conference on Advanced Visual Interfaces, AVI ’02, pages 359–360, New York, NY, USA, 2002. ACM. 25. Norman Murray, Norman W. Paton, and Carole A. Goble. Kaleidoquery: a visual query language for object databases. In AVI, pages 247–257, 1998. 26. A. Narayanan and T. Shaman. Iconic sql: Practical issues in the querying of databases through structured iconic expressions. pages 623–647, 2002. 27. Vesper Owei. Development of a conceptual query language: Adopting the usercentered methodology. Comput. J., 46(6):602–624, 2003. 28. Yannis Papakonstantinou, Michalis Petropoulos, and Vasilis Vassalos. Qursed: querying and reporting semistructured data. In Proceedings of the 2002 ACM SIGMOD international conference on Management of data, pages 192–203. ACM, 2002. 29. Alexandra Poulovassilis and Stefan G. Hild. Hyperlog: A graph-based system for database browsing, querying, and update. IEEE Trans. Knowl. Data Eng., 13(2):316–333, 2001. 30. Markku Rontu, Ari Korhonen, and Lauri Malmi. System for enhanced exploration and querying. In AVI, pages 508–511, 2006. 31. Virginie Sans and Dominique Laurent. Ifox: interface for ordered xquery an algebraic oriented tool for ordered xquery visualization. In SAC, pages 1252–1257, 2008. 32. Arijit Sengupta and Andrew Dillon. Query by templates: A generalized approach for visual query formulation for text dominated databases. In Digital Libraries, 1997. ADL’97. Proceedings., IEEE International Forum on Research and Technology Advances in, pages 36–47. IEEE, 1997. 33. Dong-Guk Shin, Wally Grajewski, and Lung-Yung Chu. An epistemological display query interface. In AVI, pages 286–288, 1998. 34. Snia Fernandes Silva, Tiziana Catarci, and Ulrich Schiel. Formalizing visual interaction with historical databases. pages 487–521, 2002. 35. Chris Stolte, Diane Tang, and Pat Hanrahan. Polaris: a system for query, analysis, and visualization of multidimensional databases. Communications of the ACM, 51(11):75–84, 2008. 36. Harald St¨ orrle. Vmql: A visual language for ad-hoc model querying. Journal of Visual Languages & Computing, 22(1):3–29, 2011.
37. James F. Terwilliger, Lois M. L. Delcambre, and Judith Logan. Querying through a user interface. pages 774–794, 2007. 38. Viorica Varga, Christian Sacarea, and Andrea Takacs. Conceptual graphs based representation and querying of databases. In Automation Quality and Testing Robotics (AQTR), 2010 IEEE International Conference on, volume 3, pages 1–6. IEEE, 2010. 39. Zongda Wu, Guandong Xu, Yanchun Zhang, Zhongsheng Cao, Guiling Li, and Zhiwen Hu. Gmql: A graphical multimedia query language. Knowledge-Based Systems, 26:135–143, 2012. 40. Mosh´e M Zloof. Query by example. In Proceedings of the May 19-22, 1975, national computer conference and exposition, pages 431–438. ACM, 1975.