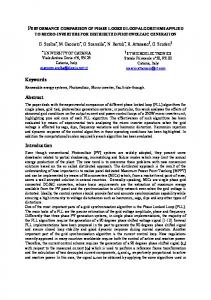
Figure B1: Site-resolved (colored lines) and mean (black lines) relative .... For all the 37 ARPA-Lazio monitoring sites and for all the dust-free dates within the ...
Appendix to the paper by Barnaba et al., Atm. Env., 2017 http://dx.doi.org/10.1016/j.atmosenv.2017.04.038
APPENDIX B: Reasons for modifying the time-window length used by the EC-Methodology As introduced in Section 2.3, in our application to Italy the time-window length (15 days preceding and following the dust date) prescribed by the EC-Methodology to evaluate the out-ofdust background PM10 was found to be problematic for three main reasons.
a) There are important meteorological variations over the 30-days period used in the ECMethodology to consider this as an effective ‘background period’ (and typical meteorology preceding/following dust events can be very different in the diverse European countries).
a)
b)
c) d) Figure B1: Site-resolved (colored lines) and mean (black lines) relative variations of the (out-of-dust) daily mean PM10 (B1a, B1c) and Pressure, p (B1b, B1d) with respect to the relevant mean values recorded during the dust events (reference point x = 0, y = 0, regardless of the dust events duration). A period of 30 days from the dust event (i.e., from the 15 days before, x = -15, up to 15 days after, x = +15, is considered). Top panels refer to one-year (2014) PM10 and p records in the Rome area (DIAPASON), and include the four ARPA-Lazio stations (see legend), these representing conditions ranging from rural background to urban. Bottom panels refer to the one-year (2005-2006) PATOS database, and include five sites in Tuscany.
Appendix to the paper by Barnaba et al., Atm. Env., 2017 http://dx.doi.org/10.1016/j.atmosenv.2017.04.038
In Figure B1 we show the relative variability of PM10 and ground-level atmospheric pressure, p (y axis) with respect to their corresponding mean values during the dust event (which are for convenience represented at point x = 0 and y = 0, regardless of the dust event duration). Values covering the 15 days period (x axis) from the dust events are reported. Pressure (p) is chosen as a standard meteorological variable, proxy of main meteorological variability. Each panel in Figure B1 summarizes results from a one-year-long dataset, the top ones referring to Latium sites (DIAPASON Project) and the bottom ones to Tuscany sites (PATOS Project). To better clarify the procedure followed: Figure B1 was derived considering each dust event recorded within a one-year-period, for each event computing the mean PM10 (or p) value ‘in dust’ (regardless of the event duration) and considering the relative variation (Δ) of each daily PM10 (or p) within the ‘out-of-dust’ period ranging from -15 days preceding the dust event (x < 0) to the +15 days following it (x > 0). The average of the so-derived event-resolved data is provided as a colored line, each color referring to a different site (only sites having simultaneous record of PM10 and meteorological data have been included). The black curve finally represents the average of the different sites (i.e., of the colored lines) included in the statistics. Overall, results in Figure B1 show that the PM10 regime greatly varies within the 30 days period considered in the EC-Methodology approach (Eq. 1, Section 2.2), with oscillations up to 10 g/m3. These variations are (at least partially) related to an important variability in the meteorological conditions (here exemplified by p), and clearly show the synoptic scale modulation (time-period of about 7 days). As further interesting elements, Figure B1: i) confirms that dust events correspond to a peak PM10 value (the same is obtained for temperature, not shown here); ii) reveals an increase in PM10 already in the days preceding the dust events, related to increasing pressure levels and thus pollutants trapping effects (Figure B1b, d); iii) shows that dust advections to central Italy mainly occur in transition conditions between high and low pressures (a condition different from the typical dust transport towards the Iberian Peninsula). This last aspect is also consistent with the notably lower PM10 values recorded in the days following the dust events, which in fact are often accompanied by precipitation and enhanced wind speed (e.g., Gobbi et al., 2013); iv) in the case of PM10, highlights a remarkable consistency between the behavior of sites located within a radius of 10 km, regardless of the site type (DIAPASON case, Figure B1a, b), while showing an increased site-to-site variability over longer (> 50 km) distances as in the PATOS case (Figure B1c).
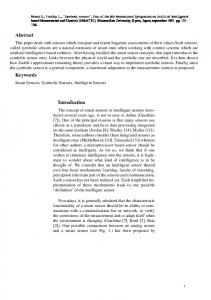
b) The auto-correlation function (ACF) of PM10 time series becomes low (ACF < 0.5) after 1-to-3 days of time lag at ‘background sites’ and very low (ACF < 0.3) already after 1-day of time lag at ‘traffic sites’. Figure B2 shows the ACF (y axis) for the 3-year (2012-2014), daily-resolved PM10 time series at selected monitoring sites for time lags (x axis) ranging from 0 days (self-correlation, ACF = 1) to 10 days. This result further supports the inadequacy of using a 30-days time-window as an efficient ‘out-of-dust background’ period over which to evaluate the desert dust event contribution.
Appendix to the paper by Barnaba et al., Atm. Env., 2017 http://dx.doi.org/10.1016/j.atmosenv.2017.04.038
a)
b)
Figure B2: PM10 time series auto-correlation function (ACF, y) at different time lags (x axis, days) obtained using 3years (2012-2014) daily PM10 time series at different urban monitoring sites. (b). In panel a) ‘traffic sites’ within the Rome urban area are reported while in panel b) ‘rural background sites’ in the broader Latium region were selected. The auto-correlation is 1 at time lag = 0. The dotted blue line is set as reference at autocorrelation of 0.5.
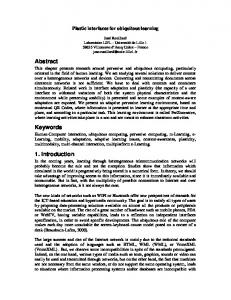
c) By estimating the desert dust load as a difference between ‘in-dust’ and ‘out-of-dust’ PM10 conditions, Eq. 1 (Section 2.2) implicitly assumes this difference is (or should be) zero in desert dust-free periods. We tested this ‘null hypothesis’, i.e., the assumption that the difference, PM10, between the PM10 recorded in any dust-free date (let’s refer to it as ‘day0’) and the ‘background’ PM10 computed over a (dust-free) time period of length Δt is zero. To this purpose we used the DIAPASON 3-year dataset (2012-2014) of daily PM10 values at the 37 ARPA-Lazio sites and employed a variable Δt length of the ‘background period’, including both symmetrical and asymmetrical intervals from day0 (i.e., Δt = L and Δt = –L, respectively, with L = 3, 5, 7, 15 days, the EC-Methodology approach representing one of these cases, i.e., Δt = 15 days). For all the 37 ARPA-Lazio monitoring sites and for all the dust-free dates within the investigated period, we computed the site-dependent median PM10 (where each daily PM10 is derived similarly to the ΔPM10 in Eq. 1, except that only dust free dates are used as a counter-check). We show in Figure B3a the (year 2014) average over all sites of these PM10 values (y axis) as a function of the length of the ‘background period’ tested (x axis) for both the symmetrical (right part of the graph) and asymmetrical (left part of the graph) cases. In panels B3c, d, the general results are also further ‘decoupled’ by site-type, i.e., only including selected high traffic or rural background sites, respectively. Overall, Figure B3 shows that the longer the Δt (both for symmetrical and asymmetrical periods) the weaker the validity of such a ‘null hypothesis’ (a fully verified ‘null hypothesis’ would give a y = 0 value). This feature is kept over both high traffic (Figure B3b) or RB sites (Figure B3b), although, as expected, the absolute values of PM10 is lower in RB sites. It is also interesting to note that the PM10 values in Figure B3 keep lower using symmetrical periods rather than asymmetrical ones, even when the actual length of the background period considered is comparable (e.g., the case 7 days keeps always lower than the -15 days case; the case 3 days keeps always lower than the -7 days case). This is because PM10 at ‘day0’ is always a transition between what comes before and what comes next.
Appendix to the paper by Barnaba et al., Atm. Env., 2017 http://dx.doi.org/10.1016/j.atmosenv.2017.04.038
Figure B3: a) Average of the site-resolved annual median δPM10 values computed at the 37 ARPA-Latium monitoring sites in the year 2014 (δPM = |PM10day0 - median PM10| over a ‘background period’ of length Δt) vs. different ‘background period length’, Δt. Ten different Δt have been considered (Δt = L and Δt = –L, from day0, with L = 3, 5, 7, 15 days), thus including symmetrical (Δt = L , red dots) and asymmetrical (Δt = –L, blue dots) cases; b) as in a) but only including results in selected ‘high traffic sites’ within the Rome city, c) as in a) but only including results in selected ‘rural/regional background sites’ in the Latium region. Each plot also shows, for each Δt case, the associated standard deviations (vertical bars) and the 25th – 75th percentile range (shaded areas delimited small dots).
All this together (i.e., discussion at points a, b, and c above) indicates that the closer the background period to the desert dust event the better this represents the ‘most likely’ PM10 background level over which the dust event builds on.