Acoustic Design of Theatres Applying Genetic Algorithms Shin-ichi Satoa), Tatsuro Hayashi, Atsushi Takizawa, Akinori Tani, Hiroshi Kawamura, Yoichi Ando Graduate School of Science and Technology, Kobe University, Rokkodai, Nada, Kobe 657-8501, Japan
(Received 14 April 2003; revised 15 January 2004; accepted 20 January 2004) An optimization system based on genetic algorithms (GAs) - simulating an evolutionary feedback for the design of theatres - was developed. The first GA model was an optimization of the walls and the ceiling of a hall of the wide-shoebox type. The second model was an optimization of reflectors for a fan shaped outdoor theatre. The final results show that the optimized forms from both models are complex, uneven space forms, but the resulting sound field at each seating position has a high scale value of subjective preference. Keywords: Genetic algorithms, Acoustic design, Theory of subjective preference
1. INTRODUCTION An optimization system based on genetic algorithms (GAs) simulating an evolutionary feedback for the design of theatres - was developed. The first GA model was an optimization of the walls and the ceiling of a hall of the wide-shoebox type. The second model was an optimization of reflectors for a fan shaped outdoor theatre. The final results show that the optimized forms from both models are complex, uneven space forms, but the resulting sound field at each seating position has a high scale value of subjective preference. A shoebox-type of concert hall, such as Grosser Musikvereinsaal, Concertgebouw of Amsterdam, and the Boston Symphony Hall, are said to have excellent acoustics due to their high ceiling, vertical sidewalls, and shallow side balconies. Although it is true that a simple shoebox form is one of the best and most efficient shapes for a theatre, a form that has often been employed as the beginning basic form of a hall (in order to avoid mistakes within the limited knowledge of acoustic design), there remains a large search domain for the possibility of making totally new acoustical spaces. Engineering design as an inverse problem is one of optimization, selecting a solution from a number of possible a) Now at Architectural Acoustic Lab. (Room 603), Department of Architectural Engineering, Hanyang University, 17 Heangdangdong, Seongdong-gu, Seoul 133-791, Korea,
[email protected]
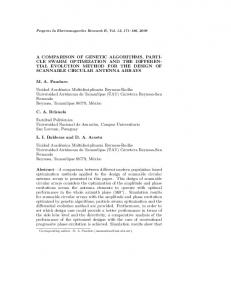
solutions. Although several mathematical optimization methods such as linear or non-linear operations have been available for some time, they are ultimately too simplistic to deal with complex engineering problems. Ironically, considerable mathematical sophistication is required to use them. The genetic algorithms (GAs) [1, 2], a form of evolutionary computing, have recently been applied to a variety of complex engineering problems. The GA method was inspired from observing the evolutionary process of natural systems. GA methods have an indispensable characteristic making it effective with multi-peak problems and with multi-objective optimization for an engineering problem solver. GA design is similar to probability search methods. Its schematic procedure is shown in Figure 1. Parameters of an object are symbolized as gene information. Start-up chromosomes are created and a population set is defined (initial population). Next, each chromosome is decoded and objects are produced. All chromosomes are evaluated by a set of predefined evaluation functions (decode and evaluation). After evaluation, some chromosomes having a higher evaluation value are selected as parent chromosomes (selection). New chromosomes are created by crossover and mutation of parents (crossover and mutation). This cycle is repeated until a better solution, which has a higher evaluation
Journal of Temporal Design in Architecture and the Environment (2004) Vol. 4; No. 1
Sato et al. 41
Fig. 1. Schematic of GA.
value than others, emerges from the process. In the theory of subjective preference for concert hall sound fields, an acoustic design of a theatre can be considered as multi-objective optimization for an engineering problem solver. According to this theory, the sound fields in a hall can be evaluated in terms of the following four orthogonal factors [3]: the listening level (LL), the initial time delay gap between the direct sound and first reflection (∆t1), the subsequent reverberation time (Tsub), and magnitude of the interaural crosscorrelation function (IACC). Several experiments have been carried out to examine the independent effects of the four orthogonal factors on a listener’s subjective preference [4]. Linear scale values of preference were obtained by using Thurstone’s law of comparative judgment. Furthermore, the scale value units derived from experiments with different sound sources and different subjects were almost constant, and so may be added to obtain
(1) where Si (i = 1, 2, 3, 4) are the scale values for the respective orthogonal factors. Eq. (1) indicates four-dimensional continuity. Procedures for designing sound fields of a concert hall are illustrated in Figure 2. The above four temporal and spatial factors are carefully designed, in order to satisfy both left and right human cerebral hemispheres for each listener, for the conductor, and for each musician on the stage [1]. The
final goal is to maximize the scale value of subjective preference for all, and this is reflected in the final scheme of the concert hall. A systematic approach employing GAs in terms of four orthogonal factors has already been used for optimizing a theatre design [5]. In the current study, to extend the variety of the applicable models of the theatre, we have developed an optimization system based on two models, a theatre of a wideshoebox shape and a fan shaped outdoor theatre like a classical ancient Roman theatre. Evaluation methods in terms of GA parameters, that is, the fitness function and the number of the generation, were also examined. 2. PROCEDURE 2.1 Outline of a genetic algorithm We used two models: an optimization of the wide-shoebox shape (Model 1) and an optimization of the fan shaped outdoor theatre (Model 2). The orthogonal factors were calculated for theatres of various shapes by using the image method. Scale values of subjective preference were employed as fitness functions. Those hall shapes that produced higher scale values were selected as the next population. To create a new generation, the movement of the vertices of the walls of the theatre was encoded in chromosomes, i.e., binary strings. An example of the encoding of the chromosomes is given in Figure 3. Each three bits of the binary strings corresponds to the direction and the moving range of each vertex. After GA
Journal of Temporal Design in Architecture and the Environment (2004) Vol. 4; No. 1
Sato et al. 42
Fig. 2. Procedures for designing sound fields in a concert hall. The final goal is to maximize the scale values of preference. In this study, a GA system was applied to create alternative schemes that produce better scale values.
Fig. 3. Process of changing the form of models. Numbers 1 through 4 show the vertex.
Journal of Temporal Design in Architecture and the Environment (2004) Vol. 4; No. 1
Sato et al. 43
Table 1. GA Parameters.
Table 2. Objective parameters and coefficients [3].
αi
Parameter
Value
Number of generations
100 for Model 1
i
100 and 500 for Model 2
1
Initial population
30
Number of parents
xi > 0
xi < 0
20logP- 20log[P]p (dB)
0.07
0.04
2
log(∆t 1/[∆t 1]p)
1.42
1.11
6
3
log(Tsub/[Tsub]p)
0.45+0.74A
2.36- 0.42A
Number of crossovers
2
4
Interaural crosscorrelation (IACC)
1.45
−
Ratio of crossovers
1
Ratio of mutation
0.01
operations that included crossover and mutation, new offspring were created. In crossover, genes were selected from parent chromosomes and used to create a new offspring. A crossover point within a chromosome was chosen at random and everything before this point was copied from the first parent while everything after this point was copied from the second parent. After the process of crossover, mutation was applied. This prevents all solutions in a population from falling into a locally optimal solution to the problem. Mutation is the application of a random change to the new offspring. A few randomly chosen bits of the chromosome were switched from 1 to 0 or from 0 to 1. The fitness of the offspring was then evaluated in terms of the scale values of subjective preference. This process was repeated until the end condition (the number of populations generated) had been satisfied. The GA parameters are listed in Table 1. 2.2 Acoustical simulation The orthogonal factors for a source on the stage were calculated for groups of seats. The single omnidirectional source was assumed to be at the centre of the stage, 1.5 m above the stage floor. The receiving points that correspond to the ear positions were 1.1 m above the floor of the hall. The image method was used to determine the amplitudes, delay times, and directions of arrival of reflections at these receiving points. In an earlier study, the Kirishima International Concert Hall, in Japan, was taken as an example in showing that, across the main floor of the hall, there was good agreement between the values of the four orthogonal factors as measured in the real hall and as calculated by simulation [6]. Therefore, the method to evaluate the sound field was the same method as was used in that study. Reflections were calculated up to the second order. Here, the minimum dimensional length of the reflecting plane surfaces for Models 1 and 2 were 5.0 and 3.4 m respectively.
xi
A is the total amplitude of reflections relative to that of the direct sound. , where A n is the amplitude of the n-th reflection relative to that of the direct sound (A0 = 1). [ ]p: Optimum value of each factor.
2.3 Fitness function The scale value of subjective preference was employed as the fitness function. Since a scale value is the interval scale, it is convenient to put a zero at the most preferred conditions. The behavior of the scale value in relation to each orthogonal factor gives us the following expression for Si [3].
,
i = 1, 2, 3, 4
(2)
Here, the parameters xi and coefficients αi are listed in Table 2. The most preferred listening level, [LL]p = 20 log [P]p may be assumed for a particular seat position in the room under investigation. The most preferred values of [∆t1]p and [Tsub]p are determined by the minimum value of the effective duration (τe)min of the autocorrelation function of the source signal [3]. The image method is used for detailed early reflection calculations. Here, Tsub was calculated by Sabine’s formula and was constant throughout the theatre, and thus not employed as the fitness function. S3 due to the Tsub can be controlled by adjusting the absorption of the walls and the volume of the theatre rather than the shapes of the theatre. Actually the measured value of the reverberation time shows little deviation throughout the seats in the audience area both in the indoor and outdoor theatres (for example, in [6, 7]). The preference increased with decreasing IACC without individual differences, regardless of the source signal used [8, 9]. The most effective and widely accepted factor in subjective preference judgments, with the few individual subjective differences in judging the sound field, is IACC.
Journal of Temporal Design in Architecture and the Environment (2004) Vol. 4; No. 1
Sato et al. 44
Fig. 4. Initial dimension of the theatre used as a basis for Model 1 (a); and division pattern of the walls (b).
3. MODEL 1: OPTIMIZATION OF WIDE-SHOEBOX FORM 3.1 Evaluation method Model 1 was an optimization of the walls and the ceiling of a hall of the wide-shoebox theatre. Initial geometry of Model 1 consisted of a ceiling, a front wall, a rear wall, two sidewalls, a stage floor, and an audience floor as shown in Figure 4(a). The audience floor had a slope of 1:10 (10%). The stage was 12.5 m deep and 0.8 m height. A sound source was located at the centre of the stage and 1.0 m from the front of the stage, and its height was 1.5 m from the stage floor. A total of 25 listening points were used in the acoustical simulation. Each
surface, except for the stage and audience floor, was divided into a number of triangles by connecting the vertexes, as shown in Figure 4(b). It was confirmed by the pre-trials that this connection pattern of vertex had a higher sound quality than the other patterns. The range motion for each wall and the ceiling was ±5 m from the respective initial portions. The single binary bit string has 190 bits. Music Motif A (Royal Pavane by Orlando Gibbons, (τe)min = 127 ms [1]) was used in the acoustical simulation and fitness function. The acoustic absorption coefficient of the surfaces in the hall was assumed to be 20%. The seat effect was not taken into account for calculation. Thus, the reverberation time was fixed at the most preferred value of 2.9 s ([Tsub]p = 23(τe)min) [3].
Journal of Temporal Design in Architecture and the Environment (2004) Vol. 4; No. 1
Sato et al. 45
(a)
(b)
Fig. 5. Schematics of average and minimum methods.
The scale values obtained relative to four orthogonal factors at 25 listening positions were evaluated by use of following three methods: (1) Average method: hall shapes which had a larger averaged scale value of 25 listening positions ( ) were selected in the evolution process (Figure 5(a)); (2) Minimum method: hall shapes which had a larger minimum scale value among the 25 listening positions (Smin) were selected in the evolution process (Right in Figure 5(b)); and (3) Hybrid method: evaluating both values (
, Smin).
Average and minimum methods are simple optimizations with one objective function. The hybrid method is multipleobjective optimization. Taking into consideration the influence of the statistical nature of GA processes, five trials were carried out for each evaluation method. 3.2 Results Figure 6 shows the total scale value of preference (a), and the values obtained by LL (b), by ∆t 1, (c) and by IACC (d), applying three different evaluation methods. Zero is the possible maximum scale value of preference. The scale values in relation to Tsub are not evaluated since all values were set to zero due to all seats receiving the preferred condition. The averaged values obtained by the minimum method were less than those obtained by the other two methods. The results of the average method show good subjective preference value on average, but the range between the maximum and minimum scale values, due to IACC variability in the five optimizations, is large (Figure 6(d)). Comparing results of average method and hybrid method reveals that the average values are almost identical, while the hybrid method shows stable results without large fluctuations with the number of trials. Therefore, we used
the hybrid method thereafter. Figures 7(a) through 7(c) show three optimized schemes of the hall obtained by the hybrid method. These were derived from different trials. However, their evaluation values were similar. We can see the sidewalls of the hall resulted in similar configurations. They swell toward the inside. However, other surface parts resulted in various patterns. In particular, the forms of the ceiling have different characteristics. Figure 7(a) shows that the front part of the ceiling is strongly distorted, and folded toward the inside along the centerline above the stage. Thus, the height of ceilings above the stage is low. In contrast, as shown in Figure 7(b), a different scheme evolved. Figure 7(c) shows an average result between those of (a) and (b). Figures 8(a) through 8(c) illustrate the contour lines of equal scale values of the above three results. Remarkably, these lines show similar patterns to each other. Listening points with low scale values appear near the sound source location, and at the rear of the theatres. The decrease of the value around stage side is due to a large value of IACC and listening level. The decrease around the back at the sides is caused by a small value of ∆t1 for Music Motif A with a large value of (τe)min. Figures 9(a) through 9(c) show the contour lines of equal scale values obtained by IACC determined by the optimized form from Figures 7(a) through 7(c). It is worth noticing that contour lines for the total scale value showed similar patterns, while the contour lines of IACC show different tendencies. Generally, the listener’s positions resulting in low scale values may be seen near the sound source, due to the strong direct sound, but as shown in Figures 9(b) and 9(c), they do not spread as much. The averaged S4 of 25 listening points for Figure 9(a) through 9(c) are -0.17, -0.17, and -0.18 respectively.
Journal of Temporal Design in Architecture and the Environment (2004) Vol. 4; No. 1
Sato et al. 46
Fig. 6. Comparison of results obtained by different factors. (a) Total value of preferences S, (b) scale value of S1, (c) scale value of S2, (d) scale value of S4 by IACC. In each graph, averages of five optimizations are plotted with the range between the maximum and minimum values.
Fig. 7. Optimized scheme by hybrid method. (a) through (c) show the schemes by using different trial.
Fig. 8. Contour lines of total scale value of preference S determined by the optimized form determined from Figure 6(a) through
Fig. 9. Contour lines of scale value of preference S4 by IACC determined by the optimized form determined from Figure
6(c). (a)
6(a) through 6(c). (a)
: -0.44 ; Smin : -1.07; (b)
0.46; Smin : -1.08; and (c) 1.06.
:-
: -0.46; Smin : -
Journal of Temporal Design in Architecture and the Environment (2004) Vol. 4; No. 1
0.56; (b)
4
: -0.17 ; S4 min : -
4
: -0.17; S4 min : -0.43; and (c)
: -0.18; S4 min : -0.50. 4
Sato et al. 47
Fig. 10. Initial dimension of the theatre for Model 2. The range of motion of each reflector is ±5 m from the respective positions in initial form.
4. MODEL 2: OPTIMIZATION OF FAN-SHAPE OUTDOOR THEATRE 4.1 Evaluation method Model 2 was an optimization of stage and canopy reflectors for a fan shaped outdoor theatre, much like a classical Roman theatre. As shown in Figure 10, the original theatre consisted of a stage floor and a half-circle seating area made up of step floors. The stage was 29-m wide and 9-m deep. The radius of the half-circle seating area was 49 m and the height of the end of the seating area was 22 m. Reflectors were installed above the seating area and behind the stage. The initial height of the reflectors above the seating area was 15 m. The reflectors behind the stage were installed 13 m behind from the stage edge. The number of listing points used in the acoustical simulation was 60. Like Model 1, the reflectors were divided into several triangles. The reflectors above the seating area were not treated as a continuous surface, but were divided into independent units. Figure 11 shows the division patterns. Each part surrounded by a heavy outline is a unit. Each unit moves independently of the neighboring units. Triangles within the same unit share vertexes with the neighboring triangles. Therefore, the more the units are created by division, the more the number of combinations of forms increases. The total numbers of solutions for Figures 11(a) through 11(c) are (a) 10270, (b) 10195, and (c) 10149 respectively. Such differences of division were compared. The upper half and lower half of each reflector behind the stage were treated as independent
units. The range of motion for each vertex was ±5 m from the respective initial positions. The single binary strings for Figures 11(a) through 11(c) have 1155 bits, 915 bits, and 750 bits respectively. Music motif D (Siegfried Idyll; Bar 322 by Richard Wagner, (τe)min = 40 ms [1]) was used in the acoustical simulation and fitness function. The hybrid method with only S4 (represented by IACC) was employed as a measure of fitness because psychological preference increases with decreasing IACC, without individual differences and regardless of the source signal used [8, 9]. The GA parameters are listed in Table 1. Two optimizations with 100 and 500 generations were carried out. In this study, the solutions for the problems which have different complexity have been compared under the conditions of same parameter settings. 4.2 Results Figure 12 shows the optimization processes using the hybrid method of S4 values. Each symbol corresponds to a solution for optimizations with two generations. Since higher values of S4 are preferred, dots plotted in the right-upper area indicate better solutions. The results of optimization following 500 generations are better than those of 100 generations, no matter which division pattern is employed. The division pattern having the largest number of units results in the worst scale values of all models (Figure 12(a)). The difference of the scale values with varying number of generations became smaller as the number of units decreased.
Journal of Temporal Design in Architecture and the Environment (2004) Vol. 4; No. 1
Sato et al. 48
Fig. 11. Division pattern of the reflector above the seating area. (a) 37 units; (b) 12 units; and (c) 4 units. The part surrounded by a thick line shows a minimum unit.
Figures 13(a) through 13(c) show the optimized forms of each division pattern for better results of two optimizations of the generation. The results of Figures 13(a) and 13(b) are 500 generations, and that of Figure 13(c) is 100 generations. Figures 14(a) through 14(c) illustrate the contour lines of equal scale values of S4. Compared with the results of the initial form (
: -0.85; Smin: -1.00), the results of the optimized
forms are much improved over a wide area. 5. DISCUSSION In the optimization of Model 1, an attempt was made for three different evaluation methods. It was found that the minimum method has two shortcomings: a lesser contribution to the improvement of overall acoustic efficiency, and a difficulty with improving the minimum value itself, since scale values at seating positions near the sound source tend to be low. If attention to the minimum value of the scale value, the whole evaluation cannot be improved, and the GA search might become trapped into a local optimum. On the other hand, it was found that the average method has a shortcoming that allows the possibility of local decreases in scale values, even
Fig. 12. All solutions created in the processes of GA operations. In the case of 100 generation researches, the number of solutions was 3000, and in the case of 500 generations researches, 15000.
if whole evaluation can be improved. In light of these disadvantages, we conclude that the hybrid method is the most suitable for optimizing a theatre’s form. Though contour lines of evaluation values of three results, as shown in Figure 7 are similar, their resulting forms differ significantly. The form of Figure 7(a) is influenced by the listening level, and that of Figure 7(b) is due to IACC. Also, that of Figure 7(c) is the mixed type due to both listening level and IACC. In Model 1, three factors (LL, ∆t1, and IACC) were employed to obtain the total scale value of preference. There is a trade-off relationship among factors because these factors contribute to the total scale value independently. As for the conflicting requirements between the factors, the maximization of the scale value of IACC may be allowed to take priority because IACC is the most effective and widely accepted factor in subjective preference judgments, with the few individual subjective differences in judging the sound field. Designing a theatre whose total scale values
Journal of Temporal Design in Architecture and the Environment (2004) Vol. 4; No. 1
rises above -0.5 is laborious Sato et al. 49
Fig. 13. Optimized forms by using three different division patterns. (a) 37 units (500 generation); (b) 12 units (500 generation); and (c) 4 units (100 generation).
task. However, with the GA method, we can shape the space form for a theatre with a higher scale value of subjective preference very quickly. In the optimization of Model 2, it was found that IACC in the seating area can be improved significantly by installing reflectors in the fan shaped outdoor theatre. However, simply covering the theatre with a plain surface had no effect. The division pattern with less units like Figure 10(c) reached to the optimum solutions quickly. However, the division pattern with more units like Figure 10(a) remarkably decreased the efficiency of the GA search. GA operation which has a large solution space but a simple condition for the optimum solution enables to search the optimum solution if much time is spent. On the other hand, the solution for the problem with a large solution space tends to be fallen into a locally optimal solution if the condition for the optimum solution is not simple. In the optimization of Model 2, there is a trade-off for the evaluation of IACC among the listening positions, therefore, there exists various patterns for the optimum reflector form. In addition, the division pattern of Figure 10(a) has a larger solution space. This is why the Figure 10(a) showed the worst evaluation
Fig. 14. Contour lines of scale values of preference S 4 obtained by IACC. (a) Result obtained by Figure 12(a);
4
:
-0.59; S4 min : -1.00; (b) Result obtained by Figure 12(b); 4 : -0.46; S4 min : -0.99; and (c) Result obtained by Figure 12(c); 4
: -0.46; S4 min : -0.90.
values. In the GA process, the minimum dimensional length of some reflecting plane surfaces become smaller and this affects the diffraction and/or scattering of the reflection for certain frequency range. If more accurate simulation methods are introduced, for example, the hybrid method of the image model and the finite element method, the calculated results would improved even more. But the present procedure is still useful when for determining the fundamental scheme of the theatre at the initial design stage. 6. CONCLUDING REMARKS We used genetic algorithms (GAs) to evaluate the optimum acoustic design for theatres. The GAs found many more complex and uneven forms beyond the conventional shoebox
Journal of Temporal Design in Architecture and the Environment (2004) Vol. 4; No. 1
Sato et al. 50
form. The hybrid method, which considers both the average and the minimum scale value of all listening points, is most suitable for optimizing a theatre’s form. In addition, the results of optimization converged rapidly when applying division patterns with fewer units. ACKNOWLEDGMENTS This work has been partially supported by FY 2003 Grant-inAid for Scientific Research, Scientific Research (A)(1), No. 14205087 and JSPS (Japan Society for the Promotion of Science) Postdoctoral Fellowship for Research Abroad. The authors would like to thank Dr. Dennis Noson for his help in proof-reading the English. REFERENCES [1] Holland, J. H. (1975). Adaptation in Natural and Artificial Systems. The University of Michigan Press.
[2] Goldberg, D. (1989). Genetic Algorithms in Search, Optimization and Machine Learning. Addison Wesley. [3] Ando, Y. (1998). Architectural Acoustics-Blending Sound Sources, Sound Fields, and Listeners. AIP Press/Springer Verlag, New York. [4] Ando, Y. (1985). Concert Hall Acoustics. Springer-Verlag, Heidelberg. [5] Sato, S., Otori, K., Takizawa, A., Sakai, H., Ando, Y., and Kawamura, H. (2002). Applying genetic algorithms to the optimum design of a concert hall. Journal of Sound and Vibration, 258, 517-526. [6] Ando, Y., Sato, S., Nakajima, T., and Sakurai, M. (1997). Acoustic design of a concert hall applying the theory of subjective preference, and the acoustic measurement after construction. ACUSTICA / acta acustica, 83, 635-643. [7] Sato, S., Sakai, H., and Prodi, N. (2002). Acoustical measurements in ancient Greek and Roman theatres. Proceedings of FORUM ACUSTICUM SEVILLA 2002 (in CD-ROM). [8] Singh, P. K., Ando, Y., and Kurihara, Y. (1994). Individual preference in subjective preference judgments of sound field. ACUSTICA, 80, 471477. [9] Ando, Y. and Setoguchi, H. (1995). Nuovi sviluppi nell’facustica delle sale da concerto: Dati di preferenza individuale per la scelta del posto (in Italian). Atti del XXIII Congresso Nazionale AIA, Bologna, 11-18.
Journal of Temporal Design in Architecture and the Environment (2004) Vol. 4; No. 1
Sato et al. 51