66
IEEE JOURNAL OF OCEANIC ENGINEERING, VOL. 37, NO. 1, JANUARY 2012
Active Detection With a Barrier Sensor Network Using a Scan Statistic Xiufeng Song, Student Member, IEEE, Peter Willett, Fellow, IEEE, Joseph Glaz, and Shengli Zhou, Senior Member, IEEE
Abstract—The cooperation of an active acoustic source and a large number of distributed passive sensors offers an opportunity for active sonar detection. The system works as follows: first, each sensor compares its matched filter output with a given threshold to obtain a binary local decision—“0” or “1”; then, a fusion center (FC) collects them to make a system-level inference. How effectively to combine these local results—distributed detection fusion—is the concentration of this paper. Suppose that the sensor network is unaware of the target’s reflection model. Then, the local detection probabilities cannot be obtained; therefore, the optimal fusion rule is unavailable. The obvious detection strategy is a counting rule test (CRT), which simply counts the total number of 1’s and compares it to a threshold. This approach does not require knowledge of sensor locations, and equally considers all network subareas. However, the reflected signal from some targets, such as a submarine, can be highly aspect dependent, and in many instances only sensors in a particular zone can receive its echoes. This paper focuses on the scan statistic, which slides a window across the sensor field, and selects the subarea with the largest number of 1’s to make a decision. The scan statistic integrates the aspect-dependence characteristic of the target into detection fusion. With a proper window size, it may suppress the subarea interference, and improve the system-level performance. Index Terms—Counting rule test (CRT), detection, detection fusion, multistatic, scan statistic, sensor network, sonar, submarine.
I. INTRODUCTION
I
T is well known that the acoustic reflection of many sonar targets such as submarines, unmanned underwater vehicles, and weapons is aspect dependent, and much of the reflected energy will be concentrated within a particular conical angle [1]. A reliable detection is possible only if some receivers are within that area, particularly at low signal-to-noise ratio (SNR) [2]. If a system, such as a classical monostatic [3] or multistatic sonar [4], [5], merely has a few source–receiver pairs, the possibility that at least one receiver falls into the conical area is low. Therefore, a smart target can effectively hide itself by properly adjusting its location or orientation. An alternative configuration Manuscript received July 26, 2011; revised November 08, 2011; accepted November 10, 2011. Date of publication December 13, 2011; date of current version January 13, 2012. This work was supported by the U.S. Office of Naval Research under Grant N00014-09-10613. Associate Editor: G. Potty. X. Song, P. Willett, and S. Zhou are with the Department of Electrical and Computer Engineering, University of Connecticut, Storrs, CT 06269 USA (e-mail:
[email protected];
[email protected];
[email protected]). J. Glaz is with the Department of Statistics, University of Connecticut, Storrs, CT 06269 USA (e-mail:
[email protected]). Digital Object Identifier 10.1109/JOE.2011.2176592
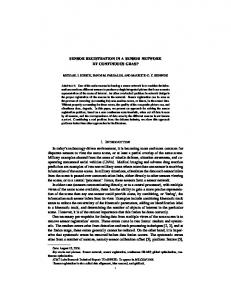
Fig. 1. A barrier sensor network is composed of an acoustic source and a narrow passive sensor band, and it could be used to detect a target out of the sensor band. Since the acoustic reflection of some sonar targets is angle dependent, only those located in a particular zone are able to reliably detect the echoes if the transmission energy is not large.
is a distributed sensor network [2], [6]. If it has sufficient spatial span and receiver density, the aggregated detection sensitivity to source–target–receiver geometry may be reduced, and the overall detection performance could be improved. We are interested in multistatic detection with a barrier sensor network, which is composed of an acoustic source and a band of passive sensors as shown in Fig. 1. Such a setup is very useful for region denial and coastline monitoring [2], [6]. Let the sensors have only limited computational capacity, such that they can make only a binary decision—“0” or “1”—via a simple comparison of their matched filter outputs with a given threshold. A fusion center (FC) thereafter collects the local results to make a system-level inference. The focus of this paper is on how to fuse these distributed decisions, and our main contribution is the comparison of a counting rule test (CRT) to a scan statistic. Distributed detection fusion is an active research area. In [7], Chair and Varshney showed that the optimal fusion rule under the Neyman–Pearson criterion was the likelihood ratio test, which utilized the probabilities of local detection and false alarm rate to combine these binary results. Since sensor networks do not have knowledge of the location and reflection model of the target, local detection probabilities are generally unknown. Therefore, the optimal fusion rule is irrelevant. A suboptimal alternative is the CRT [8]–[10], which counts the total number of 1’s and compares it to a given threshold to infer whether a target exists. As the CRT requires neither local detection probabilities nor sensor locations, it is very suitable in this application.
0364-9059/$26.00 © 2011 IEEE
SONG et al.: ACTIVE DETECTION WITH A BARRIER SENSOR NETWORK USING A SCAN STATISTIC
The CRT equally weights all the local decisions without considering their spatial distribution. However, since most reflection energy from some complex targets is focused in a narrow conical area, only a subset of sensors can produce reliable local detections, while others are generally dominated by background noise [2]. If one could find that significant area and utilize only it to make a final decision, the system-level performance would be improved, especially at low SNR. An emerging local detection fusion approach is the scan statistic [11], [12]. It slides a window with proper size around the sensor field, and picks up the most significant area to make a system-level detection. Here, the significance is defined by the number of 1’s falling into the window. The key feature of a scan statistic is that its threshold can be set accurately to produce any desired system-level false alarm rate. In this paper, we will show that the scan statistic can outperform the CRT in barrier-sensor-network-based detection fusion. To recapitulate, the estimation of the location of an aspect-dependent target with the configuration in Fig. 1 was explored in [2]. Supposing that a target was present, the processing center could estimate its position with the binary decisions if the full local detection information were available. On the other hand, the idea of the application of a scan statistic in target detection was introduced in [13]. In [13], an isotropic target was within a large square sensor field. Its significant area would be a circle and it is invariant to the target location (a square window was used). In our problem, the target is external to the sensor network. The significant area is angle and distance dependent, and a rectangular scanning window is adopted. The system-level performance with square and rectangular windows has different analyzing approaches [11], [12]. In all, this paper follows these two works: it applies the scan statistic to the problem of [2]. The rest of this paper is as follows. Section II introduces the target reflection model and the local detection behaviors. Section III gives the global detection fusion approaches, while the scan-statistic-based detection fusion is proposed in Section IV. The system-level performance of a scan statistic is analyzed in Section V, while numerical examples are shown in Section VI. Conclusions are drawn in the end. II. PROBLEM STATEMENT We are interested in target detection with a barrier sensor network, where an acoustic source and passive sensors cooperate to monitor a suspicious area as shown in Fig. 1. The system works as follows. First, the acoustic source emits a probing signal , which can reach both the surveillance area and the distributed sensors. If a target invades that area, reflections will be concentrated in a certain direction with a narrow beamwidth [1, p. 309]. Second, all sensors apply local matched filers for detection. As an operational matter they may be awoken from a “sleep” mode by the direct signal.
and suppose that each sensor makes its test based on the magnitude square of its matched filter output . Under the null hypothesis , has an exponential distribution with probability density function (pdf) [14] (1) where denotes the waveform energy. Under the alternative hypothesis , the received signal is composed of two parts: echoes plus noise. Let the echoes be independent of sensor noise. With a Rayleigh fading model [1, pp. 189 and 382], we have [14] (2) where stands for the contribution of target reflection to the th sensor, and it is a function of source–target–sensor geometry. Here, we assume that is estimable by other means to avoid concerns of the local decisions being constant false alarm rate (CFAR). Let all the sensors employ the same threshold in decision making. With the Neyman–Pearson lemma [15, p. 417], the local false alarm rate and probability of detection for the th sensor can be written as
(3) , and relates to the reflection where geometry and transmission power. Clearly, all ’s are equal, and we will use to refer them for notational simplicity. The probabilities of local detection ’s are different, because the ’s are geometry dependent. The binary local detection results for sensor node are , where takes the value of “1” if there is a detection; otherwise, it takes the value of “0.” B. Local Detection Modeling Underwater sound propagation is complex. An acoustic signal can be delayed, weakened, and distorted during propagation. Parameter is a complicated function of propagation distance, source–target–sensor geometry, as well as the underwater environmental parameters including temperature and salinity; a precise formula is usually unavailable in real time. Here we only consider propagation loss and angular dependence for simplicity. In general, the effects of propagation loss and angle-dependent reflection might be separately modeled [2], and this yields
A. Local Sensor Node Detection Let a sensor have limited communication capacity, and it transmits a binary local decision instead of raw data to the FC. Suppose the sensor noises to be independent and identically distributed (i.i.d.) zero-mean complex Gaussian with variance ,
67
(4) where is a geometry-independent constant, power loss due to the propagation distance, and the angle-dependent reflection.
denotes the describes
68
IEEE JOURNAL OF OCEANIC ENGINEERING, VOL. 37, NO. 1, JANUARY 2012
denotes the 3-dB bandwidth, and determines the where order of the Butterworth filter.1 Substituting (4) into (3), we have (9) summarizes the set of unknown pawhere rameters under . Due to the directionally selective reflection, only those sensors within the detectable zone are likely to declare detections under hypothesis . III. GLOBAL DETECTION FUSION APPROACHES Fig. 2. An illustration of angle-dependent power loss of a submarine in 2-D . The reflection of an acoustic source focuses on a principal [2], where in the coordinates, while the angle of sensor is . If direction, say , we have based on (7); otherwise, . The . power of the received signal at sensor is a function of
We assume that the source and the sensors are at the same depth as the target. Therefore, the propagation distance for the path source–target–(the th sensor) is
In underwater surveillance, distributed sensors periodically transmit their local decisions ’s to an FC; the latter properly combines to make a system-level decision. Based on how to use , detection fusion can be divided into two categories: global and local. In the global fusion, a fused decision includes all the local decisions ’s, while a local one may use only part of them. Here, we will review some typical global approaches and discuss their feasibility in angle-dependent sonar target detection. A. Chair–Varshney Rule
(5) where , and , respectively, denote the coordinates of the source, the target, and the th sensor. In this paper, a cylindrical spreading loss model [1, p. 102] is employed wherein the power loss is said to be proportional “inverse first power” of the propagation distance ; that is
For a binary detection fusion problem, the optimal Neyman–Pearson test statistic is given by the Chair–Varshney rule [7]
(10) (6) Note that such power loss may exist at moderate and long ranges whenever the sound is trapped by an underwater acoustic channel [1, p. 102]. The angle-dependent reflection is more complicated than the propagation loss. Here we adopt the two-parameter aspect-dependent target (a submarine) modeling approach of [2]. Denote the principal reflection angle as and the angle from the th sensor to submarine as , as in Fig. 2
where denotes the system-level null hypothesis, and represents the system-level alternative hypothesis. The optimal fusion rule is essentially a weighted sum of local detections, and it requires the knowledge of local sensor’s performance. Unfortunately, since the target’s parameter set is unknown, ’s are not available. As a result, the optimal fusion rule may not be performed at FC for this problem.
(7)
In [8] and [9], a suboptimal CRT is suggested, where the FC counts the total number of local decision 1’s and compares it with a given threshold to decide whether a target appears. Mathematically, its statistic is written as
As the surveillance area is on the single side of the barrier sensor network, we have , . As a consequence, there is no ambiguity in determining the ’s from (7), and they are always in . The aspect-dependent reflection gain may be determined by the difference between and , and can be well matched by a “butterfly” pattern [1, p. 311]. Its wing sides have significant reflection gains, and this will lead to a detectable zone in a sensor network. Unfortunately, this pattern does not have a closed-form expression, and a Butterworth-filter-based approximation is suggested in [2] (8)
B. Counting Rule Test
(11) where all the local decisions are equally weighted. As the CRT does not require knowledge of probabilities of local detection, it is applicable here. The closed-form system-level false alarm rate of the CRT can be found in [8] and [9]. However, its system-level probability of 1Note that the utilization of a Butterworth pattern is for illustrating the idea of angle-dependent reflection; a real radiation pattern can be readily used if an exact formulation is available.
SONG et al.: ACTIVE DETECTION WITH A BARRIER SENSOR NETWORK USING A SCAN STATISTIC
69
detection for this problem could not be analytically derived, and it could only be analyzed numerically. C. Other Modifications and Discussions An interesting generalized-likelihood-ratio-based (GLRTbased) decision fusion is proposed in [10], where the maximum-likelihood (ML) estimate of is utilized to modify the Chair–Varshney rule. Since the FC does not have knowledge of target radiation model for our problem, an explicit joint conditional pdf is unavailable, and hence ML is infeasible. Furthermore, the target is assumed isotropic, and located within a dense sensor field [10], so that sensors declaring detection may surround the target, such a favorable geometrical complementarity could result in a good estimation. In our problem, the target is outside the sensor network; the geometrical complementarity of sensor nodes is poor. Even though the FC strives to estimate it with a mismatched model, the estimation accuracy would be low. In [16], Guerriero et al. suggested to assign a prior distribution to and hence construct a Bayesian test. As this method desires the knowledge of , it is of limited applicability here. IV. SCAN-STATISTIC-BASED TARGET DETECTION A. From Target Detection to Cluster Detection A scan statistic was developed to search for clusters in a spatial or (and) time spanned data set. It has been widely used in bioinformatics, ecology, and medicine [11], [12]. Briefly, a test based on scan statistic slides a window across the observation domain, and utilizes the most significant data subset to infer the hypothesis. The shape of the window is usually problem dependent. It can be a square, a rectangle, a circle, or an ellipse, and no uniformly best one exists. The key feature of a scan statistic is that despite the “sliding” behavior of the window powerful methods exist for false alarm rate calculation. However, note that only for some window shapes (especially rectangular) are these formulas presently known. Suppose that the sensors are uniformly distributed in the barrier band. With the i.i.d. background noise assumption, the sensors declaring “1” are uniformly dispersed under . If a target invades the surveillance area and if the mainlobe of its reflection pattern falls into the sensor field, a certain number of sensors within this zone will declare “1.” Therefore, a local detection cluster may form, and the detection problem could be converted to a cluster detection one: • : no significant “1” cluster exists within the sensor network; • : a nonempty zone has a locally significant detection cluster. In general, the zone specified in is unknown; some heuristic conjectures such as the size of are necessary. B. Bernoulli Sensor Field In this case, the total number of sensors is known, and the sensors are regularly deployed in a 2-D barrier band. The barrier band can be uniformly divided into small subsquare cells, and each cell contains exactly one sensor as shown in Fig. 3. Let
Fig. 3. Two-dimensional Bernoulli grid of a barrier sensor network, where and . If no target appears in the surveillance area, the sensors declaring detection follow a uniform distribution. Otherwise, certain local detection clusters may happen. A scan statistic test slides a rectangle window denotes the across the sensor field to check whether a “1” cluster exists. cell of a certain position.
the barrier sensor field be composed of small cells, where and , respectively, denote the numbers of grid columns and rows. Let denote the binary local decision of the sensor in cell , where and are, respectively, the row and column indexes; we have (12) which means that a 1-D local decision stream is reorganized into two dimensions. A shape match between the local detection cluster and scanning window would improve the test performance. Unfortunately, since the cluster varies with the target location and the skewness of its pattern mainlobe, a perfect footprint coincidence may not be guaranteed. Here, a suboptimal rectangle window is employed. As the width of the sensor band is thin, it will be included in the window for scanning convenience; see Fig. 3. Let the discrete length of the window be , , and then the total number of “1” within where the window is (13) , and . The 2-D where summation for ’s can be equivalently converted into a 1-D problem on ; this is an important difference from [13]. The scan statistic is defined as the largest count within the event set [11, p. 273] (14) and the FC makes a system-level decision based on declare declare
(15)
where corresponds to a specified significance level in discriminating a “1” cluster. Intuitively, the scan statistic divides the sensor field into several partially overlapped subareas, and then selects the most significant one to make a system-level decision. If , the scan statistic becomes a CRT. C. Poisson Sensor Field In the previous scenario, the number of sensors is known, and they are regularly deployed within the preassigned cells.
70
IEEE JOURNAL OF OCEANIC ENGINEERING, VOL. 37, NO. 1, JANUARY 2012
Such an ideal deployment enables a comprehensive sensor field coverage; however, it is hard to maintain. For example, some sensors may be out of battery power, or communication in data collection; hence, the number of activated sensors may differ from that deployed. Furthermore, the currents may displace the sensors, and disarray the deployment. Here, we are interested in a random barrier sensor network. Both the number of activated sensors and their locations are random: • the total number of activated sensors, say , has a Poisson distribution; • those activated sensors are uniformly distributed within the barrier band. These two assumptions have been adopted in many random sensor network treatments [2], [8]–[10], [13], [16]. Suppose that the initial distribution of activated sensors is a homogeneous Poisson process with density ; we have (16) where denotes the area of the sensor band. Let the sensors be within and , and then we get . The locations of sensors are i.i.d., and have a uniform pdf
and otherwise
(17)
Each sensor makes a local decision based on its matched filter output. With an i.i.d background noise assumption, the number of sensors declaring “1” under hypothesis also has a Poisson distribution with density , and they are uniformly located within the sensor field. Under , the distribution of sensors declaring “1” is no longer uniform, and a “1” cluster may form. We use a window to scan the sensor band to check whether a “1” cluster exists. Continuous scanning would be the best choice for a given window size; however, we prefer a discrete scanning scenario again for analysis simplicity: uniformly dividing the sensor band into contiguous narrow slices as shown in Fig. 4. Let stand for the number of sensors declaring “1” in the th slice, and let the window cover exactly slices; hence, the total number of “1” within in the window is , where . Here the 2-D data summation can also be reduced to a scalar case. The scan statistic is defined as the largest count within the event set (18) and the FC makes the system-level decision based on declare declare where
corresponds to a given significance level again.
(19)
Fig. 4. Two-dimensional slicing of a barrier sensor network. If no target appears in the surveillance area, the sensors declaring detection are uniform and sparse. Otherwise, local detection clusters may happen. A scan statistic slides a rectangle window across the sensor field to check whether a cluster exists.
V. PERFORMANCE ANALYSIS FOR SCAN STATISTIC A. Bernoulli Sensor Field The system-level performance including the false alarm rate and the probability of detection will be discussed for scanning a Bernoulli sensor network. With the i.i.d. sensor noise assumption, the ’s are i.i.d. Bernoulli random variables with parameter in the absence of a target. Therefore, the ’s are independent and described by a binomial distribution (20) under the null hypothesis is defined as
. The system-level false alarm rate
(21) and it is a function of and window size . The is intricate, and a closed-form expression is not analysis of available. In [17], Glaz and Naus suggested that could be accurately approximated with (22) where
(23) can be calculated by the procedure in the Appendix. Intuitively, and denote the statistical results for a -size window scanning two random sequences, respectively, with length and . To verify the approximation accuracy of (22), we plot several curves of the system-level false alarm rate versus the scan statistic threshold in Fig. 5. We choose and . Each simulated curve is obtained by 1 000 000 Monte Carlo runs. From this figure, we see that (22) exhibits good approximation performance for different and values, and would be effective in false alarm analysis. The system-level probability of detection is defined as (24)
SONG et al.: ACTIVE DETECTION WITH A BARRIER SENSOR NETWORK USING A SCAN STATISTIC
71
Fig. 5. A comparison of simulated and approximated system-level false alarm rates of scan statistic in a Bernoulli sensor field. Each simulated curve is based on 1 000 000 runs.
Fig. 6. A comparison of simulated and approximated system-level false alarm rates of scan statistic in a Poisson sensor field. Each simulated curve is based on 1 000 000 runs.
However, since the conditional pdf of is unavailable, cannot be analytically derived or accurately approximated. In general, it can only be analyzed via simulations; since it is target dependent in any case, this seems acceptable.
in two dimensions. The rectangular sensor field is uniformly divided into 6 101 cells, with each cell containing exactly one sensor node. The total number of sensors is . The acoustic source is located at . Under the hypothesis, a target is fixed at ( 0 1000 m), while its heading is uniformly distributed within . The power control constant is chosen as
B. Poisson Sensor Field With an i.i.d. sensor noise assumption, the Poisson random variables
’s are i.i.d.
(28) (25)
under hypothesis , where represents the area of each slice, and denotes an integer. The system-level false alarm rate is (26) A closed-form expression for is not available, but again it can be approximated with (22). [Actually, approximation (22) is a general result.] To approximate (26), we should employ (25) instead of (20) in the calculation of and . The approximation accuracy for the Poisson scenario with different parameter values is demonstrated by Fig. 6. In the simulation, we choose and . Each simulated curve is obtained by 1 000 000 runs. VI. NUMERICAL RESULTS A. Bernoulli Sensor Field This section numerically compares the performance of CRT and the scan statistic in target detection with a Bernoulli sensor network. Let the sensor band cover area 2500 m
2500 m
250 m
(27)
where normalizes the maximum propagation loss due to as shown in (9), and is defined as the source-to-receiver SNR. In the following simulations, the “SNR” refers to . Finally, the beampattern parameters are chosen as and [2], which enable to have a good approximation to the Butterfly one in [1, p. 311]. The detection performance is compared with the help of the receiver operating characteristic (ROC). Let the local false alarm rate be . Fig. 7 gives the ROCs for the CRT and scan statistic with different SNRs, while Fig. 8 depicts the relationship between the system-level probability of detection and window size for scan statistic at a given SNR. From these figures, we notice the following. • For a given SNR, the scan statistic with a properly selected window size has better detection performance than the CRT. The reason for this is that if a target can only affect a part of sensor network, the detectable zone, picking up that subarea may be better than interrogating the entire field. • The window size of the scan statistic can affect the ROC. Since the shape of local detection cluster is not available, the best window size is unavailable. From Fig. 8, we see that when the window size varies from 4 to 7, the detection probabilities do not exhibit a significant change. In other words, the scan statistic has a certain amount of robustness in window size selection.
72
Fig. 7. A comparison of ROCs for scan statistic and CRT at different SNRs in and . a Bernoulli sensor field, where
Fig. 8. The system-level probability of detection as a function of window size for scan statistic in a Bernoulli sensor field, where , , and SNR 5 dB.
IEEE JOURNAL OF OCEANIC ENGINEERING, VOL. 37, NO. 1, JANUARY 2012
Fig. 9. A comparison of ROCs for scan statistic and CRT at different SNRs in and . a Poisson sensor field, where
Fig. 10. The system-level probability of detection as a function of window for scan statistic in a Poisson sensor field, where , size , and SNR 5 dB.
C. Poisson Sensor Fields With Different Densities B. Poisson Sensor Field With Fixed Density This section compares the detection performance of the CRT and the scan statistic for a Poisson sensor network. The sensor band shares the same coverage as that in the previous example. The number of sensors is a Poisson variable with density parameter . The sensor field is sliced into rectangles, and each with size 50 250 m . The acoustic source and the target setup under hypothesis are the same as in Section VI-A. Let the local false alarm rate be . Fig. 9 gives the ROCs of those approaches with different SNRs, while Fig. 10 depicts the ROCs for the scan statistic approach with different window sizes at a given SNR. The observations are similar to those of the Bernoulli case.
In Section VI-B, the sensor density is fixed. Here, we are interested in the system-level detection performance with varying . The sensor field’s spatial span and the target location and orientation settings are the same as in Section VI-B. The SNR is 5 dB while the local false alarm rate is . Let the system-level false alarm rate be 0.01; the relationship between the sensor density and system-level probability of detection is shown in Fig. 11. We have the following observations. • The system-level probabilities are increasing functions of for both CRT and the scan statistic. This is not surprising as a higher density means that more sensors would fall in the conical area and report reliable local decisions. • The scan statistic may outperform the CRT for a given sensor density. This coincides with the observation of Section VI-B.
SONG et al.: ACTIVE DETECTION WITH A BARRIER SENSOR NETWORK USING A SCAN STATISTIC
73
not to be major. Some limitations of the proposed method and suggested future research might include the following. • A scan statistic currently desires an identical local false alarm rate—homogeneous clutter. A scan statistic with heterogeneous local false alarm rates is an interesting topic. • This paper utilizes a scan statistic with a single window. Without knowledge of adversary strategy, it is hard to choose an optimal window size. Robust scanning with multiple windows [18] would be an interesting extension, and it may be also a good tool to tackle multiple targets. • This paper suggests the use of a barrier configuration, which forms a narrow rectangular surveillance band in open water. For a given number of sensors, to design the density and the bandwidth to guarantee a large and reliable surveillance span is of practical interest.
Fig. 11. The system-level probability of detection as a function of sensor density in a Poisson sensor field, where , , SNR 5 dB, . and
Fig. 11 may be useful for resource allocation, for example, determining the sensor density for a given performance level. VII. CONCLUSION This paper investigated distributed decision fusion in detecting a sonar target with “barrier” sensor networks. As the reflected signal from some targets such as submarines, unmanned underwater vehicles, and weapons, is aspect dependent, most of the reflected energy would be concentrated within a narrow conical area. If the barrier band is with sufficient length span, only part of its nodes will be significantly affected, particularly at low SNR. Suppose that each sensor performs a local detection with a simple comparison of its matched filter output with a given threshold. In the absence of probabilities of local detection, two approaches were used in fusing those local results: the CRT [8]–[10] and the scan statistic. The CRT does not require sensor location information, and equally weights all the local detections in the system-level calculation. The scan statistic slides a window to pick up the significantly affected area and uses it to make a system-level decision. In other words, the scan statistic utilizes the spatial distribution properties of local detections in decision making, while the CRT does not. Numerical examples showed that scan-statistic-based detection fusion may outperform the CRT at the expense of collecting more information—sensor locations. In this treatment, environmental effects have been idealized: cylindrical spreading and no medium-caused distortion, plus a Butterworth beampattern. A fortunate feature of the scan statistic is that to relax these has no effect whatsoever on the false alarm rate. A dilution (caused by propagation effects or target mismodeling) of the region of activated sensors within the barrier will somewhat affect the local probabilities of detection. However, as a scan statistic requires neither the propagation nor the target model in detection fusion, we would expect this
APPENDIX CALCULATION OF
AND
This part briefly outlines an iterative procedure to calculate two basic quantities, and , in approximating the system-level false alarm rate of scan statistic [19]. Let be the event pdf. Specifically, for the Bernoulli sensor field, we have , while for the Poisson case. Define as the pdf threshold (29) and then we can initialize the procedure with (30)
otherwise For , the instrumental variables recursively calculated with
can be
(31) otherwise. Once
’s are obtained,
can be obtained via (32)
With (32), we can also get can be calculated via
’s. Specifically,
(33) Note that this procedure is general, and it does not depend on . the distribution of
74
IEEE JOURNAL OF OCEANIC ENGINEERING, VOL. 37, NO. 1, JANUARY 2012
REFERENCES [1] R. J. Urick, Principles of Underwater Sound, 3rd ed. New York: McGraw-Hill, 1983. [2] S. Zhou and P. Willett, “Submarine location estimation via a network of detection-only sensors,” IEEE Trans. Signal Process., vol. 55, no. 6, pp. 3104–3115, Jun. 2007. [3] H. Van Trees, Detection, Estimation, and Modulation Theory, Part III: Radar-Sonar Signal Processing and Gaussian Signals in Noise, 1st ed. New York: Wiley, 2001. [4] D. Abraham, “Distributed active sonar detection in dependent -distributed clutter,” IEEE J. Ocean. Eng., vol. 34, no. 3, pp. 343–357, Jul. 2009. [5] S. Coraluppi, “Multistatic sonar localization,” IEEE J. Ocean. Eng., vol. 31, no. 4, pp. 964–974, Oct. 2006. [6] S. Barr, B. Liu, and J. Wang, “Barrier coverage for underwater sensor networks,” in Proc. MILCOM Conf., San Diego, CA, Nov. 2008, CD-ROM. [7] Z. Chair and P. Varshney, “Optimal data fusion in multiple sensor detection systems,” IEEE Trans. Aerosp. Electron. Syst., vol. 22, no. 1, pp. 98–101, Jan. 1986. [8] R. Niu and P. K. Varshney, “Distributed detection and fusion in a large wireless sensor network of random size,” EURASIP J. Wireless Commun. Netw., no. 4, pp. 339–349, 2005. [9] R. Niu and P. K. Varshney, “Performance analysis of distributed detection in a random sensor field,” IEEE Trans. Signal Process., vol. 56, no. 1, pp. 339–349, Jan. 2008. [10] R. Niu and P. K. Varshney, “Joint detection and localization in sensor networks based on local decisions,” in Proc. Asilomar Conf. Signals Syst. Comput., Pacific Grove, CA, Oct. 2006, pp. 525–529. [11] J. Glaz, J. Naus, and S. Wallenstein, Scan Statistics. New York: Springer-Verlag, 2001. [12] J. Glaz, V. Pozdnyakov, and S. Wallenstein, Scan Statistics Methods and Applications. Cambridge, MA: Birkhauser, 2009. [13] M. Guerriero, P. Willett, and J. Glaz, “Distributed target detection in sensor networks using scan statistics,” IEEE Trans. Signal Process., vol. 57, no. 7, pp. 2629–2639, Jul. 2009. [14] C. Rago, P. Willett, and Y. Bar-Shalom, “Detection-tracking performance with combined waveforms,” IEEE Trans. Aerosp. Electron. Syst., vol. 34, no. 2, pp. 612–624, Apr. 1998. [15] N. Mukhopadhyay, Probability and Statistical Inference, 1st ed. New York: Marcel Dekker, 2000. [16] M. Guerriero, L. Svensson, and P. Willett, “Bayesian data fusion for distributed target detection in sensor networks,” IEEE Trans. Signal Process., vol. 58, no. 6, pp. 3417–3421, Jun. 2010. [17] J. Glaz and J. Naus, “Tight bounds and approximations for scan statistic probabilities for discrete data,” Ann. Appl. Prob., vol. 1, no. 2, pp. 306–318, May 1991. [18] J. Glaz and Z. Zhang, “Multiple window discrete scan statistics,” J. Appl. Stat., vol. 31, no. 8, pp. 967–980, Oct. 2004. [19] V. V. Karwe and J. Naus, “New recursive methods for scan statistic probabilities,” Comput. Stat. Data Anal., vol. 23, no. 3, pp. 389–402, 1997.
Xiufeng Song (S’08) received the B.S. degree from Xidian University, Xi’an, China, in 2005 and the M.S. degree from the Institute of Electronics, Chinese Academy of Sciences (CAS), Beijing, China, in 2008, both in electrical engineering. He is currently working towards the Ph.D. degree at the Department of Electrical and Computer Engineering, University of Connecticut, Storrs. His research interests lie in signal processing, detection, and estimation theory.
Peter Willett (S’83–M’86–SM’97–F’03) received the B.A.Sc. degree in engineering science from the University of Toronto, Toronto, ON, Canada, in 1982 and the Ph.D. degree in electrical engineering from Princeton University, Princeton, NJ, in 1986. He has been a faculty member at the University of Connecticut, Storrs, ever since, and since 1998, he has been a Professor. His primary areas of research have been statistical signal processing, detection, machine learning, data fusion, and tracking. He has interests in and has published in the areas of change/abnormality detection, optical pattern recognition, communications, and industrial/security condition monitoring. Dr. Willett is Editor-in-Chief for the IEEE TRANSACTIONS ON AEROSPACE AND ELECTRONIC SYSTEMS, and until recently was an Associate Editor for three active journals: the IEEE TRANSACTIONS ON AEROSPACE AND ELECTRONIC SYSTEMS (for Data Fusion and Target Tracking), the IEEE TRANSACTIONS ON SYSTEMS, MAN, AND CYBERNETICS—PART A: SYSTEMS AND HUMANS, and the IEEE TRANSACTIONS ON SYSTEMS, MAN, AND CYBERNETICS—PART B: CYBERNETICS. He is also an Associate Editor for the IEEE AEROSPACE AND ELECTRONIC SYSTEMS MAGAZINE, an Associate Editor for ISIF’s electronic Journal of Advances in Information Fusion, is a member of the editorial board of IEEE’s Signal Processing Magazine and was the first editor of the IEEE AEROSPACE AND ELECTRONIC SYSTEMS MAGAZINE’s periodic Tutorial issues. He was a member of the IEEE Aerospace and Electronic Systems Society (AESS) Board of Governors (2003–2009). He was General Co-Chair (with S. Coraluppi) for the 2006 ISIF/IEEE Fusion Conference in Florence, Italy, and for the 2008 ISIF/IEEE Fusion Conference in Cologne, Germany, Program Co-Chair (with E. Santos) for the 2003 IEEE Conference on Systems, Man & Cybernetics in Washington DC, and Program Co-Chair (with P. Varshney) for the 1999 Fusion Conference in Sunnyvale, CA.
Joseph Glaz received the Ph.D. degree in statistics from Rutgers University, Piscataway, NJ, in 1978. He is the Professor, Director of Graduate Programs, and Associate Head, Department of Statistics, University of Connecticut, Storrs. His areas of research interest include geometrical probability, parametric bootstrap, scan statistics, sequential analysis, and simultaneous inference. Dr. Glaz was elected Ordinary Member of the International Statistical Institute in 1996, Fellow of the American Statistical Association in 2000, and Fellow of the Institute of Mathematical Statistics in 2009. He is a recipient of the Abraham Wald Prize in Sequential Analysis in 2006 and the AAUP Excellence in Research Award in 2008. He is the Editor-in-Chief of a scientific journal Methodology and Computing in Applied Probability, published by Springer.
Shengli Zhou (SM’11) received the B.S. and M.Sc. degrees in electrical engineering and information science from the University of Science and Technology of China (USTC), Hefei, China, in 1995 and 1998, respectively, and the Ph.D. degree in electrical engineering from the University of Minnesota (UMN), Minneapolis, in 2002. He was an Assistant Professor with the Department of Electrical and Computer Engineering, University of Connecticut (UCONN), Storrs, in 2003–2009, and now is an Associate Professor. He holds a United Technologies Corporation (UTC) Professorship in Engineering Innovation (2008–2011). His general research interests lie in the areas of wireless communications and signal processing. His recent focus is on underwater acoustic communications and networking. Dr. Zhou served as an Associate Editor for the IEEE TRANSACTIONS ON WIRELESS COMMUNICATIONS from February 2005 to January 2007 and the IEEE TRANSACTIONS ON SIGNAL PROCESSING from October 2008 to October 2010. He is now an Associate Editor for the IEEE JOURNAL OF OCEANIC ENGINEERING. He received the 2007 Office of Naval Research (ONR) Young Investigator award and the 2007 Presidential Early Career Award for Scientists and Engineers (PECASE).