Adaptive Behaviour based on Evolving Thresholds with Feedback. Tom De Wolf*, Tom Holvoet*. [Tom.DeWolf,Tom.Holvoet]@cs.kuleuven.ac.be. *DistriNet ...
Adaptive Behaviour based on Evolving Thresholds with Feedback Tom De Wolf? , Tom Holvoet? [Tom.DeWolf,Tom.Holvoet]@cs.kuleuven.ac.be ?
DistriNet, Dept of Computer Science, Katholieke Universiteit Leuven Celestijnenlaan 200A, B-3001 Heverlee (Leuven), Belgium
Abstract In this paper, we propose a model for dynamic task selection based on an evolving threshold mechanism. The threshold evolves based on statistical reinforcement with experience the agent gets from positive and negative feedback. This gives a model where the task selection is tightly coupled with the real success of the tasks and with the perceptions of the agent in the form of stimuli. An example and experiment in the context of ant simulation shows that the agent adapts itself in a flexible way, and at the same time uses experience to achieve a simple kind of specialisation.
1 Introduction In this paper we consider behaviour-based situated agents (Wooldridge and Jennings, 1995), (Wooldridge, 2002), (Ferber, 1999). An agent is an autonomous entity situated in an environment. An agent perceives the environment to a limited extent without maintaining an internal model of the environment. An agent is reactive to changes in this environment by adapting its behaviour to the current needs. The behaviour of an agent is determined by the tasks the agent executes. A task is composed of actions the agent executes in a certain order, such as moving one step ahead or picking up an object. To make the behaviour of an agent adaptive we need dynamic task selection. Dynamic task selection allows agents to adapt their behaviour at run-time by selecting a new task. A task can not be too coarse-grained because of flexibility. For example when simulating ants, ‘forage’ is too coarsegrained where ‘follow pheromone trail’ and ‘return food to nest’ can provide the required flexibility. In this paper we propose a model for dynamic task selection combining work from (Bonabeau et al., 1999) and (Maes and Brooks, 1990). Bonabeau et al. (1999) describe a evolving stimulus-threshold mechanism. Instead of just increasing and decreasing the threshold as in (Bonabeau et al., 1999), our model uses a measure for relevance of a task based on positive and negative feedback from (Maes and Brooks, 1990). Due to feedback the threshold evolves. Therefore our model is stronger related to the success of the behaviour of an agent. This model allows the agent to adapt itself in a flexible way based on its perceptions, and at the same time uses experience to achieve a simple kind of specialisation. The evolution of the threshold is related to sub-symbolic learning. First we describe stimuli as the information that agents use for the dynamic task selection. Then the selection mechanism itself is explained. After that some experi-
ments are described and we end with a conclusion.
2 Stimuli An agent selects a task based on information from the environment and based on experience. We call both forms of information stimuli . A stimulus has a certain type and an intensity to indicate how strong the stimulus is. Note that for each type of stimulus there can be multiple instances (e.g. multiple food items). The first form of information are external stimuli. There are three kinds of external stimuli (Schelfthout and Holvoet, 2002): (1) environmental stimuli that are not put in the environment by agents (e.g. a food source), (2) direct stimulus by interaction with another agent (e.g. touching each other), (3) stigmergic (Grass´e, 1959) stimuli, i.e. communication from other agents through the environment. An example of the latter in the context of ants are the pheromones that are laid down by one individual. The other ants may respond to these at a later time. In general we can see stigmergic stimuli as marks that agents leave behind for other agents. The second form of information are internal stimuli that serve as an internal feedback mechanism, generated by the agent itself. While executing a task, the agent determines the type of stimulus (positive or negative feedback) and the intensity of these internal stimuli. The type and intensity of the feedback can vary at each step in a task. For example, when an agent is following a trail of pheromones a smaller intensity is set for the positive feedback when approaching the trail than when the agent is already on the trail. A positive feedback reflects a partially or fully successfully executed task and it is useful to choose this task again. A negative feedback can be generated to indicate that the task was not appropriate or failed to execute. These stimuli are taken into account the next time the agent must select a task to execute.
We use the notion of relevant stimuli for a task to describe which stimuli influence which tasks. The more relevant stimuli present at a certain moment in time for a task and the higher their intensity, the higher the probability that the task will get active.
3 The Selection Mechanism An agent uses the selection mechanism each time the agent has finished executing one primitive action of a task. This way the agent can adapt after every primitive action. As input the mechanism gets the current stimuli1 and as output the mechanism gives the task that is most appropriate at this moment. If this is the same task as the previous one the agent remembers how much of the task was executed already and continues to complete the task with an extra step, the next primitive action. If it is another task, this task is executed from the beginning. We use a response threshold model to decide which task is most appropriate for the agent. As shown in (Bonabeau et al., 1999; Schelfthout and Holvoet, 2002), threshold models are very adaptive and give good results. On the one hand, a threshold value is associated with every task. On the other hand, a stimulus value is computed for each task, based on the current relevant stimuli. Thresholds refer to likelihood of reacting to relevant stimuli for that task. Low-threshold tasks are performed at a lower level of the stimulus value than high-threshold tasks. The specialisation in a certain task stems from the evolution of thresholds according to received feedback stimuli from previous experience. Defining the mechanism requires an answer to the following questions: (a) How do we compute the thresholds, and how do the thresholds evolve? (b) How do we compute the stimulus value? (c) How do we choose the most appropriate task based on those values? We elaborate on each question in the following paragraphs.
3.1
Evolution of Thresholds
The evolution of thresholds generates differentiation in task performance in a multi agent system composed of initially identical entities. Task allocation in this case is emergent and more robust with respect to perturbations of the system than when the thresholds are fixed. In Bonabeau et al. (1999) a threshold is increased when the task is not active and decreased when active. The authors do not consider feedback. This way a threshold can get saturated and a task that is active but fails still gets a positive effect in the form of a decreasing threshold. Our approach introduces the concept of a statistical reinforcement to compute the threshold values. The method is based on positive and negative feedback stimuli in relation to the fact if a task is active or not. Maes and Brooks (1990) propose a method to calculate the relevance of a 1 perceptions,
internal feedback, ... that are present at this moment
task at a certain moment. A relevant task is defined as ’a task that is positively correlated to positive feedback and not positively correlated to negative feedback’. Table 1: Statistics for one task Positive Feedback No Positive Feedback Negative Feedback No Negative Feedback
Active j l jn ln
Not Active k m kn mn
Table 1 shows the statistics that are maintained for each task. For example, j is the number of times positive feedback occurred when the task was active. All the values are initialised at a certain value X (for example X=10). Each time the statistics are updated all numbers are multiplied with X/(X + 1). This multiplication ensures that the impact of past experiences on the statistics is less than the impact of more recent experiences and the form of the factor has a smooth evolution as result. For example, if a positive feedback occurred when the task was active j is increased with 1 after the multiplication, so j = (jold ∗ X/(X + 1)) + 1. A value like k that is not increased gets the value kold ∗ X/(X + 1). X acts as a parameter to control how adaptive the behaviour of the agent is. The agent adapts more quickly for a small value of X, and slower when it is large. Also, this multiplication avoids saturation of the thresholds. The relevance of the task at a certain moment in time is computed as follows: relevance = (corr(P, A) − corr(N, A))
(1)
Here, N stands for negative feedback and corr(P, A) is the correlation between occurrence of positive feedback and the fact that the task is active. This correlation is computed as shown in equation (2). corr(P, A) = p
j∗m−l∗k
(m + l) ∗ (m + k) ∗ (j + k) ∗ (j + l) (2) This is a statistical measure (the Pearson product-moment correlation coefficient) for the degree to which the status of the task (active or not active) is correlated with the positive feedback and ranges from -1 to 1. Similarly for corr(N,A). The relevance in (1) then ranges from -2 to 2 meaning that the task is very relevant at that moment when it is close to 2 and not relevant at all when close to -2. In our mechanism the relevance is reflected in the threshold. The threshold is low when the relevance is high. The threshold is expressed in units of stimulus intensity to allow a comparison with the stimulus value. Because we express the stimulus value (see below) or the intensity of the relevant stimuli as a percentage, we also want the thresholds to range from 0% to 100%. The
computations are shown in equation (3). Now we have a threshold that evolves based on the experience the agent gets, i.e. the statistics in Table 1 are updated based on feedback stimuli. threshold = |(relevance + 2) ∗ 25 − 100|
3.2
(3)
choose one of the tasks probabilistically where equation (4) gives the probability of being chosen. The latter is done in Bonabeau et al. (1999) and adds some randomness to the mechanism. In the experiments that follow, we take the task with the highest value for equation (4). This way we can analyse the behaviour of an agent in more detail because we then know what should happen.
Computation of Stimulus Values
The other value we use in our approach is the stimulus value. This value is a measure for the amount of relevant stimuli for a task at a certain moment in time. Multiple relevant stimulus intensities must be combined into one value. We assume that all relevant stimulus types are equally important for a task. The strength of the stimulus value must reflect the presence of all relevant stimulus types and the intensity of each of them. An approach to do this is to use a percentage value. To calculate this percentage, we use a heuristic that only considers the strongest instance of a stimulus type and that heuristic ignores the number of instances (other approaches are possible): We can compare the stimulus value with a large bottle that has to be filled. A full bottle then corresponds to a stimulus value of 100%. As said before, each task has a number of relevant stimulus types. Now let us divide the bottle in as much equal parts as there are relevant stimulus types. For each relevant stimulus type we search for the instance with the strongest intensity in the currently perceived stimuli. This intensity also ranges from 0% to 100%. We then take the part of the bottle that corresponds with this stimulus and fill it for as much percent as indicated by the intensity of the strongest stimulus of that type. This way the bottle gets filled until a certain level and the value that corresponds to that level is the stimulus value for that task.
4 Experimental results In this section we first describe the experiment set-up and then the results are given and discussed.
4.1
Experiment Set-Up
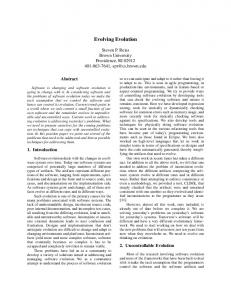
The goal of this experiment is to show that the proposed dynamic task selection approach gives very adaptive agents. We have made an ant-simulation and in this experiment we consider a single agent or ant in terms of the stimulus value, the evolving threshold and the resulting probability. The ant starts from the nest and at an equal distance there are four piles of food, 10 food items each. The initial situation is shown in Figure 1(a). We used 4 piles to make sure that the agent will find one of them in a relatively short time. The results that are described later limit themselves to getting one of those piles completely back to the nest. This way we can see the agent finding the food, returning it to the nest while laying a pheromone trail and following the trail back to the food to get another food item. Figure 1(b) shows a trail from the nest to the food pile. Figure 1: The Experiment Set-Up Food
3.3
Food
Food
Food
Making an optimal decision
A final issue that needs explanation is how the threshold is compared with the stimulus value, yielding, for each task, a probability of becoming active. For each task a probability is computed as in equation (4), where s is the stimulus value and th is the threshold.
pheromones
Agent
Agent
Nest
Food
Nest
Food
Food
Food
2
probability =
s2
s + th2
(4) (a) Start of the experiment
This probability ranges from 0 to 1. When the stimulus value exceeds the threshold value the probability will be high and close to 1. When the stimulus value does not exceed the threshold, the formula makes sure that when there are stimuli for the task, this task still has a probability to become active but it is much smaller and close to 0. When the stimulus value equals the threshold the probability is 1/2. Therefore, individuals with a lower threshold are likely to respond to a lower stimulus value. A task is chosen to execute with respect to these probabilities. We can choose the task with the highest probability or we can
(b) Trail of pheromones
The role of the ant in this experiment is to ’Forage’ and the way we have split this role up into flexible tasks is shown in Table 2. Each task does one action each execution cycle. For example, for Search each cycle the agent moves one step in a random direction. Table 2 also shows the relevant stimuli for each task that are used to calculate the stimulus value. In the description column the task is roughly described and you can see that it depends on the
Task Search Return
Follow
Relevant Stimuli PositiveFeedbackStimulus, ForceDefaultTaskStimulus PositiveFeedbackStimulus, FoodStimulus
PositiveFeedbackStimulus, FoodPheromoneStimulus
Description The agent walks around randomly, searching for food. Always returns negative feedback because it is better to do other things when possible. When there is food, the agent approaches the food (=positive feedback 50%) and then picks it up and returns to the nest while laying a trail (=positive feedback 100%). A negative feedback is given at the end, when the nest has been reached to indicate that it is now better to do other tasks. When there is FoodPheromone it approaches the strongest pheromone and follows the trail of that pheromone towards the food (= positive feedback 100%). A negative feedback is given at the end of the trail to indicate that the trail has been followed completely and thus other tasks may be more appropriate.
Table 2: The tasks for the Forage role and their relevant stimuli
stage of the task what feedback is given to the agent for adjusting its thresholds. The results shown here are also valid in the case of multiple agents because interactions are considered as stimuli and the experiment shows that the task selection mechanism reacts very well on stimuli, and thus also on interactions. In the case of a conflict, e.g. picking up the same object, one of the two agents will be first and the other agent sees that a stimulus is not there anymore.
4.2
Results
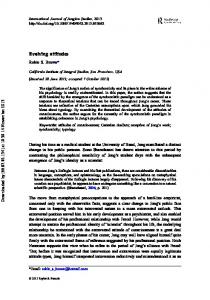
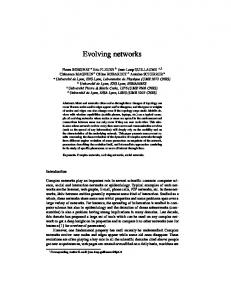
Figures 2,3 and 4 show the evolution of the stimulus value, the threshold and the resulting probability in that order. On the horizontal axis you can find the iteration number. In the following detailed description of the experiment we refer to these numbers. Iteration 1-272. The first 272 iterations the agent is executing Search every two iterations. The first iteration the agent tries to choose a task and because there are no relevant stimuli present no choice is made and a ForceDefaultTaskStimulus is generated. The next iteration this ForceDefaultTaskStimulus is one of the two relevant stimuli for Search. This results in an increase in the stimulus value of Search (figure 2). Because the Search task gives negative feedback each iteration it is active the threshold of Search will increase and the thresholds of Follow and Return will decrease the next iteration. This repeats itself every two iterations until the agent can choose another task. The result is an oscillation of the stimulus amount of Search (figure 2), the thresholds (figure 3) and the probability of Search (figure 4). Iteration 273-285. At iteration 273 the food pile is in the limited vision of the agent. This means that there are 10 instances of FoodStimulus and these are relevant for Return. The next iteration Return is executed by moving one step towards the food and this gives a positive feedback of 50% intensity. These two iterations (273274) result in an increasing stimReturn line in Figure 2
until 62.5% and the positive feedback also has an influence on the thresholds (figure 3): thSearch and thFollow increase because they are less relevant and thReturn decreases. This is also reflected in a higher probability for Return (figure 4). The agent continues to approach the food and reaches it at iteration 285. At that iteration it picks up one Food item and increases the intensity of the returned positive feedback to 100%. This results in a increase of the stimulus value for Return at iteration 285 in Figure 2, a little increase in probability in Figure 4 and the threshold is not influenced by the intensity of the feedback and gets the normal increase as a result of the presence of the positive feedback. Iteration 286-298. After picking up the food the next step in Return is to return to the nest and lay a trail of pheromones while returning. The agent starts with laying pheromones at iteration 286 as shown in the increase of the stimulus value for Follow in figure 2 (FoodPheromoneStimulus is relevant for this task). Because the threshold of Follow has increased due to the positive feedbacks while it was not active this stimulus value is not strong enough to exceed its threshold and the probability increases but stays close to 0. This way the agent continues to lay its trail to the nest. At iteration 297 the agent loses sight of the food and so the stimulus value of Return decreases. At iteration 298 the agent reaches the nest, puts down the food in the nest and generates a negative feedback to indicate that Return is completed and probably not useful anymore. The stimulus value for Return decreases, the threshold for Return increases and the thresholds for Follow and Search decrease. This gives a higher probability to Follow (figure 4) and the agent starts following the trail that is present. Iteration 299-311. At iteration 299 Follow generates positive feedback for itself because the ant is following the pheromones successfully. This gives an increase in the stimulus value (figure 2), an extra decrease in the thresh-
old (figure 3) and an extra increase in the probability (figure 4) for Follow. This also gives an increase in the thresholds of the other two tasks. At iteration 300 the ants can see the food pile again so there is an increase in stimulus value and in probability for Return as shown in figures 2 and 4. Until iteration 310 the agent continues to follow the trail. In the mean time, figure 2 shows that the stimulus value for Follow decreases gradually anyway and this is a result of the evaporation of the pheromones. The pheromones disappear gradually so old information disappears, eventually old paths to food will disappear. At iteration 310 the end of the trail is reached and results in no more positive feedback (decrease in stimulus value) and in negative feedback for Follow (increasing threshold and decreasing probability). Because of this the thresholds of the other two tasks decrease and because there are relevant stimuli for Return (FoodStimulus) the present probability increases even more. This results in the execution of Return starting from iteration 311.
we have no intention to state that this is the best granularity. A second issue is related to the calculation of the stimulus value. Future work must be done on how to incorporate the number of instances of a stimulus type into the value. Nevertheless, as experiments show, it works very well. De Wolf et al. (2002); De Wolf and Jaco (2001-2002) show that we can even use this approach in an hierarchical setting where we first choose the wanted higher level task (Forage, Nurse, ...) and then choose within that higher level task the wanted lower level task (Search, Follow, ...). The advantages of this model are that the agent can adapt itself in a flexible way, and at the same time use experience to achieve a simple kind of specialisation.
Iteration 312-End. From this point on the whole story starts again and repeats itself 10 times, one for each food item, until iteration 550. At that point the last food item has been returned to the nest and because the nest is reached a negative feedback is generated for Return. Then the only stimuli present are FoodPheromoneStimuli from the remaining trail and thus Follow is executed. At the end of the trail (iteration 558) a negative feedback is generated so the stimulus amounts decrease, the threshold increases and the probability decreases. Again the only stimuli are FoodPheromoneStimuli and Follow is executed again. The agent repeats this until the trail has disappeared completely and this results in an oscillation of the stimulus value for Follow, the thresholds and the probability for Follow. At iteration 556 the trail is completely gone and no stimuli are left. A ForceDefaultTaskStimulus is generated and again the agent starts executing Search every two iterations.
T. De Wolf and L. Jaco. Multi-agent systems: a world for ants. Master’s thesis, Department of Computer Science, KULeuven, 2001-2002.
5 Conclusion In this paper, we propose a model for dynamic task selection based on a threshold mechanism. Statistical reinforcement makes the threshold evolve. This approach is based on (Bonabeau et al., 1999) but the threshold evolution is based on positive and negative feedback, as described in (Maes and Brooks, 1990). The added value with respect to (Bonabeau et al., 1999) is that the threshold is more tightly coupled with the real success of the current task. The added value with respect to (Maes and Brooks, 1990) is that we compare the relevance/threshold with a stimulus value based on the agents perceptions. Some issues are left open in this paper. A first issue to consider is how to specify what tasks are for a certain problem. In this paper some guidelines where given but
References E. Bonabeau, M. Dorigo, and G. Theraulaz. Swarm Intelligence: From Natural to Artificial Systems. Oxford University Press, 1999.
T. De Wolf, L. Jaco, T. Holvoet, and E. Steegmans. A nested layered threshold model for dynamic task allocation. In M. Dorigo et al., editor, Proceedings ANTS 2002, LNCS 2463, pages 290–291, 2002. J. Ferber. Multi-Agent Systems: An Introduction to Distributed Artificial Intelligence. Addison Wesley, 1999. P.P. Grass´e. La reconstruction du nid et les coordinations inter-individuelles chez bellicositermes netalensis et cibutermes sp, la th´eorie de la stigmergie: Essai d’interpr´etation des termites constructeurs. Insect Sociaux, 6:41–83, 1959. P. Maes and R. A. Brooks. Learning to coordinate behaviors. In AAAI-90, Proceedings of the 8th National Conference on Artificial Intelligence, volume 2, pages 796–802, 1990. K. Schelfthout and T. Holvoet. To do or not to do: The individual’s model for emergent task allocation. In D. Kudenko E. Alonso and D. Kazakov, editors, Proceedings of the AISB’02 Symposium on Adaptive Agents and Multi-Agent Systems, pages 111–115. The Society for the Study of Artificial Intelligence and Simulation of Behaviour, 2002. M. Wooldridge. An Introduction to MultiAgent Systems. Wiley, 2002. M. Wooldridge and N.R. Jennings. Intelligent agents: Theory and practice. Knowledge Engineering Review, 10(2), June 1995.
probability
percent
535 538 541
312 315
321 324 327 330 333 535 538 541
544
544
547
547
550
550
550
553
553
553
556
556
556
559
559
559
562
562
562
565
565
565
568
568
568
571
571
571
574
574
574
544 547
100
541
333
309
318
stimFollow
538
330
thFollow
chanceFollow
535
327
306
90
333
324
303
stimSearch
330
321
300
time
327
thSearch
324
318 time
time
chanceSearch
321
315
297
80
318
312
294
70
315
thReturn
312
309
291
stimReturn
309
306
288
60
306
303
285
50
303
300
282
40
297
297
279
30
294
294
276
20
291
273
10
291
0
288
270
Figure 2: Stimulus Amount over time
288
90
285
80
285
70
282
60
282
percent 50
279
40
279
30
276
20
273
276
Figure 3: Threshold over time
273
10
0
1
0,9
0,8
0,7
0,6
0,5
0,4
0,3
0,2
0
0,1
270
300
chanceReturn
Figure 4: Probability over time
270