28
IEEE TRANSACTIONS ON SUSTAINABLE ENERGY, VOL. 2, NO. 1, JANUARY 2011
Adaptive Control of a Wind Turbine With Data Mining and Swarm Intelligence Andrew Kusiak, Member, IEEE, and Zijun Zhang, Student Member, IEEE
Abstract—The framework of adaptive control applied to a wind turbine is presented. The wind turbine is adaptively controlled to achieve a balance between two objectives, power maximization and minimization of the generator torque ramp rate. An optimization model is developed and solved with a linear weighted objective. The objective weights are autonomously adjusted based on the demand data and the predicted power production. Two simulation models are established to generate demand information. The wind power is predicted by a data-driven time-series model utilizing historical wind speed and generated power data. The power generated from the wind turbine is estimated by another model. Due to the intrinsic properties of the data-driven model and changing weights of the objective function, a particle swarm fuzzy algorithm is used to solve it. Index Terms—Adaptive control, blade pitch angle, data mining, electricity demand simulation, generator torque, neural networks, optimization, particle swarm fuzzy algorithm, power prediction.
I. INTRODUCTION HE growing awareness of climate change, the environment, fuel supply uncertainty, and raising energy costs have elevated interest in renewable energy. As one of the most viable sources of renewable energy, wind power is undergoing rapid expansion. Although wind energy research has expanded in scope to cover domains such as, for example, wind energy conversion [1], [2], the design of wind turbines [3], [4], the condition monitoring of wind turbines [5], [6], reliability studies [7]–[9], and the design of wind farms [10], [11], numerous challenges are ahead as large-scale wind technology is new and is likely to be further developed. The cost of producing electricity from the wind is intricately related to the successful development and commercialization of wind turbines. One meaningful way to reduce the cost is to maximize the power generated from a wind turbine. Numerous approaches to increase power output by optimizing the power coefficient have been published in the literature. Boukhezzar et al. [12] designed a nonlinear controller for optimizing the power of the DFIG generator [12]. Wang et al. [13] investigated an intelligent maximum power extraction algorithm to improve the performance of wind turbine systems
T
Manuscript received January 09, 2010; revised August 05, 2010; accepted August 27, 2010. Date of publication September 02, 2010; date of current version December 15, 2010. This work was supported by the Iowa Energy Center under Grant 07-01. The authors are with the Intelligent Systems Laboratory, The University of Iowa, Iowa City, IA 52242 USA (e-mail:
[email protected]). Color versions of one or more of the figures in this paper are available online at http://ieeexplore.ieee.org. Digital Object Identifier 10.1109/TSTE.2010.2072967
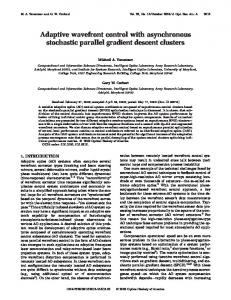
[13]. Munteanu et al. [14] designed two control loops to optimize power at low frequency and high frequency scenarios [14]. However, in the previous research, the investigation of another beneficial avenue to reduce the cost of producing wind power, reducing the cost of wind turbine operation and maintenance, is limited relative to power optimization. Senjyu et al. [15] studied the impact of limited activation of the blade pitch angle on the power output [15]. Kusiak et al. [16] developed a framework of anticipatory control for optimization of wind turbine performance expressed in four different metrics [16]. Although the published literature offers valuable insights into performance optimization of wind turbines by considering multiple objectives, determining the importance of each objective in response to changing wind conditions is an open issue. In this paper, an adaptive approach to wind turbine control is presented. It is designed to achieve a balance between power optimization and smooth drive train control in response to the changes in wind speed and electricity demand. The smoothing of the drive train is accomplished by minimizing the torque ramp rate rather than controlling the rotor speed presented in [16]. The former reduces extreme loads, which translates into a lower maintenance and operation cost. To model the turbine, a data-driven approach is introduced. To realize the adaptive turbine control, estimates of future electricity demand and wind power to be produced at the same time are desired. A time-series model extracted by a data-driven approach predicts the future wind power. A simulation model is used to generate the future demand due to the lack of demand data in this research. Supervisory Control and Data Acquisition (SCADA) data from turbines installed at a large wind farm (150 MW) have been used in this research. To develop and validate the models proposed in this research, 0.1-Hz (10-s) data from three randomly selected wind turbines are used. II. PROBLEM FORMULATION A. Adaptive Control The framework of adaptive wind turbine control is illustrated in Fig. 1. In this paper, a wind turbine is optimized subject to the following two objectives: power maximization and minimization of the torque ramp rate. A weighted linear combination of the two objectives is used in the bi-objective optimization model. The values of two weights are impacted by the amount (excess or deficit) of the generated power and the projected power demand. As illustrated in Fig. 1, three models, the wind turbine power generation model, the wind power prediction model, and the
1949-3029/$26.00 © 2010 IEEE
KUSIAK AND ZHANG: ADAPTIVE CONTROL OF A WIND TURBINE WITH DATA MINING AND SWARM INTELLIGENCE
29
TABLE I DATA DESCRIPTION
the noncontrollable and controllable parameters, as shown in the following: (1)
Fig. 1. Framework of adaptive wind turbine control.
electricity demand model, are established to realize the adaptive control framework. The wind power prediction model and the electricity demand model are utilized as references in determining values of the weights of the objectives. The wind turbine power generation model aims to accurately estimate the power generated from a wind turbine with the control settings. Establishing accurate models of power generation and power prediction is challenging, and in this paper, it is accomplished with data-mining algorithms that have been successfully applied in other domains, e.g., industry and service [17], [18]. The energy of the wind and the electricity demand are variable, and therefore, the weights assigned to the two corresponding objectives need to be adjusted accordingly. A novel optimization algorithm, the Particle Swarm Fuzzy Algorithm, is developed to determine the weights of the two objectives and solve the optimization model that is composed of data-driven models developed in this paper. Two controllable parameters, blade pitch angle and generator torque, are the solution to the optimization problem, and they are considered the recommended settings for the control system of a wind turbine to manipulate wind turbines. To maintain good quality of data-driven models, a relearning scheme is applied to the models using the continuously collected data.
where is the current time, represents the sampling time of is the function describing the wind data (10-s data), and turbine energy conversion process learned by the data-mining algorithms. 1) Algorithm Selection: To build the model (1), the following seven data-mining algorithms have been considered: neural network [19]–[21], neural network ensemble [22], -nearest neighbor [23], support vector machine [24], [25], boosting tree (regression) [26], [27], classification and regression tree [28], and random forest (regression) [29]. Table I describes the industrial data selected from three wind turbines to conduct the research discussed in this paper. The data are partitioned into three datasets: training dataset, test dataset, and validation dataset. Turbine 1 provides the training and test datasets, and the data from Turbines 2 and 3 are used to validate the models derived by various data-mining algorithms. The training dataset is used to extract models by the data-mining algorithms. The test dataset is applied to test the accuracy of the models and selection of the best-performing data-mining algorithm. The validation dataset examines the robustness of the data-driven model established by the selected algorithm. The four metrics (2)–(5), the mean absolute error (MAE), the standard deviation of mean absolute error (SD of MAE), the mean absolute percentage error (MAPE), and the standard deviation of mean absolute percentage error (SD of MAPE), are applied to evaluate the performance of the data-driven models (2)
(3)
B. Wind Turbine Power Generation Model The power conversion of a wind turbine is represented by the , where represents the wind speed (non4-tuplet controllable parameter), is the generator torque (controllable parameter), is the blade pitch angle (controllable parameter), and is the power generated by the wind turbine (response parameter). The value of the response parameter is impacted by
(4)
(5)
30
IEEE TRANSACTIONS ON SUSTAINABLE ENERGY, VOL. 2, NO. 1, JANUARY 2011
TABLE II TEST RESULTS OF THE MODELS DERIVED BY SEVEN DATA-MINING ALGORITHMS
TABLE IV TEST RESULTS OF POWER PREDICTION BY DATA-DRIVEN MODELS
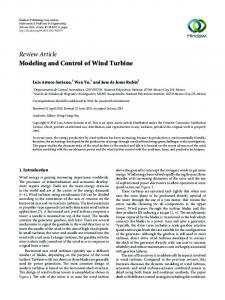
accuracy reported in Table II, it is still impressive considering that the model was built from the data generated at Turbine 1 and tested on Turbines 2 and 3. C. Wind Power Prediction Model To determine wind turbine power at time , the time-series prediction model with the structure presented in (6) is utilized (6) Fig. 2. First 100 points of test results produced by the neural network model.
TABLE III PREDICTION ACCURACY RESULTS PRODUCED BY THE NEURAL NETWORK MODEL
where the notation is the same as in model (1). The time-series prediction model employs the past observed events to determine its future values. In the candidate model (6), the past states of the generated power itself and wind speed at to are considered. A parameter selectime periods tion strategy, the wrapper with a random search approach [30], [31], is applied to select the most significant parameters. The pa, , , , and , are selected, rameters, and model (6) is instantiated as model (7) (7)
Comparative analysis of the test results of the models built by the data-mining algorithms is shown in Table II. The model derived by the neural network algorithm outperforms all models in estimating the power generated by a wind turbine. The corresponding values of MAPE (0.02) and SD of MAPE (0.07) are the lowest in Table II. Thus, the neural network algorithm will be used to construct the wind turbine power generation model. Fig. 2 illustrates the first 100 values of the observed (measured) power and the power predicted by the neural network model. 2) Model Validation: The validation dataset is used here to assess the robustness of the neural network extracted model in Section II-B1. Two validation datasets are used: Dataset 1 is collected from wind turbine 2, and validation dataset 2 is collected from wind turbine 3. The details of the two validation datasets are presented in Table I. The four metrics (2)–(5) are used to assess the accuracy of the power model with the results presented in Table III. The MAPE for validation dataset 1 is 0.05, and the MAPE for validation dataset 2 is 0.03. Although the accuracy of this model tested on two different turbines is lower than the
where the notation is the same as in model (1). 1) Algorithm Selection: The seven data-mining algorithms of Section II-B1 are applied to build power prediction models. The training dataset of Table I is utilized to extract models, and the test dataset (Table I) is used to test their accuracy at time . Table IV presents the test results [expressed with the metrics (2)–(5)] of the power prediction models derived by the seven data-mining algorithms. The neural network and the neural network ensemble provided results with an MAPE of 0.06. However, since the values of MAE, SD of MAE, and SD of MAPE of the neural network ensemble are all smaller than those of the neural network, the neural network ensemble is considered for building the power prediction model. Fig. 3 illustrates the results for the first 100 points of power prediction by the neural network ensemble using validation dataset 1. 2) Model Validation: The validation dataset used in Section II-B2 is used here to assess the robustness of the neural network ensemble model. Table V presents the validation results of this model. Compare the MAPE listed in Tables IV
KUSIAK AND ZHANG: ADAPTIVE CONTROL OF A WIND TURBINE WITH DATA MINING AND SWARM INTELLIGENCE
Fig. 3. First 100 test points of the observed power and the power predicted by the neural network ensemble.
TABLE V TEST RESULTS OF POWER PREDICTION BY DATA-DRIVEN MODELS
31
Fig. 5. Simulated demand data from 7:00 A.M. to 9:00 A.M.
horizontal axis represents the time measured in 10-s intervals, the same as the data frequency used to develop the models in Section II-B. In this model, each demand value is a random number generated from a normal distribution with the mean following the pattern (solid line) in Fig. 4. The standard deviation is arbitrarily fixed at 50. As presented in Fig. 4, the mean demand reflects a scenario where the mean electricity demand is low (200 kW) in the evening after office hours (specifically, 6:00 P.M.) and in the early morning before office hours (specifically, 8:00 A.M.). After 8:00 A.M., the mean demand increases and reaches a maximum at 9:00 A.M.. Between 9:00 A.M. and 5:00 P.M., the mean demand remains constant, and it begins to decline after 5:00 P.M. because the staff leaves the office. This demand model M1 is expressed as (8) if
Fig. 4. Electricity demand pattern of model M1.
if and V. It is obvious that this time-series data-driven model is feasible, and its performance is consistent in power prediction. D. Electricity Demand Simulation Model Modeling electricity demand is outside the scope of this research. In this paper, the electricity demand data has been simulated. One basic demand simulation model is developed to generate daily power demand at 10-s intervals based on the previous literature [32] and the daily electricity consumption by heating ventilating and air conditioning (HVAC) systems. It is known that modeling customer demand is a challenge, as it depends on factors such as the type of buildings, the region size, the time of day, and so on. The demand considered is the net energy of other generation resources. This demand model is established to describe a pattern that simulates the usage of electricity in a micro-grid dominated by business offices (see Fig. 4). The vertical axis of Fig. 4 represents the electricity demand and its maximum of 1500 kW. This arbitrary value of demand should match the generation of a single wind turbine. The
if
(9)
if if where presents the demand data generated from the normal distribution, is the mean of the normal distribution, , , , (8:00 A.M.), (9:00 A.M.), (5:00 P.M.), (6:00 P.M.), (12:00 P.M.), and . In this model, the demand data is generated from a normal distribution (8) and the mean demand computed. For the demand data generated from (8), two constraints (10) and (11) are used to prevent the value of demand becoming negative or exceeding the maximum capacity of the office space (10) (11) Fig. 5 shows a portion of the demand data generated from model (8), (9) from 7:00 A.M. to 9:00 A.M..
32
IEEE TRANSACTIONS ON SUSTAINABLE ENERGY, VOL. 2, NO. 1, JANUARY 2011
E. Optimization Model
III. PARTICLE SWARM FUZZY ALGORITHM (PSFA)
The model considered in this paper maximizes the power generated from a wind turbine and minimizes the generator torque ramp rate. Maximizing the generated power estimated by the model of Section II-B is equivalent to . Here, the difference between the maximum power that could be potentially generated by a wind turbine and the power output from the model is minimized. Two constraints are considered to construct this boundary, the maximum turbine capacity of 1500 kW, and the maximum energy that could be extracted from the [16]. wind according to Betz’s law, expressed as is expressed in The torque ramp rate (12) where is the generator torque at time , is the generator . torque at time As the scales of the two objectives differ, the generated output is scaled as presented in the following:
In this research, a wind turbine is controlled adaptively according to the predicted power generation and the power demand. The two control strategies impact the values of the weights associated with the two objective functions of model (14). To produce the control strategy associated with the model objectives, a particle swarm fuzzy algorithm is developed. The particle swarm fuzzy algorithm involves two phases. In the first phase, the weights of the two objectives are determined by a fuzzy algorithm [33] to ascertain the importance of two objectives (discussed in Section II-E) in the optimization problem based on the predicted power and demand information. This algorithm is expressed by the following: (17) if if if
(18) (19)
(13)
(20)
The biobjective optimization model is expressed in
(14) where is the model’s overall objective; and are the settings of the blade pitch angle and the generator torque at time ; and and are the weights of the two objectives determined by the particle swarm fuzzy algorithm (PSFA) (discussed in Section III). The remaining notation is the same as in (1) and (12). In model (8), two controllable parameters, and , are utilized to realize the adaptive control of the wind turbine. As presented in model (14), to control the wind turbine conservatively, the ranges of the two controllable parameters are expressed in the following: (15) (16) The lower bound ( 0.57) and the upper bound (90.61) for the blade pitch angle that cannot be exceeded are obtained from the industrial data used in this research. In addition, the increment (or decrement) of blade pitch angle is set in the range . The value of the generator torque is expressed in percentage [0, 100], rather than N/m . The adjustment of the generator torque is done at increments (or decrements) in the . range
where is the predicted power and demand from the power prediction model (6) and demand models (9) or (11), respectively; is the membership function; is the weight factor to determine the final weight; is the final weight used in the obis the maximum jective of the optimization model (14). is arbiwind turbine capacity (here 1500 kW) and trarily fixed at 200 kW and expressed in the [0, 1] interval. If the indicates predicted power is less than 200 kW, then that the wind speed is low and the smoothing control of the generator torque is less significant than power maximization. Thus, the weight assigned to the torque smoothing objective in (14) will be close to 0. If customer demand is lower than 200 kW, this implies low energy demand, and the weight assigned to the generated power objective in (14) should be small. The value of indicates that the turbine’s generation capacity has been attained or the demand level is at maximum. If the predicted power is greater or equal to 1500 kW, the control should focus on minimizing the torque ramp rate to prevent the fatigue of the drive train and thus reduce the maintenance cost. The demand, which is greater or equal to 1500 kW, implies a high level energy consumption and power maximization needs to be emphasized. The second phase of the proposed algorithm involves the particle swarm optimization (PSO) algorithm [34]. In the PSO, each particle represents the candidate optimal solutions of , where is a model (14) and can be expressed as at the th iteration, and two-dimensional vector is another two-dimensional vector . The vector represents the position of each particle at iteration , and vector represents the velocity associated with each particle at iteration . The initial value of each dimension of the particle’s is position is generated from a uniform distribution, where and generated from is generated from . The initial values of the particle’s velocity are all set at 0 at
KUSIAK AND ZHANG: ADAPTIVE CONTROL OF A WIND TURBINE WITH DATA MINING AND SWARM INTELLIGENCE
33
TABLE VI TEST RESULTS OF POWER PREDICTION BY DATA-DRIVEN MODELS
the initialization step. The optimization procedure is presented next. , Step 1) Determine the weights of fitness function which is the objective function of model (14) that takes the weights of objectives produced by the fuzzy algorithm. Step 2) Initialize the particle size , the position of each , and its velocity , where particle , , and . Step 3) Initialize the local best for each particle by , and estimate the initial global best by , for and . Step 4) Repeat until the stopping criterion is satisfied . For each particle Step 4.1) Create random vectors and by generating for . Step 4.2) Update the velocities of particles by and update . the particle positions by , if Step 4.3) Update the local best by . , if Step 4.4) Update the global best by . The above algorithm requires parameter initialization. The parameter is an inertial constant [35]. It controls the impact of the previous velocity on the current velocity, and usually it has a value between 0 and 1. It is fixed arbitrarily at 0.5 in this research. Parameters and are two constants that reflect how much the movement of particles is impacted by the local and global best. Both values are arbitrarily fixed at 2 [36]. The PSO algorithm used in this research performs better than the SPEA reported in [16]. The computational time advantage can be tenfold and more. The computational efficiency gain comes from the flight function of the PSO. The performance of the PSO algorithm is presented in Section IV-A2. IV. INDUSTRIAL CASE STUDY A. Single-Point Optimization 1) Description of the Data Point: In this section, the particle swarm fuzzy algorithm is demonstrated for a single data point that has been randomly selected from the test dataset of Table I. This data point is partially illustrated in Table VI. The data in Table VI reflects a scenario where the current power generated from a wind turbine is high and the simulated demand is low. The current settings of two controllable parameters are 76.90 for the generator torque and 1.07 for the blade
Fig. 6. Standardized fitness value.
pitch angle. The particle swarm fuzzy algorithm determines the weights of the objective function and the recommended control settings optimizing the two control objectives, the maximum power and the minimum torque ramp rate. 2) Convergence of the Particle Swarm Fuzzy Algorithm: In this experiment described next, convergence of the particle swarm fuzzy algorithm (PSFA) based on the data point of Table VI is examined. Ten particles are created, and the stopping criterion is set to 1500 iterations. The convergence of the PSFA is evaluated based on the fitness value. To simplify the evaluation procedure, a fitness value every five iterations from 5–100 and the fitness value at iteration 1500 are examined (see Fig. 6). The horizontal axis in Fig. 6 represents the number of iterations, and the vertical axis shows the standardized fitness value expressed as (21) according to the notation of Section III. As shown in Fig. 6, the rapid drop of the standardized fitness value for the global best indicates the quick convergence of the PSFA. In the 1500 iterations, the standardized fitness value drops to 1 at the 50th iteration (converges from 50th iterations) and constantly keeps this value in the following iteration. 3) Optimization Results: The optimization results based on this single point (Table VI) are illustrated in Table VII. The first column of Table VII presents the recommended control strategy for the wind turbine. Here, the power generated is 1139.55 kW (slightly higher than original power output of 1112 kW shown in Table VI). The ramp rate of the generator torque is nearly zero. The two weights indicate the current control preference. Weight-Torque Ramp is 0.97 and Weight-Power is 0.03. The values of the weights indicate that the control preference focuses on the smoothness of the drive train rather than the maximization of the generated power. B. Multipoint Optimization To simulate and demonstrate the adaptive control approach of a wind turbine, the multipoint optimization based on selected data from the test dataset in Table I is introduced. This dataset reflects a scenario where the predicted power (supply) is higher than the demand at the beginning of the period, and then the power demand gradually exceeds the predicted power. It contains 300 data points from 12/30/2008 8:17:20 A.M. to 12/30/
34
IEEE TRANSACTIONS ON SUSTAINABLE ENERGY, VOL. 2, NO. 1, JANUARY 2011
TABLE VII TEST RESULTS OF POWER PREDICTION BY DATA-DRIVEN MODELS
Fig. 7. Convergence speed for six data points.
Fig. 9. Comparison of the optimized torque ramp rate and measured torque ramp rate.
Fig. 8. Estimated weights for two objectives. Fig. 10. Comparison of the optimized and original power.
2008 9:07:10 A.M.. The demand data is generated from the demand model discussed in Section II-D. 1) Stopping Criterion of the PSFA: Before running the multipoint optimization, an experiment is designed to evaluate the stopping criterion for the PSFA. Six data points, indexed as 20, 552, 1020, 1500, 1947, and 3155, are randomly selected from the test dataset of Table I. The PSFA has run 1500 iterations for each point. Fig. 7 illustrates the convergence of the PSFA for the six points. It is obvious that the PSFA converges quickly, most of the time within 60 iterations. However, to be more conservative, the number of iterations that the PSFA needs to run is set to 100. 2) Optimization Results: In this section, the test dataset from 12/30/2008 8:17:20 A.M. to 12/30/2008 9:07:10 A.M. is merged with the demand data generated from demand model. Fig. 8 illustrates the weight values assigned to the two objectives of model (14). As Fig. 8 shows, Weight-Power is initially lower than Weight-Torque Ramp; however, over time Weight-Power dominates Weight-Torque Ramp. Since, in the PSFA, WeightPower and Weight-Torque Ramp are associated with the demand and predicted power, Fig. 8 characterizes the scenario discussed before in Section IV-B. Fig. 9 shows the optimized generator and the measured torque ramp rate.
The optimized power generated from a wind turbine and the original power it produced is illustrated in Fig. 10. Figs. 9 and 10 clearly demonstrate the change in the wind turbine control strategies. As initially predicted, the power generated is higher than the demand; therefore, the wind turbine is controlled for torque smoothness. In this case, a higher weight is assigned to minimizing the generator torque ramp rate. However, the direction of the weights gets changed over time. After the initial period, the control strategy switches to maximizing power in response to the electricity demand gradually exceeds the predicted power. The weight assigned to the power maximization overwhelms the weight of minimizing the torque ramp rate. Due to the trade-off between the two objectives, increase in the torque ramps can be observed. Constraint (14) limits the maximum change of torque ramps. It can be adjusted as needed. Fig. 11 demonstrates that the measured blade pitch angle remains essentially constant at 0.53 . To realize the adaptive control in practice, new set points need to be computed within the data sampling frequency (here 10 s). The computational results with the 10-s data demonstrate that the set points of the torque and the blade pitch angle are usually
KUSIAK AND ZHANG: ADAPTIVE CONTROL OF A WIND TURBINE WITH DATA MINING AND SWARM INTELLIGENCE
Fig. 11. Comparison of the optimized and measured blade pitch angle.
computed within 3 s, which is acceptable. The computational efficiency could be further improved by applying different search strategies and code development techniques. V. CONCLUSION Adaptive control of a wind turbine maximizing power generation and minimizing the torque ramp rate was presented. Data-mining algorithms were utilized to generate nonparametric models of wind turbine power generation and the wind power prediction model. An integrated model with a linear combination of weighted objectives was created. The weights associated with the objectives were estimated based on the predicted power and demand. The demand was generated from two simulation models. A novel optimization approach, the particle swarm fuzzy algorithm (PSFA), was developed to solve the model developed in this paper. Industrial data from three wind turbines of the same type was utilized in this study. The data sampling frequency was 0.1 Hz. The data from one turbine was used to develop and test data-driven models, and the data of two other turbines was employed to validate these models. Comparative analysis of various data-mining algorithms was performed. The convergence and the stopping criterion of the PSFA were investigated. The feasibility of adaptive control of wind turbines was demonstrated. In addition to the two objectives applied in this paper, additional objectives, for example, mitigation of wind turbine vibrations, could be considered. REFERENCES [1] M. Arifujjaman, M. Iqbal, and J. Quaicoe, “Performance comparison of grid connected small wind energy conversion systems,” Wind Eng., vol. 33, no. 1, pp. 1–18, 2009. [2] Ö. Mutlu, E. Akpınar, and A. Balıkcı, “Power quality analysis of wind farm connected to Alaçatı substation in Turkey,” Renewable Energy, vol. 34, no. 5, pp. 1312–1318, 2009. [3] D. Laino, C. Butterfield, R. Thresher, and D. Dodge, “Evaluation of select IEC standard wind turbine design cases on the combined experiment wind turbine model,” Wind Energy, Amer. Soc. Mech. Engineers, Solar Energy Division (Publication) SED, vol. 14, pp. 47–48, 1993. [4] K. Saranyasoontorn and L. Manuel, “A comparison of wind turbine design loads in different environments using inverse reliability techniques,” Wind Energy, vol. 126, no. 4, pp. 1060–1068, 2004. [5] A. Kusiak, H. Zheng, and Z. Song, “On-line monitoring of power curves,” Renewable Energy, vol. 34, no. 6, pp. 1487–1493, 2009. [6] A. Kusiak, H. Zheng, and Z. Song, “Models for monitoring wind farm power,” Renewable Energy, vol. 34, no. 3, pp. 583–590, 2009. [7] A. Leite, C. Borges, and D. Falcão, “Probabilistic wind farms generation model for reliability studies applied to Brazilian sites,” IEEE Trans. Power Syst., vol. 21, no. 4, pp. 1493–1501, Nov. 2006.
35
[8] R. Karki, P. Hu, and R. Billinton, “A simplified wind power generation model for reliability evaluation,” IEEE Trans. Energy Convers., vol. 21, no. 2, pp. 533–540, Jun. 2006. [9] P. J. Tavner, J. Xiang, and F. Spinato, “Reliability analysis for wind turbines,” Wind Energy, vol. 10, no. 1, pp. 1–18, 2006. [10] R. Barthelmie, S. Frandsen, M. Nielsen, S. Pryor, P. Rethore, and H. Jørgensen, “Modelling and measurements of power losses and turbulence intensity in wind turbine wakes at Middelgrunden offshore wind farm,” Wind Energy, vol. 10, no. 6, pp. 517–528, 2007. [11] J. Mora, J. Barón, J. Santos, and M. Payán, “An evolutive algorithm for wind farm optimal design,” Neurocomputing, vol. 70, no. 16, pp. 2651–2658, 2007. [12] B. Boukhezzar and H. Siguerdidjane, “Nonlinear control with wind estimation of a DFIG variable speed wind turbine for power capture optimization,” Energy Convers. Manage., vol. 50, no. 4, pp. 885–892, 2009. [13] Q. Wang and L. Chang, “An intelligent maximum power extraction algorithm for inverter-based variable speed wind turbine systems,” IEEE Trans. Power Electron., vol. 19, no. 5, pp. 1242–1249, Sep. 2004. [14] I. Munteanu, N. Cutululis, A. Bratcu, and E. Ceanga, “Optimization of variable speed wind power systems based on a LQG approach,” Control Eng. Practice, vol. 13, no. 7, pp. 903–912, 2005. [15] T. Senjyu, R. Sakamoto, N. Urasaki, T. Funabashi, H. Fujita, and H. Sekine, “Output power leveling of wind turbine generator for all operating regions by pitch angle control,” IEEE Trans. Energy Convers., vol. 21, no. 2, pp. 467–475, Jun. 2006. [16] A. Kusiak, Z. Song, and H. Zheng, “Anticipatory control of wind turbines with data-driven predictive models,” IEEE Trans. Energy Convers., vol. 24, no. 3, pp. 766–774, Sep. 2009. [17] M. J. A. Berry and G. Linoff, Data Mining Techniques: For Marketing, Sales, and Customer Relationship Management, 2nd ed. New York: Wiley, 2004. [18] S. K. Shevade, S. S. Keerthi, C. Bhattacharyya, and K. R. K. Murthy, “Improvements to the SMO algorithm for SVM regression,” IEEE Trans. Neural Netw., vol. 11, no. 5, pp. 1188–1193, Sep. 2000. [19] H. Siegelmann and E. Sontag, “Analog computation via neural networks,” Theor. Comput. Sci., vol. 131, no. 2, pp. 331–360, 1994. [20] G. P. Liu, Nonlinear Identification and Control: A Neural Network Approach. London: Springer, 2001. [21] M. Smith, Neural Networks for Statistical Modeling. New York: Van Nostrand, 1993. [22] L. K. Hansen and P. Salamon, “Neural network ensembles,” IEEE Trans. Pattern Anal. Mach. Intell., vol. 12, no. 10, pp. 993–1001, Oct. 1990. [23] Shakhnarovish, Darrell, and Indyk, Nearest-Neighbor Methods in Learning and Vision. Cambridge, MA: MIT Press, 2005. [24] B. Schölkopf, C. J. C. Burges, and A. J. Smola, Advances in Kernel Methods: Support Vector Learning. Cambridge, MA: MIT Press, 1999. [25] I. Steinwart and A. Christmann, Support Vector Machines. New York: Springer-Verlag, 2008. [26] J. H. Friedman, “Stochastic gradient boosting,” Comput. Statist. Data Anal., vol. 38, no. 4, pp. 367–378, 2002. [27] J. H. Friedman, “Greedy function approximation: A gradient boosting machine,” Ann. Statist., vol. 29, no. 5, pp. 1189–1232, 2001. [28] L. Breiman, J. H. Friedman, R. A. Olshen, and C. J. Stone, Classification and Regression Trees. Monterey, CA: Wadsworth, Inc., 1984. [29] L. Breiman, “Random forests,” Mach. Learning, vol. 45, no. 1, pp. 5–32, 2001. [30] I. H. Witten and E. Frank, Data Mining: Practical Machine Learning Tools and Techniques, 2nd ed. San Francisco, CA: Morgan Kaufmann, 2005. [31] R. Kohavi and G. H. John, “Wrapper for feature subset selection,” Artif. Intell., vol. 97, no. 1–2, pp. 273–324, 1997. [32] D. J. Swider, “Compressed air energy storage in an electricity system with significant wind power generation,” IEEE Trans. Energy Convers., vol. 22, no. 1, pp. 95–102, Mar. 2007. [33] B. Mirzaeian, M. Moallem, V. Tahani, and C. Lucas, “Multiobjective optimization method based on a genetic algorithm for switched reluctance motor design,” IEEE Trans. Magn., vol. 38, no. 3, pp. 1524–1527, May 2002. [34] J. Kennedy and R. C. Eberhart, “Particle swarm optimization,” in IEEE Int. Conf. Neural Networks, 1995, pp. 1942–1948. [35] Y. Shi and R. Eberhart, “Parameter selection in particle swarm optimization,” in Proc. 7th Annu. Conf. Evolutionary Programming, 1998, pp. 591–600.
36
IEEE TRANSACTIONS ON SUSTAINABLE ENERGY, VOL. 2, NO. 1, JANUARY 2011
[36] M. A. Abido, “Optimal design of power-system stabilizers using particle swarm optimization,” IEEE Trans. Energy Convers., vol. 17, no. 3, pp. 406–413, Sep. 2002.
Andrew Kusiak (M’89) received the B.S. and M.S. degrees in engineering from the Warsaw University of Technology, Warsaw, Poland, in 1972 and 1974, respectively, and the Ph.D. degree in operations research from the Polish Academy of Sciences, Warsaw, in 1979. He is currently a Professor at the Intelligent Systems Laboratory, Department of Mechanical and Industrial Engineering, The University of Iowa, Iowa City. He speaks frequently at international meetings, conducts professional seminars, and does consultation for industrial corporations. He has served on the editorial boards of over 40 journals. He is the author or coauthor of numerous books and technical papers in journals sponsored by professional societies, such as the Association for the Advancement of Artificial Intelligence, the American Society of Mechanical
Engineers, etc. His current research interests include applications of computational intelligence in automation, wind and combustion energy, manufacturing, product development, and healthcare. Prof. Kusiak is an Institute of Industrial Engineers Fellow and the Editor-inChief of the Journal of Intelligent Manufacturing.
Zijun Zhang (S’10) received the B.S. degree (2008) from the Chinese University of Hong Kong, Hong Kong, China, in 2008, the M.S. degree from the University of Iowa, Iowa City, in 2009, and is currently working toward the Ph.D. degree in the Department of Mechanical and Industrial Engineering, The University of Iowa, Iowa City. His research concentrates on data mining and computational intelligence applied to systems modeling, monitoring, and optimization in wind energy and HVAC domains. He is a member of the Intelligent Systems Laboratory at The University of Iowa.