ADAPTIVE SWALLOWING SOUND SEGMENTATION BY VARIANCE DIMENSION Lisa J. Lazareck and Zahra Moussavi Department of Electrical Engineering, University of Manitoba, Winnipeg, Canada, R3T 2N2 E-mail:
[email protected],
[email protected] Abstract: This study examines the use of variance dimension to adaptively segment normal swallowing sound signals. It is speculated that the swallowing sound, non-stationary by nature, may be decomposed into characteristic segments, representing different stages of swallowing mechanism. The variance dimension, a measure of signal complexity, was calculated for each swallow σ using a 25ms window. A threshold greater than µ+σ of the calculated variance dimension was used to detect the peaks of the variance dimensions, which defined the segment boundaries of the swallowing sound. Using Fast Fourier Transform, the power spectrum of each segment was calculated. Then from each spectrum, Fpeak, Fmax, Fmean and Pave were calculated, averaged per category and compared. Each segment was labelled qualitatively as click or non-click. Overall, Fpeak and Pave were higher for click than non-click segments, confirming qualitative observations. The method presented in this paper shows promise in quantifying the swallowing sound signal. Keywords: swallowing sound, adaptive segmentation, variance dimension. Introduction A normal swallow consists of an oral, pharyngeal and esophageal phase. Respectively, the bolus enters the mouth and is consciously pushed toward the back of the throat; involuntarily passes through the epiglottis and into the esophagus; and transfers to the stomach through peristaltic waves [1]. It is speculated that from the opening of the cricoipharynx and return of the epiglottis, “clicking” sounds or “clicks” can be heard [2, 3]. In between the initial and final click, quieter sounds are heard and we refer them as “non-clicks”. Some reproducible characteristic sound patterns have been reported to be heard during auscultation swallows with a stethoscope [4]. Despite the magnitude of the studies in swallowing sound interpretation, to date, there is not a well-accepted theory that explains the physiological cause of swallowing sounds or the characteristic features of a normal swallowing sound. Swallowing sound is a non-stationary signal by nature. To investigate its characteristic features, it is necessary to divide the signal into stationary segments. As a pilot study, this research aimed to adaptively
segment the swallowing sound signal using variance dimension. Fractal dimension is a measurement of the degree of the complexity in a signal. Variance dimension, a type of fractal dimension, is a measurement calculated by analysing the spread of the increments in the signal amplitude in time domain. The spread is indicative of the multifractal richness apparent in the signal; for example, a unifractal object yields a flat line [5]. Variance dimension (Dσ) is computed as follows: D σ = E +1 − H , 1 lo g[ V ar ( ∆S ) ∆t ] , 2 lo g( ∆t ) ∆t →0
H = lim
(1) (2)
where E is the embedding dimension, H is the Hurst exponent and S is the swallowing sound in the time domain [6]. Embedding dimension is the Euclidean description of any object (respectively; a point, line, surface, volume and time-space have dimensions 0, 1, 2, 3 and 4). Lastly, ∆ represents the difference between two adjacent points, either for time ‘t’ or sound ‘S.’ The objective of this study was to use variance dimension to detect the points of chaotic behavior of swallowing sound and therefore segment swallowing sound into some characteristic segments. Materials and Methods The data consisted of twelve normal swallowing sounds from two healthy male subjects, each contributing six swallows. The swallowing sounds were recorded by Siemens EMT 25 C accelerometers placed over the supersternal notch of the trachea. They were amplified, bandpass filtered (30-2500 Hz) and digitized at a 10240 Hz sampling rate. For each swallowing sound, variance dimension was calculated using a running 256-sample (=25ms) size window. A threshold greater than µ+σ of the calculated variance dimension was used to detect the peaks of the variance dimensions. These peaks defined the characteristic segment boundaries of the swallowing sound (see Figure 1). Using Fast Fourier Transform, the power spectrum of each segment was calculated. Then from each spectrum, Fpeak, Fmax, Fmean and Pave were calculated. Fpeak is the frequency corresponding to the maximum signal magnitude, Fmax is the frequency
beyond which the signal amplitude has dissipated to less than 10% of its maximum, and Fmean is the statistical mean frequency. Pave is the average power calculated over several specified frequency bands (see Figure 2). Lastly, each swallowing sound segment was labelled qualitatively as click or non-click segment. Corresponding category features (Fpeak, Fmax, Fmean, Pave) were averaged between the swallows and were compared within the click and non-click segments.
swallowing characteristic frequencies are significantly higher than those of breath sound segment as expected. Table 1: Averaged features computed per category. CLICK
NON-CLICK
Fpeak
(Hz)
816.7 ± 381.5
765.5 ± 83.7
Fmax
(Hz)
2625.8 ± 273.6
2623.0 ± 415.9
Fmean (Hz)
1144.7 ± 166.5
1199.3 ± 172.3
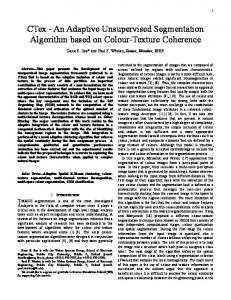
Conclusions Adaptive segmentation by variance dimension, and analysis of resultant segments reveal two distinct swallowing sound categories. The click segments were louder than their non-click counterparts, as indicated by Fpeak and Pave and although Fmax and Fmean do not assist in category differentiation, their comparison with respiratory sounds is quite informative. Overall, the method presented in this paper shows promise in quantifying the swallowing sound signal. Acknowledgments Figure 1: A normal swallowing sound, its variance dimension and segmentation (see boundaries marked as ‘x’). S1, S2, S3 and S4 correspond to click, non-click, non-click, and click segments respectively. Results & Discussion A comparison of category Fpeak and Pave confirms that clicks are louder than non-clicks (as qualitatively observed). Fmax and Pave were slightly higher for click segments than non-click segments (Table 1 and Figure 2 for illustration). Fmax and Fmean yielded similar values for both categories (see Table 1).
Figure 2: Pave calculated for the swallowing sound signal in Figure 1, over frequency bands: (1)140-300Hz, (2) 300-460 Hz, (3) 460-620 Hz, (4) 620-780 Hz, (5) 780-940 Hz, (6) 940-1100 Hz, (7) 1100-1260 Hz. In addition, it is worthy to compare the averaged frequencies of this study with those of tracheal breath sound signal reported in [7]. The averaged Fpeak, Fmax and Fmean were reported to be 300, 700 and 350 Hz for both inspiration and expiration. Our results for
This work was supported by the Natural Sciences and Engineering Research Council (NSERC) of Canada. REFERENCES [1] Firmin, H., Reilly, S., Fourcin, A., “Non-Invasive Monitoring of Reflexive Swallowing,” Univ. College London, Dept. Phonetics & Linguistics; http://www.phone.ucl.ac.uk/home (Nov. 9, 2001). [2] Moussavi, Z., Lecture Notes of Biomedical Engineering Course, Dept. of Electrical Engineering, Univ. of Manitoba, Winnipeg, MB, Canada, 2001. [3] Selley, W.G., Hon F.C.S.T., F.D.S., Flack, F.C., Ellis, R.E., Brooks, W.A., “The Exeter Dysphagia Assessment Technique,” Dysphagia, vol. 4, pp. 227-235, 1990. [4] Dempsey, J.E., Vice, F.L. and Bosma, J.F., Combination of cervical auscultation and videoradiography in evaluation of oral and pharyngeal dysphagia (Abstract), Symposium of Dysphagia, Johns Hopkins Hospital, March 1990. [5] Ehtiati, T., Kinsner, W., Moussavi, Z., “Multifractal Characterization of the Electromyogram Signals in Presence of Fatigue,” Proc. of IEEE ICEC’98 Conf., vol. 2, May 1998, pp. 866-869. [6] Kinsner, W., “Fractal Dimensions: Morphological, Entropy, Spectrum, and Variance Classes,” Technical Report, DEL94-4. Dept. of Electrical and Computer Engineering, Univ. of Manitoba, Winnipeg, MB, Canada, pp.28-39, 103-112, 1994. [7] Mussell, M.J., Miyamoto, Y., “Comparison of normal respiratory sounds recorded from the chest and trachea at various respiratory air flow levels.” Frontiers Med. Biol. Engng., vol. 4, no. 2, 1992, pp. 73-85.