experiments in the real-world application of credit card fraud. Several key new teachniques are reported that address the issues of pruning combined meta- ...
Agent-Based Distributed Learning Applied to Fraud Detection Andreas L. Prodromidis and Salvatore Stolfo Department of Computer Science Columbia University 1214 Amsterdam Ave. Mail Code 0401 New York, NY 10027 {andreas,sal}@cs.columbia.edu
CUCS-014-99 Abstract Inductive learning and classification techniques have been applied in many problems in diverse areas. In this paper we describe an AI-based approach that combines inductive learning algorithms and meta-learning methods as a means to compute accurate classification models for detecting electronic fraud. Inductive learning algorithms are used to compute detectors of anomalous or errant behavior over inherently distributed data sets and meta-learning methods integrate their collective knowledge into higher level classification models or meta-classifiers. By supporting the exchange of models or classifier agents among data sites, our approach facilitates the cooperation between financial organizations and provides unified and cross-institution protection mechanisms against fraudulent transactions. Through experiments performed on actual credit card transaction data supplied by two different financial institutions, we evaluate this approach and we demonstrate its utility.
Introduction Agent-based learning systems have attracted considerable attention recently. One such system, JAM (Java Agents for Meta-learning) (Stolfo et al. 1997), provides the means of dispatching and executing learning agents at remote database sites, with each learning agent being a Java encapsulated machine learning program. One of JAM ’s key features is meta-learning, a general technique that combines multiple classification models, each of which may have been computed over distributed sites. In this paper, we describe the application of JAM in fraud and intrusion detection in network-based information systems by detailing a comprehensive set of experiments in the real-world application of credit card fraud. Several key new teachniques are reported that address the issues of pruning combined meta-classifiers in order to improve efficiency while maintaining accuracy. Furthermore, experiments are reported on combining classifiers computed over distributed databases with different schemas. We begin with a brief overview of the fraud detection application to highlight the advantages of JAM in distributed learning.
Fraud detection A secured and trusted interbanking network for electronic commerce requires high speed verification and authentication mechanisms that allow legitimate users easy access to conduct their business, while thwarting fraudulent transaction attempts by others. Fraudulent electronic transactions are a significant problem, one that grows in importance as the number of access points increase and more services are provided. The traditional way to defend financial information system has been to protect the routers and network infrastructure. Furthermore, to intercept intrusions and fraudulent transactions that inevitably leak through, financial institutions have developed custom fraud detection systems targeted to their own asset bases. Recently however, banks have come to realize that a unified, global approach that involves the periodic sharing of information regarding fraudulent practices is required. In this paper, we describe an AI-based approach that supports the cooperation among different institutions and consists of pattern-directed inference systems that use models of anomalous or errant transaction behaviors to forewarn of fraudulent practices.1 This approach requires the analysis of large and inherently distributed databases of information about transaction behaviors to produce models of “probably fraudulent” transactions. The key difficulties in this approach are: financial companies don’t share their data for a number of (competitive and legal) reasons; the databases that companies maintain on transaction behavior are huge and growing rapidly; real-time analysis is highly desirable to update models when new events are detected and easy distribution of models in a networked environment is essential to maintain up to date detection capability. To address these difficulties and thereby protect against electronic fraud our approach has two key component technologies: local fraud detection agents that learn how to detect fraud within a single information system, and an integrated meta-learning mechanism that combines the collective knowledge acquired by the 1 An alternative approach to modeling transactions would be to model user behavior. An application of this method, but in cellular phone fraud detection has been examined in (Fawcett & Provost 1997).
individual local agents. The fraud detection agents consist of classification models computed by machine learning programs at one or more sites, while meta-learning provides the means to combining a number of separately learned classifiers. Thus, meta-learning allows financial institutions to share their models of fraudulent transactions without disclosing their proprietary data. This way their competitive and legal restrictions can be met, but they can still share information. Furthermore, by supporting the training of classifiers over distributed databases, meta-learning can substantially reduce the total learning time (parallel learning of classifiers over (smaller) subsets of data). The final meta-classifiers (the combined ensemble of fraud detectors) can be used as sentries forewarning of possible fraud by inspecting and classifying each incoming transaction. This paper presents a comprehensive set of experiments evaluating the applicability of our approach in the security of financial information systems. As a test set we use a data set of credit card transactions supplied by two different financial institutions. The task is to compute classification models that accurately discern fraudulent credit card transactions. Our experiments are structured as follows. First we apply several machine learning algorithms on different subsets of data from both banks to establish the potential of inductive learning methods in fraud detection. Then, we overview meta-learning and evaluate its utility by combining the fraud detectors of each bank. In the last part of the paper, we describe the exchange of classifiers between the two banks and provide empirical results for assessing the validity and merit of this approach. By way of summary, we find that pattern-directed inference systems coupled with meta-learning methods constitute a protective shield against fraud with the potential to exceed the performance of existing fraud detection techniques.
Computing fraud detectors Machine Learning In this study we employ five different inductive learning programs, Bayes, C4.5, ID3, CART and Ripper. Bayes, implements a naive Bayesian learning algorithm described in (Minksy & Papert 1969), ID3 (Quinlan 1986), its successor C4.5 (Quinlan 1993), and CART (Breiman et al. 1984) are decision tree based algorithms, and Ripper (Cohen 1995) is a rule induction algorithm. Data sets We obtained two large databases from Chase and First Union banks, each with 500,000 records of credit card transaction data spanning one year (Oct.95-Sept.96). Chase bank data consisted, on average, of 42,000 sampled credit card transactions records per month with a 20% fraud and 80% legitimate distribution, whereas First Union data were sampled in a non-uniform (many records from some months, very few from others, very skewed fraud distributions for some months) manner with a total of 15% versus 85% distribution. The schemas of the databases was developed over years of experience and continuous analy-
sis by bank personnel to capture important information for fraud detection. The records have a fixed length of 137 bytes each and about 30 numeric and categorical attributes including the binary class label (fraud/legitimate transaction). Under the terms of the non-disclosure agreement, we can not reveal the details of the schema beyond the following general description: • A (jumbled) account number (no real identifiers) • Scores produced by a COTS authorization/detection system • Date/Time of transaction • Past payment information of the transactor • Amount of transaction • Geographic information: where the transaction was initiated, the location of the merchant and transactor • Codes for validity and manner of entry of the transaction • An industry standard code for the type of merchant • A code for other recent “non-monetary” transaction types by transactor • The age of the account and the card • Other card/account information • Confidential/Proprietary Fields (other potential indicators) • Fraud Label (0/1) Learning tasks Our task is to compute effective classifiers that correctly discern fraudulent from legitimate transactions. Contrary to most studies on comparing different classification models and systems, however, effectiveness does not mean overall accuracy (or minimal error rate). Other measures of interest include True Positive (TP) and False Positive (FP) rates for (binary) classification problems, ROC analysis and problem specific cost models. A detailed study against the use of accuracy estimation for comparing induction algorithms can be found in (Provost, Fawcett, & Kohavi 1998). In the credit card fraud domain, overall predictive accuracy is inappropriate as the single measure of predictive performance. If 1% of the transactions are fraudulent, then a model that always predicts “legitimate” will be 99% accurate. Hence, TP rate is more important. Of the 1% fraudulent transactions, we wish to compute models that predict 100% of these, yet produce no false alarms (i.e. predict no legitimate transactions to be fraudulent). Hence, maximizing the T P − F P spread may be the right measure of a successful model. Yet, one may find a model with TP rate of 90%, i.e. it correctly predicts 90% of the fraudulent transactions, but here it may correctly predict the lowest cost transactions, being entirely wrong about the top 10% most expensive frauds. Therefore, a cost model criteria may be the best judge of success, i.e a classifier whose T P rate is 10% may be the best cost performer.
Average accuracy of Chase base classifiers
Average TP - FP spread of Chase base classifiers
0.89 0.88 0.87
Average savings of Chase base classifiers
0.6 Bayes C45 CART ID3 Ripper
900000 Bayes C45 CART ID3 Ripper
0.55 0.5
700000
0.86
600000
0.84 0.83
Savings
0.45
0.85 TP-FP
Accuracy
Bayes C45 CART ID3 Ripper
800000
0.4
500000 400000
0.35 300000
0.82 0.3
200000
0.81 0.25
0.8 0.79 Sep Feb Jul Dec May Oct Mar Aug Jan Jun Nov Apr Sep Base Classifiers
100000
0.2 Sep Feb Jul Dec May Oct Mar Aug Jan Jun Nov Apr Sep Base Classifiers
0 Sep Feb Jul Dec May Oct Mar Aug Jan Jun Nov Apr Sep Base Classifiers
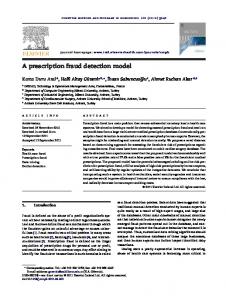
Figure 1: Fraud Predictors: Accuracy (left), TP-FP spread (middle) and Savings (right) on Chase credit card data. Average accuracy of First Union base classifiers
Average TP - FP spread of First Union base classifiers
0.955
0.94
Bayes C45 CART ID3 Ripper
0.75 0.7
0.92
TP-FP
Accuracy
0.925
Bayes C45 CART ID3 Ripper
800000 750000
0.65
0.935 0.93
850000 Bayes C45 CART ID3 Ripper
700000 Savings
0.95 0.945
Average savings of First Union base classifiers
0.8
0.6 0.55
650000 600000
0.5
550000
0.45
500000
0.4
450000
0.915 0.91 0.905 0.9 Sep Feb Jul Dec May Oct Mar Aug Jan Jun Nov Apr Sep Base Classifiers
0.35 Sep Feb Jul Dec May Oct Mar Aug Jan Jun Nov Apr Sep Base Classifiers
400000 Sep Feb Jul Dec May Oct Mar Aug Jan Jun Nov Apr Sep Base Classifiers
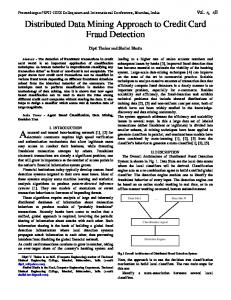
Figure 2: Fraud Predictors: Accuracy (left), TP-FP spread (middle) and Savings (right) on First Union credit card data. To evaluate and compare our fraud predictors, we adopted three metrics: the overall accuracy, the T P − F P spread2 and a cost model fit to this problem. Credit card companies have a fixed overhead that serves as a threshold value for challenging the legitimacy of a credit card transaction. If the transaction amount amt, is below this threshold, they choose to authorize the transaction automatically. Each transaction predicted as fraudulent requires an “overhead” referral fee for authorization personnel to decide the final disposition. This “overhead” cost is typically a “fixed fee” that we call Y . Therefore, even if we could accurately predict and identify all fraudulent transactions, those whose amt is less than Y would produce $(Y − amt ) in losses anyway. To calculate the savings each fraud detector contributes due to stopping fraudulent transactions, we use the following cost model for each transaction: 2 In comparing the classifiers, one can replace the T P − F P spread, which defines a certain family of curves in the ROC plot, with a different metric or even with a complete analysis (Provost & Fawcett 1997; 1998) in the ROC space.
• If prediction is “legitimate” or (amt ≤ Y ), authorize the transaction (savings = 0); • Otherwise investigate the transaction: – If transaction is “fraudulent”, savings = amt − Y ; – otherwise savings = −Y ; Performance of classifiers To generate our classification models we distributed each data set across six different data sites (each site storing two months of data) and we applied the 5 learning algorithms on each month of data, therefore creating 60 classifiers (10 classifiers per data site). This “month-dependent” data partitioning scheme was used only on the Chase bank data set. The very skewed nature of the First Union data forced us to equi-partition the entire data set randomly into 12 subsets and assign 2 subsets in each data site. Next, we had each data site import all “remote” classifier agentss (50 in total) to test them against its “local” data. In essense, each classifier agents was evaluted on 5 different (and unseen) subsets. Figures 1 and 2, present the averaged results for the Chase and First Union credit card data respectively.
The left plots show the accuracy, the center plots depict the T P −F P spread and the right plots display the savings of each fraud detector. The x-axis corresponds to the month of data used to train the classifier agents, starting in October 1995 and ending in September 1996 (the one year span is repeated for the five learning algorithms). Each vertical bar represents a specific classifier agent, e.g. the first bar of the left plot of Figure 1 represents the accuracy (83.5%) of the Bayesian classifier agent that was trained on the October 1995 data. The maximum achievable savings for the perfect classifier, with respect to our cost model, is $1,470K for the Chase and $1,085K for the First Union data sets. According to the figures, some learning algorithms are more suitable for one problem for one evaluation metric (e.g naive Bayes on Chase data is more effective in savings) than for another metric (e.g. accuracy of naive Bayes classifier on Chase data) or another problem (e.g. naive Bayes on First Union data), even though the two sets are very similar in nature. The figures also reveal that the classifier agents computed over the Chase data exhibit a larger variance in their performance, compared to those computed over the First Union data. The diversity among the classifiers is attributed, first, to the use of disparate learning algorithms (each with different search space, evaluation criteria, model representation and bias), and second, on the degree the training sets are different. Although the first factor is the same for both Chase and First Union datasets, this is not the case with the second. First Union classifiers are trained over subsets of data of equal size and class distribution while the Chase classifiers were trained on subsets of data divided according to the date of the credit card transaction. The latter led to variations in the size of the training sets and the class distributions, thus explaining the increased variance within the set of Chase classifiers. Overall, it appears that all learning algorithms performed better on the First Union data set than on the Chase data set. On the other hand, note that there are fewer fraudulent transactions in the First Union data and this causes a higher baseline accuracy. In all cases, classifiers are successful in detecting fraudulent transcactions. Moreover, by combining these separately learned classifiers, it is possible to generate metaclassifiers (higher level classification models) with improved fraud detection capabilities.
Combining fraud detectors Meta-learning The basic idea of metalearning (Chan & Stolfo 1993), a technique similar to stacking (Wolpert 1992), is to execute a number of machine learning processes on a number of data subsets in parallel, and then to combine their computed classifiers through an additional phase of learning. Initially, each machine learning task, also called a base learner, computes a base classifier, i.e. a model of its underlying data subset or training set. Next, a separate machine learning task, called a meta-learner, integrates
these independently computed base classifiers into a higher level classifier, called a meta classifier, by learning over a meta-level training set. This meta-level training set is composed from the predictions of the individual base classifiers when tested against a separate subset of the training data, also called a validation set. From these predictions, the meta-learner discovers the characteristics and performance of the base classifiers and computes a meta-classifier which is a model of the “global” data set. To classify an unlabeled instance, the base classifiers present their own predictions to the meta-classifier which then makes the final classification. Performance of meta-classifiers To combine the 50 “imported” fraud detectors (base classifiers) into a single meta-classifier, each data site used the same 5 learning algorithms as meta-learners and employed half of its local data (one month) as the validation set and the other half (second month) as the test set. The 10 “local” base classifiers were not used in meta-learning to ensure that no classifiers predict on data seen previously. The setting of this experiment, corresponds to a 6-fold cross validation with each fold executed in parallel. The performance results of these meta-classifiers averaged over the 6 sites are reported in Table 1. A comparison to Figures 1 and 2 indicates that in almost all instances, meta-classifiers outperform all base classifiers, and in some cases by a significant margin. The most notable exception is found in the “savings” column of Chase bank where most meta-classifiers exhibit reduced effectiveness compared to that of the best base classifier. Even there, however, all learning algorithms produce better results as meta-learners than as baselearners (e.g. the ID3 meta-classifier is superior to the best ID3 base classifier). This shortcoming can be attributed to the fact that the learning task is ill-defined. Training classifiers to distinguish fraudulent transactions is not a direct approach to maximizing savings (or the T P −F P spread). Traditional learning algorithms are unaware of the adopted cost model and the actual value (in dollars) of the fraud/legitimate label; instead they are designed to reduce misclassification error. Hence, the most accurate classifiers are not necessarily the most cost effective. This can be demonstrated in Figure 1 (right plot). Although the Bayesian base classifiers are less accurate than the Ripper and C4.5 base classifiers, they are by far the best under the cost model. Similarly, the metaclassifiers are trained to maximize the overall accuracy not by examining the savings in dollars but by relying on the predictions of the base-classifiers. In fact, the right plot of Figure 1 reveals that with only a few exceptions, Chase base classifiers are inclined towards catching “cheap” fraudulent transactions and for this they exhibit low savings scores. Naturally, the metaclassifiers are trained to trust the wrong base-classifiers for the wrong reasons, i.e. they trust the base classifiers that are most accurate instead of the classifiers
Table 1: Performance of the meta-classifiers Algorithm Bayes C4.5 CART ID3 Ripper
Accuracy 88.65% 89.30% 88.67% 87.19% 89.66%
Chase TP-FP 0.621 0.567 0.552 0.532 0.585
that accrue highest savings. One way to deal with this situation is to use costsensitive algorithms, i.e. algorithms that employ cost models to guide the learning strategy (Turney 1995). On the other hand, this approach has the disadvantage of requiring significant change to generic algorithms. An alternative, but (probably) less effective technique is to alter the class distribution in the training set (Breiman et al. 1984; Chan & Stolfo 1998) or to tune the learning problem according to the adopted cost model. In the credit card fraud domain, for example, we can transform the binary classification problem into a multi-class problem by multiplexing the binary class and with continuous amt attribute (properly quantized into several “bins”). A third option, complementary to the other two, is to have the meta-classifier pruned (Prodromidis & Stolfo 1998a), i.e. discard the base classifiers that do not exhibit the desired property. To improve the performance of our meta-classifiers, we followed the latter approach. Although it addresses the cost-model problem at a late stage, after base classifiers are generated, is has the advantage of fitting better to the requirements of this problem (financial institutions import pre-computed classification models, and hence treat them as black boxes) and also reduces the size of the meta-classifier, thus allowing for faster predictions and better use of system resources. Pruning the meta-classifiers Determining the optimal set of classifiers for meta-learning is a combinatorial problem. With 50 base classifiers per data site, there are 250 combinations of base classifiers that can be selected. To search the space of the potentially most promising meta-classifiers, the pruning algorithms (Prodromidis & Stolfo 1998a) employ evaluation functions that are based on the evaluation metric adopted (e.g. accuracy, cost model) and heuristic methods that are based on the performance and properties of the available set of base classifiers (e.g. diversity, high accuracy for a specific class). Figures 3 and 4 display the accuracy (left plots), the TP-FP spread (center plots) and savings (right plots) of the partially grown meta-classifiers for the Chase and First Union data sets respectively. The x-axis represents that number of base classifiers included in the meta-classifiers. The curves show the Ripper metaclassifier to be the most accurate and the Bayesian meta-classifiers to achieve the best performance with respect to the TP-FP spread and the cost model for
Savings $ 818K $ 588K $ 594K $ 561K $ 640K
First Union Accuracy TP-FP 96.21% 0.831 96.25% 0.791 96.24% 0.798 95.72% 0.790 96.53% 0.817
Savings $ 944K $ 878K $ 871K $ 858K $ 899K
both sets. At the opposite end, ID3 is found to be the overall worst performer. The figures indicate that, with only few exceptions, meta-learners tend to overfit their meta-learning training set (composed from the validation set) as the number of base-classifiers grows. Hence, in addition to computing most efficient meta-classifiers, pruning can lead to further improvements in the meta-classifiers’ fraud detection capabilities. Moreover, by selecting the base classifiers, pruning helps address the cost-model problem as well. The performance of a meta-classifier is directly related to the properties and characteristics of the constituent base classifiers. Recall (from the right plot of Figure 1) that very few base classifiers from Chase have the ability to catch “expensive” fraudulent transactions. While the meta-classifiers consist of base classifiers with good cost model performance the metaclassifier exhibits substantially improved performance as well (see right plot of Figure 3). This trend is not apparent for the First Union data set since the majority of the First Union base classifiers happened to catch the “expensive” fraudulent transactions anyway (right plot of Figure 2). The same, but to a lesser degree, holds for the T P − F P spread. Table 2 presents a summary result of the best pruned meta-classifiers and their size (number of constituent base classifiers). Entries in bold indicate a statistically significant performance improvement comparing to that of the unpruned meta-classifiers. 3 As expected, however, there is no single best meta-classifier; depending on the evaluation criteria and the learning task, different meta-classifiers of different sizes perform better.
Combining fraud detectors across banks The final stage of our experiments involves the exchange of base classifiers between the two banks. In addition to their 10 local and 50 “internal” classifier agents (those imported from their peer data sites), the data sites also import the 60 external classifier agents (those computed at the other bank). Each Chase data site is populated with 60 (10+50) Chase fraud detectors and 60 First Union fraud detectors and vice versa for First Union. The same 5 learning algorithms are used as meta-learners and each site employs half of its local data to meta-learn its classifier agents and the other half to evaluate the overall performance of the meta-classifier. 3 The error rates of the two meta-classifiers are different with 99% confidence according to the paired t test.
Accuracy of Chase meta-classifiers with Chase base classifiers
TP - FP of Chase meta-classifiers with Chase base classifiers
0.9
0.64
0.895
0.62
Savings of Chase meta-classifiers with Chase base classifiers 950000 900000 850000
0.885
0.88
0.875
Bayes C4.5 CART ID3 Ripper
savings in dollars
0.6 TP - FP
Total Accuracy
0.89
0.58
0.56 Bayes C4.5 CART ID3 Ripper
0.54
0.87 10 15 20 25 30 35 40 number of base-classifiers in a meta-classifier
45
50
5
10 15 20 25 30 35 40 number of base-classifiers in a meta-classifier
45
750000 700000 650000 600000 Bayes C4.5 CART 550000 ID3 Ripper 500000 5
0.52 5
800000
50
10 15 20 25 30 35 40 number of base-classifiers in a meta-classifier
45
50
Figure 3: Chase: Accuracy (left), TP-FP spread (middle) and savings (right) of meta-classifiers as a function of the number of base classifiers combined. Accuracy for First Union meta-classifiers with First Union base classifiers
TP - FP for First Union meta-classifiers with First Union base classifiers
0.966
0.86
0.964
0.84
0.962
0.82
0.96
0.8
Savings of Fist Union meta-classifiers with Fist Union base classifiers 1e+06
0.958 0.956 0.954
Bayes C4.5 CART ID3 Ripper
0.952
0.78 0.76 0.74
Bayes C4.5 CART ID3 Ripper
0.72
0.95
savings in dollars
TP - FP
Total Accuracy
950000
900000
850000
800000
Bayes C4.5 CART ID3 Ripper
750000
0.7
0.948
0.68 5
10 15 20 25 30 35 40 number of base-classifiers in a meta-classifier
45
50
700000 5
10 15 20 25 30 35 40 number of base-classifiers in a meta-classifier
45
50
5
10 15 20 25 30 35 40 number of base-classifiers in a meta-classifier
45
50
Figure 4: First Union: Accuracy (left), TP-FP spread (middle) and savings (right) of meta-classifiers as a function of the number of base classifiers combined. To ensure fairness, the 10 local classifier agents are not used in meta-learning. Bridging the Databases To meta-learn over this set of classifier agents, however, we had to overcome additional obstacles. The two databases, had differences in their schema definition, hence the produced incompatible classifiers: 1. Chase and First Union defined an attribute with different semantics (i.e. one bank recorded the number of times an event occurs within a specific time period while the second bank recorded the number of times the same event occurs within a different time period). 2. Chase includes two (continuous) attributes not present in the First Union data. To address these problems we followed the approaches described in (Maitan, Ras, & Zemankov 1989; Ras 1998; Prodromidis & Stolfo 1998b). For the first incompatibility, we had the values of the First Union data set mapped via a linear approximation to the semantics of the Chase data. For the second incompatibility,
we deployed special bridging agents that were trained to compute the missing values of First Union data set. The training involved the construction of regression models (Sta 1996) of the missing attributes over the Chase data set using only the attributes that were common to both banks. When predicting, the First Union classifier agents simply disregarded the real values provided at the Chase data sites, while the Chase classifier agents relied on both the common attributes and the predictions of the bridging agents to deliver a prediction at the First Union data sites. Table 3 displays the accuracy, TP-FP spread and savings of each Chase and First Union meta-classifier. These results demonstrate that both Chase and First Union fraud detectors can be exchanged and applied to their respective data sets. The most apparent outcome of these experiments is the superior performance of the First Union meta-classifiers and the lack of improvement on the performance of the Chase meta-classifiers (Again, entries in bold indicate a further improvement in performance). This phenomenon can be easily ex-
Table 2: Performance of the best pruned meta-classifiers Algorithm Type Bayes C4.5 CART ID3 Ripper
Accuracy
size
89.33% 89.58% 89.49% 89.40% 89.70%
16 14 9 8 46
Chase TP-FP size
Savings
0.632 0.572 0.571 0.568 0.595
$ $ $ $ $
32 27 18 1 47
903K 793K 798K 792K 858K
size
Accuracy
size
5 5 5 5 3
96.57% 96.51% 96.48% 96.45% 96.59%
13 16 12 8 30
First Union TP-FP size
Savings
0.848 0.799 0.801 0.795 0.821
$ $ $ $ $
12 25 29 30 36
950K 880K 884K 872K 902K
size 29 42 37 40 44
Table 3: Performance of meta classifiers combining fraud predictors from both banks Algorithm Type Bayes C4.5 CART ID3 Ripper
Accuracy 88.03% 88.93% 88.46% 84.80% 89.70%
Chase TP-FP 0.621 0.558 0.556 0.513 0.585
plained from the fact that the attributes missing from the First Union data set were significant in modeling the Chase data set. Hence, the First Union classifiers are not as effective as the Chase classifiers on the Chase data, and the Chase classifiers cannot perform at full strength at the First Union sites without the bridging agents. (The latter was verified by a separate experiment, similar to the above, with the exception that no bridging agents were used, i.e. Chase classifiers produced predictions without using any information on the missing values — results not shown here). Pruning the meta-classifiers To reduce the number of base classifiers integrated in each meta-classifier and improve the overall performance, we applied the pruning algorithms on these meta-classifiers as well. Table 4 presents the summary results of the best pruned meta-classifiers and their size. The measurements establish the contribution of pruning. In all cases pruning succeeded in computing meta-classifiers with similar or better fraud detection capabilities, while reducing their size and thus improving their efficiency. Existing fraud detection techniques Our experiments demonstrate that fraud-detectors computed over models contributed by different financial institutions are capable of identifying a substantial portion of the fraudulent transactions. To compare with existing fraud detection techniques, we measured the performance of Chase’s own COTS4 authorization/detection system (First Union’s COTS authorization/detection system was not made available to us). Such systems are trained to inspect and evaluate incoming transactions and produce scores in the [0-1000] range. Bank personnel determine a threshold value based on the target evaluation metric, and all transactions scored above this threshold are considered suspicious. In Figure 5, we plot the accuracy, the TP-FP spread and savings 4
Commercial off the shelf fraud detection system.
Savings $ 800K $ 576K $ 590K $ 547K $ 632K
First Union Accuracy TP-FP 96.32% 0.844 97.97% 0.881 97.99% 0.881 97.46% 0.877 98.05% 0.897
Savings $ 963K $ 912K $ 909K $ 887K $ 927K
of the COTS system as a function of its output. Notice, that the same results holds for Chase’s system as well: there is no single best threshold; depending on the evaluation metric targeted different thresholds are better — 700 for accuracy (85.7%), 100 for the TP-FP spread (0.523) and 250 for savings ($682K). In contrast, the best results obtained by Chase meta-classifiers attained 89.73% in accuracy, 0.633 in the TP-FP spread, and $903K in savings.
Conclusion This paper describes a general method to protect financial information systems against fraudulent practices. The main advantages of this approach are: its flexibility to allow financial institutions to share their models of fraudulent transactions without disclosing their proprietary data and its its ability to scale as the number and size of data bases grow. We applied this approach on actual credit card transaction data sets provided by two separate financial institutions. Our experiments involved the training of multiple fraud detectors (classifier agents) and metadetectors within each data set, and the meta-learning of meta-detectors across the two data sets. Through an extensive empirical evaluation we showed that, for the given data sets, meta-detectors exhibit far superior fraud detection capabilities comparing to single model approaches and traditional authorization/detection systems. We believe meta-learning systems deployed as intelligent agents will be an important contributing technology to deploy intrusion detection facilities in globalscale, integrated information systems.
References Breiman, L.; Friedman, J. H.; Olshen, R. A.; and Stone, C. J. 1984. Classification and Regression Trees. Belmont, CA: Wadsworth. Chan, P., and Stolfo, S. 1993. Meta-learning for mul-
Table 4: Performance of best pruned meta-classifiers combining fraud predictors from both banks Algorithm Type Bayes C4.5 CART ID3 Ripper
Accuracy
size
89.13% 89.08% 89.49% 88.90% 89.73%
16 21 9 10 63
Chase TP-FP size 0.633 0.570 0.571 0.568 0.594
63 12 18 1 77
COTS authorization/detection system: Accuracy
Savings
size
Accuracy
size
$ 903K $ 793K $ 798K $ 792K $877K
5 5 5 5 63
96.44% 98.03% 97.98% 97.46% 98.05%
12 64 71 65 63
$ $ $ $ $
0.45
500000 SAvings
0.8
0.4
0.35
300000
0.65
0.3
200000
0.25 900
56 69 90 32 52
400000
0.7
0.6
size
TP-FP 600000
0.75
963K 917K 908K 891K 935K
700000
0.5
TP-FP
Accuracy
Savings
TP-FP
0.85
200 300 400 500 600 700 800 output of COTS authorization/detection system
62 64 58 65 56
COTS authorization/detection system: Savings
0.55 Accuracy
100
0.845 0.881 0.882 0.878 0.899
COTS authorization/detection system: TP - FP
0.9
0
First Union TP-FP size
100000 0
100
200 300 400 500 600 700 800 output of COTS authorization/detection system
900
0
100
200 300 400 500 600 700 800 output of COTS authorization/detection system
900
Figure 5: Performance of existing authorization/detection system on Chase’s data tistrategy and parallel learning. In Proc. Second Intl. Work. Multistrategy Learning, 150–165. Chan, P., and Stolfo, S. 1998. Toward scalable learning with non-uniform class and cost distributions: A case study in credit card fraud detection. In Proc. Fourth Intl. Conf. Knowl. Disc. and Data Min., 164–168. Cohen, W. 1995. Fast effective rule induction. In Proc. 12th Intl. Conf. Machine Learning, 115–123. Fawcett, T., and Provost, F. 1997. Adaptive fraud detection. Data Min. and Knowl. Disc. 1(3):291–316. Maitan, J.; Ras, Z. W.; and Zemankov, M. 1989. Query handling and learning in a distributed intelligent system. In Ras, Z. W., ed., Methodologies for Intelligent Systems, 4, 118–127. Charlotte, North Carolina: North Holland. Minksy, M., and Papert, S. 1969. Perceptrons: An Introduction to Computation Geometry. Cambridge, MA: MIT Press. (Expanded edition, 1988). Prodromidis, A. L., and Stolfo, S. J. 1998a. Pruning meta-classifiers in a distributed data mining system. In In Proc of the First National Conference on New Information Technologies, 151–160. Prodromidis, A. L., and Stolfo, S. J. 1998b. Mining databases with different schemas: Integrating incompatible classifiers. In R Agrawal, P. Stolorz, G. P.-S., ed., Proc. 4th Intl. Conf. Knowledge Discovery and Data Mining, 314–318. AAAI Press. Provost, F., and Fawcett, T. 1997. Analysis and visualization of classifier performance: Comparison under
imprecise class and cost distributions. In Proc. Third Intl. Conf. Knowl. Disc. and Data Min., 43–48. Provost, F., and Fawcett, T. 1998. Robust classification systems for imprecise environments. In Proc. AAAI-98. AAAI Press. Provost, F.; Fawcett, T.; and Kohavi, R. 1998. The case against accuracy estimation for comparing induction algorithms. In Proc. Fifteenth Intl. Conf. Machine Learning, 445–553. Quinlan, J. R. 1986. Induction of decision trees. Machine Learning 1:81–106. Quinlan, J. R. 1993. C4.5: programs for machine learning. San Mateo, CA: Morgan Kaufmann. Ras, Z. W. 1998. Answering non-standard queries in distributed knowledge-based systems. In A. Skowron, L. P., ed., Rough sets in Knowledge Discovery, Studies in Fuzziness and Soft Computing, volume 2, 98–108. Physica Verlag. StatSci Division, MathSoft, Seattle. 1996. Splus, Version 3.4. Stolfo, S.; Prodromidis, A.; Tselepis, S.; Lee, W.; Fan, W.; and Chan, P. 1997. JAM: Java agents for metalearning over distributed databases. In Proc. 3rd Intl. Conf. Knowledge Discovery and Data Mining, 74–81. Turney, P. D. 1995. Cost-sensitive classification: Empirical evaluation of a hydrid genetic decision tree induction algorithm. Journal of AI Research 2:369–409. Wolpert, D. 1992. Stacked generalization. Neural Networks 5:241–259.


![[PDF] Fraud and Fraud Detection - Google Sites](https://m.moam.info/img/260x300/pdf-fraud-and-fraud-detection-google-sites_6478995d097c4796708cfca3.jpg)