relies on the modulation-spectral analysis of amplitude fluctuations ... Index Termsâ Amplitude Modulation Spectrogram (AMS), .... pulse responses (RIRs).
AMPLITUDE MODULATION SPECTROGRAM BASED FEATURES FOR ROBUST SPEECH RECOGNITION IN NOISY AND REVERBERANT ENVIRONMENTS Niko Moritz1, Jörn Anemüller2, Birger Kollmeier1,2 1
Fraunhofer IDMT - Project Group Hearing, Speech and Audio Technology, Oldenburg, Germany 2 Medical Physics, Dept. of Physics, Carl-von-Ossietzky University Oldenburg, Germany ABSTRACT
In this contribution we present a feature extraction method that relies on the modulation-spectral analysis of amplitude fluctuations within sub-bands of the acoustic spectrum by a STFT. The experimental results indicate that the optimal temporal filter extension for amplitude modulation analysis is around 310 ms. It is also demonstrated that the phase information of the modulation spectrum contains important cues for speech recognition. In this context, the advantage of an odd analysis basis function is considered. The best presented features reached a total relative improvement of 53,5 % for clean-condition training on Aurora-2. Furthermore, it is shown that modulation features are more robust against room reverberation than conventional cepstral and dynamic features and that they strongly benefit from a high early-to-late energy ratio of the characteristic RIR. Index Terms— Amplitude Modulation Spectrogram (AMS), Feature Extraction, Reverberation, Phase, Automatic Speech Recognition (ASR)
1. INTRODUCTION Today’s most commonly used features for automatic speech recognition (ASR), such as the Mel-Frequency Cepstral Coefficients (MFCCs), still rely on the spectral envelope as the prime property for classification of the different linguistic characteristics of spoken words. However, the spectral envelope of a speech signal is very sensitive to distortions such as additive and convolutional noise. Recent research for robust feature extraction tends towards analyzing long time trajectories of the spectral envelope. By this approach a representation of the amplitude modulations is obtained, which can provide more robust cues for speech recognition, as it will be demonstrated in this paper. Perceptual experiments by Drullman et al. indicate that the suppression of modulation frequencies higher than 16 Hz or lower than 4 Hz do not significantly reduce speech intelligibility [1][2]. In [3] these experiments are extended using band-pass filters concluding that most linguistic information is found between 1 and 16 Hz in the modulation spectrum. In [4] time trajectories of different types of speech features, such as MFCCs and Perceptual Linear Predictive (PLP) analysis, are bandpass filtered and ASR performance is measured as a function of the upper and lower cutoff frequency. Results show similar characteristics as the perceptual experiments, i.e. that most linguistic information for ASR is found in the modulation frequency range between 1 and 16 Hz. One of the first and very popular approaches of deploying information of the modulation spectrum is well known
978-1-4577-0539-7/11/$26.00 ©2011 IEEE
5492
as delta and acceleration features [5], which enhance frequency components of the cepstral envelope around 10 Hz while lower and higher components are attenuated [6]. In [6] Hermansky et al. suggested that a more robust representation of speech for ASR is obtained by suppressing non-speech components in the modulation frequency domain, which is known as RelAtive SpecTrAl (RASTA) processing. The RASTA filter passes components of the modulation spectrum between about 1 and 12 Hz. In more recent work [7][8] the modulation spectrum is directly used as the prime feature to rely on. In [7] amplitude modulations are analyzed by autoregressive models of sub-band Hilbert envelopes using frequency domain linear prediction. In [8] modulation features are derived by a discrete cosine series analysis over time of the discrete cosine transform coefficients of the log magnitude spectrum. In this contribution we present a novel noise and reverberation robust feature extraction method, which uses the “short-term” Fourier transformation (STFT) to analyze the time trajectories of each Bark frequency band of the non-logarithmic energy spectrogram. By this, the so-called Amplitude Modulation Spectrogram (AMS) is obtained [9]. These complex AMS coefficients are used in two different versions that are illustrated in Figure 1. In version 1 the log magnitude is computed and in version 2 phase information of the modulation frequencies are preserved by processing the real or imaginary part, respectively. In addition modulation frequency components outside the range of 1-16 Hz are discarded and a principal component analysis (PCA) is used to reduce the dimensionality of the obtained features. AMS version 1 is analyzed w.r.t. the optimal window size for modulation frequency analysis in this contribution. The importance of preserving phase information in modulation features will be demonstrated using version 2. The presented experiments are performed on the Aurora-2 framework and in addition a recognition experiment with reverberant speech data is conducted.
2. THE AMPLITUDE MODULATION SPECTROGRAM (AMS) The AMS is motivated by psycho-physical and psychophysiological findings on the processing of amplitude modulations in the auditory system of mammals. In the late 80s Langner et al. suggested the existence of a periodotopic arrangement of neurons in the Colliculus inferior that are tuned to certain modulation frequencies [10]. These neurons where found almost orthogonal to the tonotopic arrangement of neurons, which are tuned to certain center frequencies. Psychoacoustic studies of Dau et al. account for the theory of the modulation frequency analysis for each center frequency band [11]. In [9] these findings are introduced to signal processing by definition of the AMS, which form the basis for the
ICASSP 2011
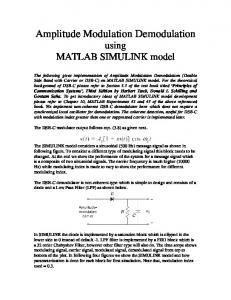
Table 1: Summary of RIRs used for test set D. T60 depicts the reverberation time required for reflections to decay by 60 dB below the level of direct sound. C50 depicts the energy ratio of early reflections (up to 50 ms) to late reflections. RIR1 RIR2 RIR3 RIR4 RIR5 RIR6 RIR7 RIR8 Figure 1: Block diagram of signal processing steps for the computation of AMS features in two versions. features used in this study. The block diagram in Figure 1 depicts the necessary signal processing steps for computing AMS in two different versions. First, the incoming sound signal is processed by a STFT and the envelope of the resulting spectrogram is taken by squaring the magnitude of the complex values. The frequency scale is then decomposed into a set of critical bands (Bark scale decomposition) and the long-term spectral envelope of each sub-band is analyzed by a second STFT. Thus, the three dimensional complex AMS coefficients (time, acoustic and modulation frequencies) are obtained. Here, two different versions for further processing the complex AMS are considered. In version 1 (upper path in Figure 1), the logarithmic energy of the complex AMS coefficients is computed. The intention of the second version (lower path in Figure 1) is to preserve the phase information of the modulation frequencies. For this purpose, we compute the real or imaginary part of the complex AMS coefficients, respectively, normalize this to the unit circle and multiply the compressed length of the complex pointer. Here, we suggest using a third root compression, since a logarithmic compression can cause negative values, which would interfere with negative values of the real or imaginary part. Default parameters for the AMS computation within this work are: i) The size of the analysis window for the first STFT is set to length 25 ms and shift 10 ms; ii) The window size of the second STFT is always given together with the results, however the window shift remains fixed to 10 ms by default, even if this may mean an oversampling; iii) Modulation components outside the range of 1-16 Hz are discarded; iv) The features vector size is reduced to 39 by a PCA in order to preserve comparability with MFCCs that are used for baseline results.
3. EXPERIMENTAL SETUP The experiments with the proposed AMS features are carried out on the Aurora-2 framework [12]. The Aurora-2 data are based on TIDigits (samples of spoken English digit strings) downsampled to 8 kHz and different noise types were added to the clean speech data for SNRs ranging from 20 dB to -5 dB in 5 dB steps. Furthermore, the data were split up into two training sets and three test sets. The trainings sets differ in a clean- and a multi-condition training. The test sets A and B each comprise four different types of noise. The division between test set A and B is related to the multi-condition training, as the noise types used for test set A are
5493
Room description Soundproof room Office Small kitchen Bathroom Lecture room 1 Lecture room 2 Lecture auditorium 1 Lecture auditorium 2
T60 [ms] 120 470 530 920 650 630 850 930
C50 [dB] 37,0 19,0 9,0 8,7 24,6 15,1 26,7 8,7
also used to add noise to the clean training data to create the multicondition training set. For test set C speech data with one noise type out of test set A and B were convolved with a filter that simulates the behavior of a telecommunication terminal. Beyond the three standard test sets (A−C) of the Aurora-2 framework an additional test set D was created for our experiments. This test set was constructed from the entire clean test data of the Aurora-2 corpus, which were convolved with eight different room impulse responses (RIRs). The RIRs were recorded in different rooms and with different speaker-to-microphone distances by the sine sweep method. The decisive RIRs properties are listed in Table 1. The isolated word recognition engine of the Aurora-2 framework is based on linear HMMs using 18 states per word (including the two non-emitting states) and mixtures of 3 Gaussians per state. Baseline results are obtained with MFCCs, which comprise 12 cepstral coefficients (without the 0th coefficient) and the logarithmic frame energy plus the corresponding delta and acceleration coefficients (resulting in a total vector size of 39). Recognition results shown within this contribution only refer to the case where training and test conditions do not match (i.e. cleancondition training).
4. DETERMINATION OF THE OPTIMAL WINDOW SIZE FOR MODULATION FREQUENCY ANALYSIS A critical parameter for modulation feature extraction is the window size used for analyzing the amplitude modulations of speech. The aim of the first set of experiments is to find the optimal window size, constituting the best possible compromise between time and frequency resolution, since speech itself is very transient unlike its amplitude modulations, which are very slowly varying in time (between 1 and 16 Hz). In the following experiment the analysis window size BLmod varies over a wide time range (from 140 to 420 ms) and the average word error rates (WERs) for clean speech as well as for the test sets A-C (that is the average WER for the SNRs ranging from 0-20 dB) are determined. Results obtained by AMS version 1 are depicted in Figure 2. The results indicate that the robustness of AMS features (determined by the average WERs of set A-C) increases for larger analysis windows BLmod until a maximum around 310 ms is reached. For longer analysis windows the average WERs of test sets A−C increase. In contrast, WERs for clean speech increase monotonously with parameter value BLmod, which can be explained by a declining time resolution due to smearing effects of the integrating analysis window.
As depicted, the MTF of the real and imaginary part of the basis functions manly differs for low modulation frequencies. Specifically, the real part of the basis function with the center frequency at 3,125 Hz has non-zero mean and thus does not attenuate frequencies below 3 Hz in contrast to the imaginary part (which is the odd basis function). This finding can also explain the big differences observed for results of test set C, since the MTF of the imaginary part suppresses DC components in spectral domain and the frequency characteristic of communication channels is often fixed or only slowly varying in time [6].
6. COMBINING AMS WITH CEPSTRAL FEATURES
Figure 2: Average WERs for the test sets A-C (concerning SNRs from 0-20 dB) as well as for clean speech obtained by AMS version 1 as a function of modulation analysis window length BLmod.
Figure 3: a) Normalized frequency response of the FFT basis functions used to obtain the AMS. b) Fourier basis function with 3,125 Hz center frequency. Eventually, the degrading ASR performance for clean speech also affects the ASR performance for noisy speech, so that the average WERs for the test sets A-C also decline, once this effect outweighs the increasing noise robustness. The experimental results show that this occurs at about 310 ms, whereby this window size is defined as an optimal parameter for modulation frequency analysis. In the further reading this parameter setup will be abbreviated with AMS310.
5. EMPHASIZING THE PHASE INFORMATION OF THE MODULATION SPECTRUM Kanedera et al. proposed in [13] that the phase information of modulation frequencies contains important cues for speech recognition. Hence, in this section differences between using the real and imaginary part of the modulation spectrum are considered. Table 2 presents experimental results for AMS310 version 1 and 2 and compares these with the Aurora-2 baseline results obtained by MFCCs. Results depicted in Table 2 provide evidence that the phase information of the modulation spectrum carries important cues for speech recognition. This fact can be seen by comparing WERs of AMS version 1 and 2. Furthermore, it can be observed that the imaginary part exhibits advantages over the real part. This observation can be explained by regarding the modulation transfer function (MTF) of the used basis functions in Figure 3. These basis functions are Hanning windowed complex exponential functions.
5494
This section continues to achieve further improved WERs by concatenating long temporal information of spectral trajectories (AMS) with short-term spectral information of MFCCs. Table 2 shows experimental results of the AMS310.I plus MFCCs i) including delta (Δ) and acceleration (ΔΔ) coefficients and ii) without Δ & ΔΔ. If results of ii) are compared with results of AMS310.I shown in Table 2, it can be seen that this combination only provide considerable advantages for high SNRs (i.e. clean speech, 20 dB and 15 dB SNR). For low SNRs WERs are even slightly worse for this feature combination. However, the results indicate clear advantages of AMS features over conventional delta coefficients, since the combination of cepstral coefficients (without Δ and ΔΔ) and AMS310.I clearly outperforms MFCCs (including Δ and ΔΔ). WERs for the combination of AMS310.I and MFCCs including delta and acceleration coefficients are much better for high SNRs and for clean speech in comparison to pure AMS310.I features. For this case only the SNR of 0 dB leads to higher WERs. Combining AMS310.I features with MFCCs results for cleancondition training in a total relative improvement of 53,5 % compared to the Aurora-2 baseline results (MFCCs).
7. ROOM REVERBERATION Room reverberation is a major problem for today’s standard features such as MFCCs. In contrast, modulation features seem to be more robust in reverberant environments. The reason is that the fine structure of the spectral envelope is much more susceptible to distortions caused by temporal smearing (i.e. reverberations) than the amplitude modulations of a speech signal, which vary very slowly in time. Table 3 presents the experimental results of test set D, which is described in Section 3. Results depicted in Table 3 indicate that AMS features are more robust against room reverberations compared to MFCCs. The AMS310.I features achieve much lower WERs for all tested RIRs except for RIR1. The reason is that MFCCs are better for clean speech and RIR1 is the impulse response of a soundproof room with low distortions characterized by a very short T60 time of 120 ms and a high percentage of early reflections compared to the reverberation field. The combination of AMS310.I and MFCCs shows for all test conditions clearly the best recognition results. Particularly striking is that for RIRs with a high C50 rate the AMS show little susceptibility against long T60 times (see RIR5 and RIR7 for instance). For this case results comparable to clean speech can be achieved even if the reverberation time is quite long, whereby MFCCs still show significant performance degradations.
Table 2: Summary of average WERs for different Aurora-2 test-conditions. AMS310 represents AMS version 1, whereas AMS310.R and AMS310.I represent version 2 for taking the real and imaginary part, respectively. Δ and ΔΔ depict delta and acceleration coefficients. The last column gives the relative improvement of AMS310.I + MFCCs compared to the Aurora-2 baseline results (MFCCs). Unless otherwise specified, MFCCs include Δ and ΔΔ in this presentation.
0-20 dB
For set A+B
ØWER [%] Clean 20 dB 15 dB 10 dB 5 dB 0 dB -5 dB Set A Set B Set C
AMS310
AMS310.R
AMS310.I
MFCCs
ϱ͕ϱϱ� ϲ͕ϲϵ� ϴ͕ϰϲ� ϭϵ͕ϰϰ� ϰϭ͕ϲϳ� ϳϮ͕ϵϬ� ϵϮ͕ϳϯ� ϯϬ͕Ϭϳ� Ϯϵ͕ϲϬ� ϯϴ͕Ϭϭ�
ϱ͕ϴϳ� ϲ͕ϰϲ� ϴ͕ϴϰ� ϭϴ͕ϱϰ� ϯϯ͕ϰϱ� ϲϬ͕ϴϰ� ϵϬ͕ϴϰ� Ϯϱ͕Ϯϲ� Ϯϱ͕ϵϵ� Ϯϴ͕ϵϯ�
ϭ͕Ϭϲ� ϲ͕ϯϯ� ϭϲ͕ϭϰ� ϯϳ͕ϯϯ� ϲϰ͕ϯϬ� ϴϰ͕ϭϲ� ϵϭ͕ϴϰ� ϯϴ͕ϴϴ� ϰϰ͕ϰϯ� ϯϯ͕ϯϮ�
ϳ͕ϰϬ� ϵ͕Ϯϱ� ϭϯ͕ϳϬ� Ϯϲ͕ϴϴ� ϱϬ͕ϱϲ� ϳϯ͕ϴϴ� ϴϲ͕ϱϬ� ϯϲ͕ϲϬ� ϯϯ͕ϭϭ� ϰϲ͕ϰϬ�
MFCCs AMS310.I AMS310.I (without Δ & + MFCCs + MFCCs ΔΔ) (without Δ & ΔΔ) ϯ͕ϬϮ� Ϯ͕Ϯϱ� Ϭ͕ϵϴ� ϭϳ͕ϴϬ� ϯ͕ϰϴ� ϭ͕ϳϰ� ϯϯ͕ϭϰ� ϳ͕ϳϱ� ϰ͕Ϭϯ� ϱϱ͕ϳϳ� ϭϴ͕ϰϮ� ϭϭ͕ϱϰ� ϳϳ͕Ϯϳ� ϯϰ͕ϱϰ� ϯϬ͕Ϭϴ� ϴϴ͕ϯϮ� ϲϯ͕ϲϲ� ϲϱ͕ϲϴ� ϵϭ͕Ϭϵ� ϴϵ͕ϭϲ� ϴϵ͕ϮϮ� ϱϱ͕Ϯϯ� Ϯϰ͕ϴϴ� ϮϮ͕ϯϲ� ϱϯ͕ϲϵ� Ϯϲ͕Ϯϱ� ϮϮ͕ϴϳ� ϲϮ͕Ϭϲ� Ϯϱ͕ϴϯ� ϮϬ͕ϱϱ�
ϲ͕ϵϮ� ϲϯ͕ϴϭ� ϲϵ͕Ϭϰ� ϲϲ͕ϵϳ� ϱϮ͕ϳϰ� ϮϮ͕Ϭϳ� Ϯ͕ϵϭ� ϱϬ͕ϭϴ� ϱϵ͕ϲϲ� ϰϳ͕ϲϱ�
[3] T. Arai, M. Pave, H. Hermansky, and C. Avendano, “Intelligibility of speech with filtered time trajectories of spectral envelopes,” Proc. ICSLP 96, 1996.
Table 3: WERs for test set D. RIR8
RIR7
RIR6
RIR5
RIR4
RIR3
RIR2
RIR1
Clean MFCCs AMS310.I AMS310.I +MFCCs
Relative Improvement / MFCCs
ϭ͕ϭ� ϯ͕ϭ� ϯϭ͕ϳ� ϰϮ͕Ϭ� ϲϲ͕Ϯ� ϭϴ͕ϭ� ϰϭ͕ϯ� ϯϭ͕ϵ� ϲϮ͕ϵ� ϱ͕ϵ� ϭϬ͕ϭ� ϭϳ͕ϳ� ϯϭ͕ϴ� ϲϬ͕Ϭ� ϴ͕ϰ� ϯϭ͕Ϭ� ϳ͕ϯ� ϰϵ͕Ϭ� ϭ͕Ϭ� Ϯ͕Ϭ� ϭϭ͕ϲ� ϮϮ͕ϲ� ϱϲ͕ϭ� Ϯ͕ϵ� ϮϮ͕ϰ� Ϯ͕ϰ� ϰϲ͕ϴ�
8. CONCLUSIONS Results indicate that the optimal temporal filter extent for modulation frequency analysis is around 310 ms in the sense of best noise robustness and low performance degradation for clean speech due to a reduced time resolution. It is also demonstrated that preserving phase information in modulation frequency domain significantly increases ASR performance. In this context it is shown that an odd analysis basis function has advantages when regarding the corresponding MTFs and ASR performances. It is useful to combine dynamic features such as the AMS with short-term spectral information of MFCCs. Modulation features are more robust against noise and room reverberation than conventional features such as MFCCs. Especially promising is the ability of AMS features to benefit from the presence of strong early reflections compared to the reverberation field. On the Aurora-2 task, our best feature set reached an overall relative improvement of 53,5 % for clean-condition training. This is still behind the ETSI advanced front-end (AFE), which reached a relative improvement of 68,7% [14]. A further improvement of WERs is expected from combining AFE preprocessing with the proposed AMS computation.
9. REFERENCES [1] R. Drullman, J.M. Festen, and R. Plomp, “Effect of temporal envelope smearing on speech reception,“ J. Acoust Soc. Am. 95, pp. 1053-1064, 1994a. [2] R. Drullman, J.M. Festen, and R. Plomp, “Effect of reducing slow temporal modulations on speech reception,“ J. Acoust Soc. Am. 95, pp. 2670-2680, 1994b.
5495
[4] N. Kanedera, T. Arai, H. Hermansky, and M. Pavel, “On the relative importance of various components of the modulation spectrum for automatic speech recognition,” Speech Communication 28, pp. 43-55, 1999. [5] S. Furui, “Speaker-independent isolated word recognition using dynamic features of speech spectrum,” IEEE Trans. Acoust. Speech Signal Process. 34(1), pp. 52-59, 1986. [6] H. Hermansky, and N. Morgan, “RASTA processing of speech,” IEEE Trans. on Speech and Audio Processing 2(4), pp. 578-589, 1994. [7] S. Ganapathy, S. Thomas, and H. Hermansky, “Comparison of modulation features for phoneme recognition,” Proc. ICASSP 2010, pp. 5038-5041, 2010. [8] S.A. Zahorian, H. Hu, Z. Chen, and J. Wu, “Spectral and temporal modulation features for phonetic recognition,” Proc. Interspeech 2009, pp. 1071-1074, 2009. [9] B. Kollmeier, and R. Koch, “Speech enhancement based on physiological and psychoacoustical models of modulation perception and binaural interaction,” J. Acoust. Soc. Am. 95(3), pp. 1593-1602, 1994. [10] G. Langner, and C.E. Schreiner, “Periodicity coding in the inferior colliculus of the cat. I. Neuronal mechanisms,” J. of Neurophysiology 60, pp. 1799-1822, 1988. [11] T. Dau, and B. Kollmeier, “Modeling auditory processing of amplitude modulation. I. Detection and masking with narrowband carriers,” J. Acoust. Soc. Am. 102(5), pp. 2892-2905, 1997. [12] H.G. Hirsch, and D. Pearce, “The aurora experimental framework for the performance evaluations of speech recognition systems under noisy conditions,” In: ISCA ITRW ASR, 2000. [13] N. Kanedera, H. Hermansky, and T. Arai, “On properties of modulation spectrum for robust automatic speech recognition,” Proc. ICASSP 1998, pp. 613-616, 1998. [14] G. Hirsch, and D. Pearce, “Applying the advanced ETSI frontend to the Aurora-2 task”, technical report version 1.1, 2006.