BEHAVIOUR & INFORMATION TECHNOLOGY, JULY–AUGUST
2004,
VOL.
23,
NO.
4, 225–235
An empirical evaluation of textual display configurations for supervisory tasks AVI PARUSH Department of Psychology, Carleton University, B552 Loeb Building, 1125 Colonel By Drive, Ottawa, ON, Canada, K1S 5B6; e-mail:
[email protected]
Abstract. There is often a need to display logged information textually for real-time event-based supervisory tasks. Textual display design can follow several directions that reflect a tradeoff between a visual load and an operational load. The study reported here was designed in order to examine this tradeoff and its implications for such display design. An eventbased monitoring and handling task was used with different event types having either a high or a low handling priority. The events were presented in four different display configurations varying in their degree of visual and operational load. The specific performance indices were event dwelling times, event handling proportion, and handling errors. In general it was found that the high priority events were handled faster and more accurately than the low priority events. In addition, performance with the various display configurations was dependent upon event type. These findings are discussed in terms of visual vs. operational load tradeoff and its contextsensitivity. Some implications for display design and further research on event presentation approaches are discussed.
1. Introduction 1.1. Displaying events in supervisory control contexts Power plant operation, network management, manufacturing systems operation, mass transportation management, and others, are contemporary examples for complex systems and tasks where vast amounts of data are being monitored and handled by machines. Yet, human experience and intuition may be required whenever the diagnostic process (i.e., recognizing that there is a problem and identifying the source of the problem) and the associated decision-making process (i.e., deciding how to handle the problem) cannot be fully automated. Thus, the human operator may sometimes be required to view and handle information of individual events in real time or close to it in order to
perform supervisory tasks such as fault diagnosis and handling (e.g., Brann et al. 1996, Thronesbery and Schreckenghost 1998). One of the shared characteristics of such diverse complex systems is the occurrence of discrete events defined in space and time, such as status changes or specific faults. While most of the information is presented to the human operator graphically, more focused event information is typically presented in an alphanumeric format to augment the more general graphic displays (Thronesbery and Malin 1998). The need to display logged information textually for realtime event-based supervisory tasks still presents some design challenges that were not fully investigated. The main objective of this study was to empirically examine some configurations of textual information display for real-time human supervision of multiple events. The design of alphanumeric displays has been a topic for extensive research (e.g., Galitz 1997, Tullis 1997, for a general review on display design issues). Tullis’ earlier studies (1981) focused on textual displays and showed that there was a significant improvement in visual search times in re-designed screens as compared to the original screens. The layout factors that Tullis studied were global and local densities, grouping, and complexity. Other earlier studies (e.g., Norman et al. 1986, Mills and Weldon 1987) identified a variety of factors that influence reading from textual displays. Those factors included layout and formatting parameters such as number of characters per line, line length, and number of text lines. Additional studies (e.g., Callan et al. 1977, Treisman 1982, Staggers 1993) further confirmed that greater information density increased search times and errors. Other studies (e.g., Burns et al. 1986) showed
Behaviour & Information Technology ISSN 0144-929X print/ISSN 1362-3001 online # 2004 Taylor & Francis Ltd http://www.tandf.co.uk/journals DOI: 10.1080/01449290410001682234
226
A. Parush
that other factors, such as alignment and consistency in location of elements on the screen, had a positive impact on search times. Layout parameters, such as density, grouping, and the number of elements, were taken as the underlying factors of screen complexity (e.g., Tullis 1988, Comber and Maltby 1997). Parush et al. (1998) studied screen complexity in textual Graphic User Interface (GUI) and found that alignment and grouping had a relatively larger impact on visual search as compared to factors such as density. Taken together, those studies showed that various parameters of display layout configuration had a strong impact on user performance. The many findings of research on textual display design can serve as a good basis for guiding general textual display design. However, the research offers little with respect to variables typical of supervisory contexts. Such contexts are typically associated with two basic requirements: visual, where the user is required to visually search for the relevant information, and operational, where the user is required to act upon the information. Consequently, display design can follow two major directions in order to reduce the potential load on the operator. One direction is to minimize the amount of simultaneously displayed event-related information (e.g., the number of discrete events, event details, or event sources), thus reducing the visual load, supporting better visual search, and enhancing the diagnostic and decision making capability of the operator (e.g., Dodson and Shields 1978, Thronesbery et al. 1999). However, such an approach may force the operator to perform more search and navigation actions in order to access a required event and act upon it, thus increasing the operational load and possibly impairing the efficiency of the task performance. The other design direction is to maximize the amount of simultaneously displayed event-related information in order to provide immediate access to as many events and as many details as possible. However, such an approach may create a greater visual load that can influence visual search and the overall efficiency of the supervisory task. In summary, the two display design approaches are associated with a tradeoff between visual data overload and operational load and the effects of this tradeoff on the performance of human supervisory tasks. This tradeoff is typical of many contemporary systems requiring the presence of the human operator in the control loop for supervisory purposes. Many systems of today’s information age are associated with increasingly large amounts of information, often requiring close human scrutiny. Thus, the understanding of the tradeoff between visual and operational load is a critical issue that needs further investigation.
1.2. Some system variables in supervisory control The above outlined tradeoff stemming from display design approaches should be investigated in conjunction with system variables that are context and task-related. Some of those variables are: 1.2.1. Event quantity: When the operator is required to attend and follow an incoming stream of events with similar characteristics, such as a textual display of the event’s parameters, the number of the events can affect the overall performance of the task. Kerr (1973) showed that the human operator has difficulty simultaneously executing tasks with identical structures. A stream of events will thus be monitored and handled in a serial fashion. The more events that enter the system, the more likely the operator will not be able to handle later events. This can be a problem in a typical supervisory task where later events may be more important than earlier ones or if time pressure does not permit the handling of later events altogether. 1.2.3. Event occurrence rate: When the operator is required to attend to events occurring at varying rates, there may be too many to handle in a given available time frame. Such time stress may affect attention and processing capabilities which, in turn, are influenced by the way information is presented. Temporal constraints during supervisory control have been found to influence performance with various display types and designs (e.g., Coury and Boulette 1992, Moray et al. 1994) primarily with respect to the need to attend to individual display elements as compared with a more general, integrated information display. 1.2.4. Event type or source: The operator can be faced with events of varying importance, priorities and implications as far as the overall objective of the supervisory task is concerned. For example, events in a manufacturing context or network management can originate from several sources in the system with varying importance or priority. Events can also be categorized by any given criteria with varying priorities such as their impact level upon the overall performance of the system. The display of many events simultaneously can pose a problem to find the more significant or critical data and handle it. Thus, similar events in large quantities, occurrence rate, and type or sources of events are some of the factors that, with a poor display design, can overload the operator and influence the performance of an eventbased supervisory task. The impact of such factors along with display design factors still requires further investigation.
Textual displays for supervisory tasks 1.3. Objectives and approach of this study In this study, the implications of display design on the visual-operational tradeoff in supervisory tasks were examined. The focus was on the textual display of logged event information for real-time event-based diagnosis and handling tasks. The experimental approach to examine the visual-operational tradeoff was to vary the quantity and detail level of event-related information and examine how it influenced the effectiveness and efficiency of a hypothetical supervisory task. The rationale for this approach was as follows: a high degree of visual load would be achieved by both the presentation of as many events from different sources and as many of their details as possible. This in turn would cause a reduced operational load because events from various sources are immediately accessible to the user. Conversely, a lower degree of visual load would be achieved by the selective presentation of some events from fewer sources and less details for each event. This in turn would cause a higher operational load, because more actions would be required to access non-displayed events and details. The effects of this tradeoff on human supervisory performance were examined as a function of system variables such as event type and event occurrence rate. It was expected that higher event rates would increase operator’s general workload and thus focus further the examination of the tradeoff between visual and operational load.
2. Method 2.1. Participants The experiment sample included 82 participants – 39% female, and 61% male. Their ages ranged from 18 – 31 years old, with the mean age of 24.4 and a standard deviation of 3 years. Most participants had at least a high school diploma, with 44% having a university undergraduate degree. All participants were proficient with mouse-based interaction (Point & Click & Drag & Drop) and MS Windows. In addition, all participants had normal vision.
2.2. Experimental tasks In order to test human performance of supervisory tasks as a function of the various display design approaches, a simulation of a hypothetical system was developed. The rationale for the system’s concept was to emulate contexts such as network management, manu-
227
facturing floor management, power stations command and control, command and control of un-attended vehicles (e.g., Thronesbery et al. 1999), multi-sensor surveillance systems, or contact centers. The ‘cover story’ of the simulated system in this experiment was a network consisting of five sub-systems, each having a primary element and four sub-elements. The rationale for the experimental task was to simulate situations where faults occurring in the system generated multiple alarm-notices that were considered as the events to be handled. The simulated system was capable of categorizing the events as either critical or normal. A critical event was a traffic-influencing event, and a normal event was not influencing traffic in the network. The final handling of each event, however, required human diagnosis and handling. These events were logged and displayed in textual logs for each sub-system. The objective of the experimental task was to determine whether to discard an event or handle it in one of three different ways. The event handling policy was built as a step-wise decision making process. The initial step was to notice whether the event was normal or critical. Critical events had a higher handling priority relative to normal events. Within a given priority category, the handling requirement was to follow a First-In-First-Out strategy. In other words, a new event had a lesser priority to be handled than an ‘old’ event of the same category. Once an event was noted as normal or critical, the next step was to examine additional event information in the primary element and in at least two sub-elements in the same sub-system. When one of the event parameters exceeded a prescribed threshold, the final handling could be determined. It should be noted that there were events that the inspection of the information from the primary elements and only two sub-elements was sufficient to make the handling decision. In other cases, further inspection of additional parameters was required and this forced the user to seek more information about the event. Thus, the handling policy designed in the above manner provided a good test of the display design approaches.
2.3. Experimental setup and apparatus 2.3.1. Experimental design: The basic rationale of the experimental design was to create the tradeoff between visual load and operational load by varying the amount of displayed event-related information. A higher degree of visual load was achieved by displaying events from all sources and all the details of each event. Conversely, a lower degree of visual load was achieved by presenting events from only one source and only some of the event details. The degree of operational load
228
A. Parush
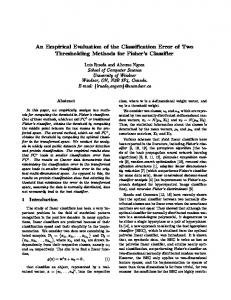
was dependent upon the amount of actions the participant was required to perform in order to handle each event. This manipulation was tested in conjunction with some system variables that are context and task related. The amount of displayed event-related information was varied using two display factors each having two configurations. The combination of these two factors generated four display configurations presented schematically in figure 1. The two display factors were as follows: (1)
(2)
Number of displayed event logs: Grouping of related data and number of items in a group were found as good predictors of performance (e.g., Burns et al. 1986, Parush et al. 1998, Steveler and Wasserman 1984). Thus, the events for each subsystem in the simulated system were grouped and displayed in a time-ordered event log. One or five event logs were displayed in order to vary the overall amount of events displayed from each source. Events from all sub-systems were presented when all five logs were displayed which yielded a high degree of visual load. However, such a display also yielded a low degree of operational load because more events from all sources were immediately accessible to the user. Conversely, events from only one source were presented when one log was displayed and the other four sub-systems were represented each by a summary display. This approach yielded a display with a low degree of visual load. However, such a display also yielded a high degree of operational load because the user was required to perform more actions to access events from other sources; Display layout: In order to vary the amount of details presented per event, an approach similar to the one studied by Thronesbery et al. (1999) was employed. In this approach, events are presented with only partial information and participants are required to select an event and view the rest of its data in a separate area on the screen, thus producing a split screen. The display configurations in this study consisted of either presenting all parameters for a given event, a full screen, or presenting less parameters for a given event, a split screen. Presenting only part of the parameters of each event in the split screen yielded a lower degree of visual load (but see Duchnicky and Kolers 1983, for the detrimental effects of narrower screen width on reading performance). However, since the handling decision sometimes required the access and
retrieval of the hidden parameters, the split screen yielded a higher operational load (see also Thronesbery et al. 1999). Presenting all the parameters for each event in the full screen yielded a high degree of visual load. However, since no additional actions were required in order to access all the information for a given event, this screen yielded a lower degree of operational load. In addition, the experiment included the following two system-oriented factors: (1)
(2)
Event type, normal or critical. The handling policy in this study was that critical events, from any of the sub-systems, had to be handled before normal events. The purpose of having this manipulation was to force the participant to monitor all the information from all sub-systems at all times; Event occurrence rate, high and low. This factor enabled the manipulation of the time constraints on the supervisory task (e.g., Coury and Boulette 1992, Moray et al. 1994) and assess whether and how it was related to the display variables.
The experimental design was fully factorial with repeated measures. The Display Layout (full or split screen) was a between-participant factor. The number of displayed logs, event type, and event occurrence rate were all within-participant (repeated measures) factors. 2.3.2. Screens: The combination of the two display layouts, full and split, and the number of event logs, one or five, produced four different screen designs. A schematic representation of the four screens is presented in figure1. Each of the four screens consisted of three main areas: (1)
(2)
The event handling area: In the top area there were four buttons, each representing one of the four handling possibilities; The event log area: In the centre area, the event logs and additional details for one or more subsystems were presented. The events generated by a given sub-system were displayed in a timeordered textual log, and the information for each included 16 hypothetical numerical parameters.
The events in the event log were displayed according to their arrival time; i.e., the most recent event was displayed at the top of the log, and the earliest event was displayed at the bottom of the log. This area
229
Textual displays for supervisory tasks
a
Handle 1
Handle 2
Handle 3
Discard
Critical Critical Critical
Critical
Critical 3:52:01 3 3:45:12 5 System Name
3:52:01 3 3:45:12 5 System Name
Handle 1
3:52:01 3 3:45:12 5 System Name
3:52:01 3 3:45:12 5 System Name
Handle 2
Handle 3
Discard
b Critical Critical
Critical Critical Critical
Handle 1
c
Handle 2
Handle 3
Discard
Critical Parameter 1 Parameter 2 Parameter 3
698 6,452 34%
Parameter 1 Parameter 2 Parameter 3
980 9,832 75%
Critical Critical
Critical
Critical 3:52:01 3 3:45:12 5 System Name
d
Handle 1
3:52:01 3 3:45:12 5 System Name
Handle 2
3:52:01 3 3:45:12 5 System Name
Handle 3
3:52:01 3 3:45:12 5 System Name
Discard
Critical
Parameter 1 Parameter 2 Parameter 3
698 6,452 34%
Parameter 1 Parameter 2 Parameter 3
980 9,832 75%
Critical
Critical
Critical Critical Critical
Figure 1. Schematic representation of the four experimental screens, where screens a, b are full layout with one and five logs, respectively; and screens c and d are split layout with one and five logs, respectively.
230
A. Parush
included a summary counter for the number of normal and critical events currently in the log (i.e., not handled), and the arrival time of the earliest event of each category. The number of displayed event logs was either one (figure 1a and 1c) or five logs (figures 1b and 1d). The Event Log area had two different layouts: Full: The display of all the parameters for each event, in any of the displayed logs (figures 1a and 1b); (b) Split: The display of some of the parameters for each event, in any of the displayed logs. Additional details for any selected event were displayed in the left-hand area (figures 1c and 1d);
2.4. Procedure 2.4.1. General: The experiment took place in three settings that provided the ability to run several participants simultaneously. Each participant was assigned randomly to one of the two between-participant conditions: full or split screen. Once assigned, each participant proceeded in the following way:
(a)
(3)
The summary counters area: In the bottom area, counters were displayed for sub-nets that were not displayed in the event log area. These counters were aimed at giving the participant an indication of the arrival of new events to other sub-nets. The number of critical events and normal events were displayed in two separate counters. The number of displayed counters in this area varied between four (figures 1a and 1c), and none (figures 1b and 1d) for one and five displayed logs, respectively.
(1) (2)
(3)
(4) (5)
It should be noted that the screens were designed in Hebrew. This required a right-to-left design (e.g., the event details are to the left of the event log) to match the reading direction. 2.3.3. Apparatus: The simulation was built as a stand-alone Visual Basic program. The program also included the experiment’s running interface and data collection. The simulation ran based on data input files, each including about 1000 different events. The event types, normal or critical, and their parameters were generated randomly in real-time. In addition, the other parameters such as event rate, and critical event rate were determined randomly in real-time. Finally, the program generated randomly the experimental conditions to each participant according to the following decisions: (1)
(2)
(3)
Full or split screen (see figure 1). This decision determined the three screen layouts that were presented to a given participant. Order of presentation of the experimental conditions. This decision determined the order with which one or five logs were presented. Event rates.
General instructions were read out loud by the experimenter; The instructions emphasized the importance of handling events according to the handling policy; No specific directions or hints were given as to how to inspect event details or how to search for any given event; Each of the experiment participants received the handling policy on paper; Each participant then proceeded with the experiment’s programme on an individual basis. In the beginning, each participant went through several practice trials that lasted 3 min. In a preceding pilot study it was found that this was sufficient to reach the asymptotic phase of the learning curve. Then the participants went through each of the three conditions assigned to them randomly by the programme. Each condition started with a random number of events that was equivalent to 3 min and lasted for 3 min. At the end of the 3-min session, the switch to the next condition was self-paced.
2.4.2. Simulation operation: The operational principles of the experimental system were as follows: (1)
(2)
(3)
Event handling: In order to handle an event, the experiment’s participant was required to select the event in the event log, and then select (mouse click) one of the four top buttons, representing the four handling types; Event additional inspection: In order to inspect a given event further (in the split screen), the experiment’s participant was required to select that event. The additional details then appeared in the left-hand area of the screen; Displaying event log of another sub-system: In order to display the event log of another subsystem, the experiment’s participant was required to select (mouse click) the relevant summary counter at the bottom of the screen in the case of a single displayed event log.
231
Textual displays for supervisory tasks 2.4.3. Performance measurements: were measured and calculated: (1)
(2)
(3)
Three parameters
Handling proportion: The proportion of handled and non-handled events relative to the total amount of events in a given session; Handling error: Any handling decision that was different from the correct decision was considered a handling error; Event dwelling time: The time between event entry into the system until it was handled or until the end of the experimental session if it was not handled.
In summary, more critical events were handled in screens with one displayed log as compared to screens with five logs, for both layouts, split and full.
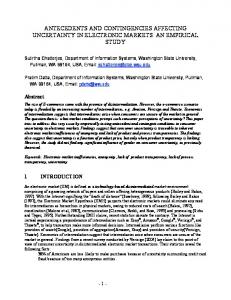
3.2. Event handling errors The number of event handling errors was calculated and summed up for all experimental conditions (see table 2). Error rates for critical and normal events are presented in figure 3. In general, error rates were low and the highest rate was 3.4% for the normal events and 1.3% for critical events. In addition, there were higher error rates in full screen layout as compared to the split screen layout, for
3. Results 3.1. Event handling proportion
Table 1.
Non-Handling Rate (%)
Critical Events 100 90 80 70 60 50 40 30 20 10 0
Split Full
1
5
Number of Displayed Logs
Normal Events Non-Handling Rate (%)
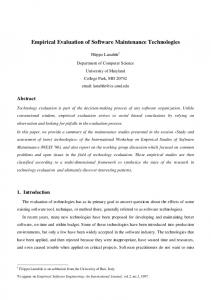
All events that were not handled were counted and their frequencies tabulated according to the experimental conditions (see table 1). In general, the proportion of critical events that were not handled ranged between 0 to about 9%. In contrast, it was found that most normal events were not handled at all, ranging from about 81 to about 91% across all experimental conditions (see figure 2). A w2 analysis was performed on the event-handling frequency data in order to determine whether it was affected by the display-related factors. A significant association was found between the frequency of nonhandled critical and normal events and between the number of displayed event logs. This association, which can be seen in insert figure 2, was found for both a full screen (w2 = 21.59, p 5 0.01), and for the split screen (w2 = 21.53, p 5 0.01). It can be seen in the top panel of insert figure 2 that for both screen layouts, full and split, the proportion of non-handled critical events was affected by the number of displayed event logs. More events were not handled in display layouts with five event logs as compared to screens with only one event log. There was no significant effect for the number of displayed event logs on the proportion of non-handled normal events.
100 90 80 70 60 50 40 30 20 10 0
Split Full
1
5
Nimber of Displayed Logs Figure 2. Proportion of non-handled events as a function of the number of displayed logs in full and split layouts, for both critical events (top) and normal events (bottom).
Frequency of non-handled events (along with the total number of events) presented for both critical and normal events, for each of the display configurations. Critical events
Number of logs
Normal events
Screen layout
Full
Split
Full
Split
1 5
24 (695) 52 (759)
19 (580) 57 (600)
2335 (2841) 2626 (3031)
2136 (2419) 2197 (2458)
232 Table 2.
A. Parush Frequency of error (along with the number of handled events) presented for both critical and normal events, for each of the display configurations. Critical events
Handling Error Rate (%)
Number of logs
Screen layout
Full
Split
Full
Split
1 5
2 (671) 9 (707)
3 (561) 3 (543)
17 (506) 9 (405)
1 (283) 1 (261)
Critical Events
4 3.5 3 2.5 2 1.5 1 0.5 0
Normal events
Split Full
1
5
type and event type. In display layout with one displayed log, there were more handling errors in the full screen configuration as compared to the split screen, particularly for normal events. In summary, the differences between handling error rates of critical and normal events occurred primarily in the full screen layout. In addition, there were significantly more errors in handling normal events in full screen configurations with one event log.
Handling Error Rate (%)
Number of Displayed Logs
3.3. Event dwelling times
Normal Events
4 3.5 3 2.5 2 1.5 1 0.5 0
Split Full
1
5
Number of Displayed Logs Figure 3. Proportion of event handling errors as a function of the number of displayed logs in full and split layouts, for both critical events (top) and normal events (bottom).
the normal events, and in screens with five displayed logs, for the critical events. A w2 analysis was performed to test the association between the frequency of handling errors in the full and the split screen layouts as a function of the number of displayed logs and event type. The analysis indicated that, in the full screen layout, there was a significant association between handling errors and the number of displayed logs and event type (w2 = 7.47; p 5 0.05). It can be seen in figure 3, for the full screen layout, that there was an average increase of 73% between the error rates of critical and normal events. Specifically, there were increases of 89%, for screens with one displayed log, in handling normal events as compared to the critical events. No significant association was found in the split screen layout. In addition, there was a significant association (w2 = 8.07; p 5 0.05) between error rates and display
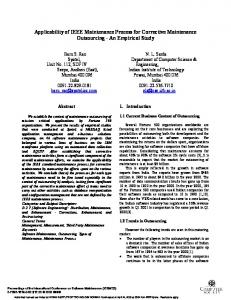
The duration that an event remained in the system until handled or until the end of the experimental session was summed up for all experimental conditions. Analysis of Variance (ANOVA) with repeated measures for the within-participant factors was run in order to determine the effects of the various experimental conditions on the event dwelling times. The dwelling times of critical events were significantly shorter than those of normal events (F = 2604; DF = 1109; p 5 0.01; Effect size = 0.960). This finding was consistent across all conditions. The mean dwelling times were significantly shorter for events handled during a low event rate as compared to a high event rate (F = 27.4; DF = 1109; p 5 0.01; Effect size = 0.201). The dwelling times of events displayed in the full screen layout were significantly shorter than the dwelling times of events displayed in the split screen (F = 10; DF = 1109; p 5 0.01; Effect size = 0.084). This was consistent for both critical and normal events (there was no significant interaction between screen layout and event type). Finally, there were also significant differences in dwelling times as a function of the number of displayed event logs (F = 7.8; DF = 1109; p 5 0.01; Effect size = 0.067). Event dwelling time was shorter in screen configurations with five event logs as compared to screens with only one displayed event log. There was a second-order significant interaction between the event type and the two display variables: screen configuration and number of displayed logs (F = 5.7; DF = 1109; p 5 0.01). This interaction can be seen in figure 4.
Mean Dwell Time (s)
Textual displays for supervisory tasks
Critical Events
90 80 70 60 50 40 30 20 10 0
Split Full
1
5
Number of Displayed Logs
Normal Events
Mean Dwell Time (s)
300 250 200
Split Full
150 100 50 0 1
5
Number of Displayed Logs
Figure 4. Mean event dwelling times as a function of the number of displayed logs in full and split layouts, for both critical events (top) and normal events.
It can be seen in the top panel of figure 4 that mean dwelling time in the full screen layout was shorter than in the split screen. In addition, mean dwelling time increased as a function of the number of displayed event logs: longer dwelling times were found for screens with five logs as compared to screens with one displayed log. This pattern was similar for both high and low event rates. This pattern was stronger in the full screen configuration as compared to the split screen configuration. A different pattern can be seen in the bottom panel of figure 4 with respect to the normal events. Mean dwelling time in both the full and split screen configurations decreased as a function of the number of displayed logs: longer dwelling times were found for screens with one displayed log as compared to screens with five displayed logs.
4. Discussion 4.1. Summary of the results Overall, both system variables – event type and event rate – had the most significant impact on performance. Almost all the critical events were handled significantly faster. In contrast, most of the normal events (up to 91% of the normal events that entered the system) were
233
not handled. There was an overall effect of event rate on event dwell time, with shorter dwell times during a low event rate as compared to longer dwell times with high event rate. This finding is in line with other studies showing that temporal constraints during supervisory control influence performance (e.g., Coury and Boulette 1992, Moray et al. 1994). The impact of the display layout factors upon performance was dependent upon event type. More critical events were handled in screens with only one displayed log, particularly in the full screen layout. This pattern is further supported by the finding that the shortest mean dwelling time for critical events was in full layout screens with one displayed event log (see Insert figure 4). In addition, the largest and most significant difference in handling error rates between critical and normal events was found in full screen layouts with one displayed log. The number of displayed logs did not affect the handling rate of normal events. However, there was a significantly higher handling error rate for normal events in full screen layout with one displayed log when compared to the split screen layout. In addition, the mean dwelling time of normal events was inversely related to the number of displayed logs: there were shorter dwelling times in screens with five displayed logs as compared to one log. Taken together, the findings here suggest that handling performance of critical events was best in full screen layout with only one displayed event log. This latter finding is in agreement with some earlier findings (e.g., Duchnicky and Kolers 1983) where wider lines produced faster reading rates than shorter lines, in textual displays. In contrast, normal events were handled better in screens with five displayed event logs, as is manifested by the event dwell times. The impact of full vs. split screen layout on the handling of normal events was apparent only in terms of error rate, with a higher rate in the full screen layout.
4.2. Performance tradeoff: impact of the handling policy One factor that can account for the patterns in this study is the policy that dictated a higher handling priority for the critical events and a lower priority for the normal events. Kerr (1973) showed that, in dealing with a stream of events with identical structure, the human operator would monitor and handle the events in a sequential fashion. A similar strategy was apparently adopted here. In order to comply with the handling policy, participants had to follow two sequential operational phases. In the first phase participants had a single task: find and handle only critical events and completely ignore the normal events. The observed performance indicates that in order to search and find the next required critical event for
234
A. Parush
handling it was easier to scan a full single event log, and then proceed to the next one, either by searching in the same displayed log or by selecting another log to be fully displayed. The second phase of the monitoring and handling operation started once the participants finished handling all the currently waiting critical events and proceeded to find the normal events. However, in this second phase, participants had two, and sometimes competing, tasks: (1) Find as many ‘old’ normal events as possible and handle them according to the First-InFirst-Out policy; and (2) Continue to look for the arrival of new critical events in order to immediately select and handle them, thus complying with the overall handling policy. In this situation, the display of the five event logs made it easier to immediately select any new incoming critical event, on the one hand, and still continue to search and find the next normal event required for handling. This may also account for the higher error rate in handling normal events in the full layout screen with one displayed log. This latter configuration was less supportive of fast reaching new critical events while handling the normal events, thus more attention had to be allocated to look for the critical events at the expense of correctly handling the normal events. The findings and the possible account outlined above reflects a performance tradeoff in monitoring and handling critical vs. normal events. The performance tradeoff is indicative of the visual vs. operational load tradeoff caused by the various display configurations. It seems that a reduction in the visual load, a full layout with a single log in this study, is more supportive of a supervisory task requiring focused attention on only one event type. In contrast, a reduction in the operational load, a full layout with five logs in this study, is more supportive of a supervisory task requiring divided attention on more than one event type each having a different handling priority.
with varying handling priorities. Practically this means to have on the screen elements that are related to the various tasks in order to enable easier attention division and better access to the required events.
4.4. Implications for further research In the preceding section it was suggested that the display should be different as a function of the changing operational context. Providing the human operator with the right interface at the right time, often known as adaptive interface, has been the subject of research for some time, some of it related to supervisory tasks in manufacturing contexts (e.g., Dunkler et al. 1988, Mitchell and Saisi 1987, Haas and Repperger 1998). Dynamic features of the task context and state characteristics of the human operator and the task have also been investigated (e.g., Hess et al. in press). However, further research is needed to identify and map the appropriate relationship between adaptive interface features and the dynamics of task contexts. The mapping should be such that the adaptive nature of the interface to changing patterns in the context will not become a disturbing factor but rather enhance supervisory performance.
Acknowledgments The work reported here was done while the author was an adjunct researcher at the Industrial Engineering Department in Tel Aviv University, Israel. I thank Prof. Avy Shtub for his support in running the study while he was chairperson of that department.
References 4.3. Implications for supervisory textual display design The findings here suggest that various screen configurations are more or less supportive of different aspects of the supervisory tasks and that depends primarily on contextual, system-oriented, factors such as event types and their handling policy. A general implication is to reduce as much as possible the visual load for very focused supervisory tasks such as handling a single type of events having uniform handling priority. Practically this suggests having on the screen only elements that are directly related to the focused task. Conversely, reduce the operational load if the task requires the division of focus among various aspects of the system, such as handling different types of events from various sources
BRANN, M. D., THURMAN, D. A. and MITCHELL, C. M. 1996, Human interaction with Lights-out automation: A field study. Proceedings of the 3rd Annual Symposium on Human Interaction with Complex Systems. Dayton, OH, 276 – 283. BURNS, M. J., WARREN, D. L. and RUDISILL, M. 1986, Formatting space-related displays to optimize expert and non-expert user performance. Proceedings of CHI’86 Conference on Human Factors in Computing Systems, ACM, NY. CALLAN, J. R., CURRAN, L. E. and LANE, J. L. 1977, Visual search times for navy tactical information displays (Rep. No. NPRDC-TR-77-32). San Diego, CA: Navy Personnel Research and Development Center (NTIS No. AD A040543). COMBER, T. and MALTBY, J. R. 1997, Layout complexity: Does it measure usability? Proceedings of Interact ’97 Conference on Human-Computer Interaction, pp. 623 – 626.
Textual displays for supervisory tasks COURY, B. G. and BOULETTE, M. D. 1992, Time stress and the processing of visual displays. Human Factors, 34(6), 707 – 725. DODSON, D. W. and SHEILDS, N. L. Jr. 1978, Development of user guidelines for ECAS display design (Vol. 1) (Report No. NASA-CR-150877). (Huntsville, AL: Essex Corp.). DUCHNICKY, R. L. and KOLERS, P. A. 1983, Readability of text scrolled on visual display terminals as a function of window size. Human Factors, 25, 683 – 692. DUNKLER, O., MITCHELL, C. M., GOVINDARAJ, T. and AMMONS, J. C. 1988, The effectiveness of supervisory control strategies in scheduling flexible manufacturing systems. IEEE Transactions on Systems, Man, and Cybernetics, SMC-18, 223 – 237. GALITZ, W. O. 1997, The essential guide to user interface design (New York: John Wiley and Sons, Inc). HAAS, M. W. and REPPERGER, D. W. 1998, Automated adaptive control of display characteristics within future air force crew stations. Proceedings of the American Control Conference, Philadelphia, Pennsylvania, June, pp. 450 – 452. HESS, S. M., RAY, W. J. and GOLDBERG, J. H. in press, Driving system adaptation: Disambiguating non-invasive physiological measures with cognitive task analysis. In L. Hettinger and M. Haas (eds) Psychological Issues in the Design and Use of Adaptive Virtual Interfaces (Mahwah, NJ: Lawrence Erlbaum Associates). KERR, B. 1973, Processing demands during mental operations. Memory and Cognition, 1, 401 – 412. MITCHELL, C. M. and SAISI, D. L. 1987, Use of model-based qualitative icons and adaptive windows in workstations for supervisory control systems. IEEE Transactions on Systems, Man, and Cybernetics, 27, 573 – 643. MILLS, C. B. and WELDON, L. J. 1987, Reading text from computer screens. ACM Computing Surveys, 19(4), 329 – 358. MORAY, N., LEE, J. and VINCENTE, K. J. 1994, A direct perception interface for nuclear power plants. Proceedings of the Human Factors and Ergonomics Society 36th Annual Meeting, USA, 1464 – 1468. NORMAN, K. L., WELDON, L. J. and SHNEIDERMAN, B. 1986, Cognitive layouts of windows and multiple screens for user interfaces. International Journal of Man Machine Studies, 25(2), 229 – 248.
235
PARUSH, A., NADIR, R. and SHTUB, A. 1998, Evaluating the layout of graphical user interface screens: Validation of a numerical, computerized model. International Journal of human Computer Interaction, 10(4), 343 – 360. STAGGERS, N. 1993, Impact of screen density on clinical nurses’ computer task performance and subjective screen satisfaction. International Journal of Man-Machine Studies, 39, 775 – 792. STEVELER, D. J. and WASSERMAN, A. I. 1984, Quantitative measures of the spatial properties of screen designs. Proceedings of INTERACT ‘84 Conference on Human Computer Interaction, London, England. THRONESBERY, C. and MALIN, J. 1998, Field guide for designing interaction with intelligent systems. NASA Technical Memorandum, NASA TM-1998-208470. THRONESBERY, C. and SCHRECKENGHOST, D. L. 1998, Human interaction challenges for intelligent environmental control software. Proceedings of the 28th International Conference on Environmental Systems. Danvers, MA. THRONESBERY, C., CHRISTOFFERSEN, K. and MALIN, J. 1999, Situation-oriented displays of space shuttle data. Proceedings of the Human Factors and Ergonomics Society 43rd Annual Meeting, USA, 284 – 288. TREISMAN, A. 1982, Perceptual grouping and attention in visual search for features and for objects. Journal of Experimental Psychology: Human Perception and Performance, 8, 194 – 214. TULLIS, T. S. 1981, An evaluation of alphanumeric, graphic and color information displays. Human Factors, 23, 541 – 550. TULLIS, T. 1988, A system for evaluating screen formats: Research and application. In H. R. Hratson and D. Hix (eds) Advances in Human-Computer Interaction, Volume 2, (Norwood, NJ: Ablex Publishing). TULLIS, T. S. 1997, Screen design. In M. Helander, T. K. Landauer and P. Prabhu (eds) Handbook of Human Computer Interaction, 2nd edn, (Amsterdam: Elsevier).