ABSTRACT: The Enhanced Bayesian THERP (Technique for Human Reliability Analysis) method has been successfully ... was to predict failure probabilities of operator actions defined ... The human error probability is derived using the time-.
Safety, Reliability and Risk Analysis: Theory, Methods and Applications – Martorell et al. (eds) © 2009 Taylor & Francis Group, London, ISBN 978-0-415-48513-5
An evaluation of the Enhanced Bayesian THERP method using simulator data Kent Bladh Vattenfall Power Consultant, Malmö, Sweden
Jan-Erik Holmberg VTT (Technical Research Centre of Finland), Espoo, Finland
Pekka Pyy Teollisuuden Voima Oy, Helsinki, Finland
ABSTRACT: The Enhanced Bayesian THERP (Technique for Human Reliability Analysis) method has been successfully used in real PSA-studies at Finnish and Swedish NPPs. The method offers a systematic approach to qualitatively and quantitatively analyze operator actions. In order to better know its characteristics from a more international perspective, it has been subject to evaluation within the framework of the ‘‘HRA Methods Empirical Study Using Simulator Data.’’ This paper gives a brief overview of the method with major findings from the evaluation work including identified strengths and potential weaknesses of the method. A number of possible improvement areas have been identified and will be considered in future development of the method.
1 1.1
and help establish a methodology for assessing HRA methods using simulator data.
INTRODUCTION HRA as part of PSA
The modeling and quantification of human interactions is widely acknowledged as a challenging task of probabilistic safety assessment (PSA). Methods for human reliability analysis (HRA) are based on a systematic task analysis combined with a human error probability quantification method. The quantification typically relies on expert judgments, which have rarely been validated by statistical data. 1.2
1.3
Scope
This paper presents an evaluation of the enhanced Bayesian THERP in the pilot phase of the ‘‘HRA Methods Empirical Study Using Simulator Data.’’ Major findings from this evaluation are summarized. Presentation of the outcomes of the international study is outside the scope of this paper.
International study
In order to compare different HRA methods an international study ‘‘HRA Methods Empirical Study Using Simulator Data’’ has been initiated using actual simulator data as reference for the comparison (Lois et al 2007 & Dang et al 2008). The overall goal of the international HRA method evaluation study is to develop an empirically-based understanding of the performance, strengths, and weaknesses of the HRA methods. It is expected that the results of this work will provide the technical basis for the development of improved HRA guidance and, if necessary, improved HRA methods. As a first step in the overall HRA method evaluation study, a pilot study was conducted to obtain initial data
2 2.1
PILOT STUDY SET-UP Overview
The pilot study is based on a set of simulator experiments run in the Halden Reactor Project’s HAMMLAB (HAlden huMan-Machine LABoratory) simulator facility. Fourteen operating crews from an operating nuclear power plant (a pressurized water reactor) participated in a series of performance shaping factor/masking experiments. Without knowledge of the crews’ performances, several HRA analysis teams from different countries, using different methods, performed predictive analyses of the scenarios.
227
2.2
3
Scenarios
In the pilot study, two variants of a steam generator tube rupture (SGTR) scenario were analyzed: 1) a basic case, i.e., a familiar/routinely practiced case, and 2) a more challenging case so called complex case. In the complex case, the SGTR was masked by a simultaneous steamline break and a failure of all secondary radiation indications/alarms. It could be expected that operators have difficulties to diagnose the SGTR. The event sequence involves several operator actions, but this paper is restricted to the first significant operator action of the scenarios, i.e., isolation of the ruptured steam generator (SG). 2.3
HRA analysis teams
In order to facilitate the human performance predictions, the organizers of the experiment prepared an extensive information package for the HRA analysis teams including descriptions of the scenarios, description of the simulator and its man-machine interface, differences between the simulator and the home plant of the crews, procedures used in the simulator, characterization of the crews, their work practices and training. The task of the HRA analysis teams was to predict failure probabilities of operator actions defined, e.g., isolation of the ruptured steam generator, and to qualitatively assess which PSFs affect positively or negatively to success or failure of the crew. The members of the Enhanced Bayesian THERP team included the authors of this paper. 2.4
Time criterion
On the empirical side, time was used as the criterion for defining success/failure of the crew performance. In the SG isolation case, the available time for the operator action was considered from the radiological consequence point of view, not from a core damage point of view. In order to avoid opening of a SG pressure relief valve, the crew should isolate the SG before overfilling it. 2.5
ENHANCED BAYESIAN THERP
The Enhanced Bayesian THERP (Technique for Human Reliability Analysis) method is based on the use of the time-reliability curve introduced in the Swain’s human reliability analysis (HRA) handbook (Swain & Guttmann 1983) and on the adjustment of the time-dependent human error probabilities with performance shaping factors (PSFs) (Pyy & Himanen 1996). The method is divided into a qualitative and quantitative analysis part. 3.1 Qualitative analysis The qualitative analysis consists of a modelling of the scenario with a block diagram and a description of the basic information of each operator action. The purpose of the block diagram is to define the operator actions in relation to relevant process events. The block diagram representation is close to a PSA event tree but is usually a somewhat more detailed model than an event tree. The block diagram can also be used to present the dependencies between operator actions belonging to the same scenario. The purpose of the description of the basic information of each operator action is to consistently characterize main aspects of an operator action, e.g., initiating event, scenario, time windows, support from procedures and MMI, practical maneuvers needed in the action and other noteworthy information. The block diagram is also used to show the assumed dependencies between operator actions belonging to the same scenario. The blocks used in the diagram should have exact correspondence with functional events (in event trees or system fault trees) of the PSA-model. This is important in cases where operator action basic events are modeled in system fault trees so that the link to event tree branches is not obvious. In this study, the operator actions were given, so that the construction of the block diagrams did not serve as defining the operator action basic events. 3.2 Quantitative analysis The human error probability is derived using the timedependent human error probability model as follows,
Performance shaping factors
The empirical identification of PSFs was based on a detailed analysis of simulator performances. Analysts viewed the video und transcribed key communications and events, and used also additional data sources, such as crew interview, crew PSF questionnaire, and observer comments. Finally, the analyst summarized the observed episode in the form of an operational story, highlighting performance characteristics, drivers, and key problems. A specific method was used to rate the PSFs (Lois et al 2007).
� p(t) = min 1, p0 (t)
5 �
� Ki ,
(1)
i=1
where p0 (t) is the basic human error probability taken from Swain & Guttmann 1983, see Figure 2, t is the time available for identification and decision making, and K1 , . . . , K5 are the performance shaping factors. The min-function ensures that the final probability stays within the range 0 to 1.
228
5 min
8-10 min to go through E -0 and enter E -3
5 min for step 3 of E-3
Steam generator tube rupture (SGTR )
Manual scram
Feedwater to SGs (auto-function) P=0
Safety injection to primary circuit (auto-function)
Identification and isolation of the ruptured SG
Valves closed in all outlet and inlet paths of the ruptured SG
P=0
Sequence continues
P=0
Automatic scram (on low pressurizer pressure ) P=0 Anticipated transient without scram
SG dry -out , major SG rupture
Loss of core cooling
Unisolated SGTR , contamination of the secondary side , loss of primary coolant
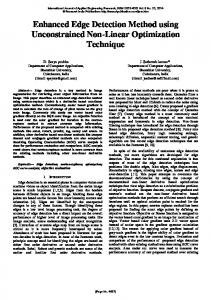
Figure 1. Block diagram of the beginning of the SGTR basic scenario. Light grey boxes are operator actions, white boxes process events, and dark gray boxes end states of the event sequences. E-0 and E-3 are emergency operating procedures. Possibility of technical failures is not considered in this analysis (P = 0).
1E+0
1E-1
Probability of failure
1E-2 Swain 95%
1E-3
Swain Median Swain 5%
1E-4
Base probability
1E-5
1E-6
1E-7 1
10
100
1000
10000
Time for identification and decision making t [min]
Figure 2.
Time-dependent human error probability curve.
The time available for identification and decision making is shorter than the total time available for the operator action ttot which is assumed to be composed of three parts as follows
where tind is time for first indication, t time for identification and decision making and tact time for action. The following performance shaping factors are used (Pyy & Himanen 1996):
ttot = tind + t + tact ,
K1 : K2 :
(2)
229
Quality and relevance of procedures Quality and relevance of training
K3 : K4 : K5 :
4
Quality and relevance of feedback from process (MMI) Mental load in the situation Need for coordination and communication.
4.1 Human error probabilities
Each performance shaping factor can receive a value 1/5, 1/2, 1, 2 or 5. A level above 1 means that the action has a complicating character compared to a ‘‘nominal’’ situation. Consequently, a level below 1 means that the action is easier than the nominal case. Level ‘‘1’’ means that the factor plays no major role or that this factor is in a nominal level. The meaning of each value for each PSF is explained qualitatively in the method. For instance, regarding ‘‘Quality and relevance of procedures,’’ K1 = 1/5 is interpreted as ‘‘Very good instructions, operators should not make any mistake,’’ K1 = 1/2 as ‘‘Good instructions, applicable for the situation and they support well the selection of correct actions,’’ K1 = 1 as ‘‘Instructions play no major role in the situation,’’ K1 = 2 as ‘‘Instructions are important but they are imperfect,’’ and K1 = 5 as ‘‘No instructions or misleading instructions, instructions would be needed.’’ Explanations for the other PSFs are analogous. The performance shaping factors will be given independently by a number of experts, and these judgments are consolidated with a Bayesian approach. In this approach, the performance shaping factors are assumed to be random variables following a multinomial probability distribution, P(Ki = j|qj ) = qj , q1/5 + · · · + q5 = 1.
j = 1/5, 1/2, 1, 2, 5,
PREDICTIONS ACHIEVED BY USING THE METHOD
(3)
The prior distribution for the parameters of the multinomial distribution is assumed to be a Dirichlet distribution. The convenient feature of Dirichlet distribution is that if we assume the expert judgments as independent observations from a multinomial distribution, the posterior distribution is also Dirichlet and can be easily derived. The prior distribution is chosen by maximizing the entropy function. This distribution has an interpretation to represent maximal uncertainty. The mathematical procedure is presented in Holmberg & Pyy 2000. Four experts have participated in this exercise, and made their assessments independently of each other based on material obtained from Halden and processed by VTT (see e.g. the block diagrams and definitions for the operator actions). It should be observed that experts normally include also members from the operation crews at the actual plant, which was not possible during this experiment.
Table 1 summarizes numerical results from the HRA made using the Enhanced Bayesian THERP method. Time available for identification and decision making was taken from the information package submitted by Halden. The prior human error probability is derived from the Swain’s curve, see Figure 2. Four experts assessed independently the performance shaping factors and the assessments were aggregated using the Bayesian procedure. Mean values (i.e., posterior mean values) are shown in Table 1. According to this analysis failure probability is in the base case 0,03 and in the complex case much higher 0,2. In the simulator experiments, 1 out of 14 crews failed to isolate the SG within the critical time window in the base case, and in the complex case 7 out of 14 crews failed. Numerically, the predictions and the outcome are well in balance. 4.2 Performance shaping factors The values of the performance shaping factors can be interpreted so that in the base scenario the crew should get good support from procedures, training and process feedback to identify the situation and to make correct decision in time. Mental load is somewhat higher than in a normal case, and there is also some coordination and communication needs related to the action. The experts commented in free text that ‘‘good instructions, often training, clear indications, radiation alarm gives a clear indication of SGTR, scram and shortage of time are likely to increase mental load.’’ These judgments were in accordance with empirical PSF ratings except maybe the procedural guidance where some difficulties were found empirically. In the complex scenario, procedures are rated to provide good support, but the situation is now considered unfamiliar from the training point of view, and feedback from process is considered poor or misleading. Mental stress is considered higher than in the base case. The experts commented in free text that ‘‘good instructions, often training, clear indications, radiation alarm gives a clear indication of SGTR, scram and shortage of time are likely to increase mental load.’’ good instructions, situation is unfamiliar, less trained, normal feedback missing, and mental load is high for various reasons.’’ Empirically, it was judged that the procedures do not provide good support. Otherwise predictions and observations were in line. The difference in the PSF judgments can be seen as an expert opinion issue, and not as an HRA method issue.
230
Table 1.
Predictions for operator failure to isolate the ruptured steam generator in time.
Time available for identification and decision making Prior human error probability Performance shaping factors, mean values of the expert judgments2 Quality and relevance of procedures, scale 0.2–5 Quality and relevance of training, scale 0.2–5 Quality and relevance of feedback from process, scale 0.5–5 Mental load in the situation, scale 1–5 Need for coordination and communication, scale 0.5–5 Posterior human error probability Uncertainty distribution (posterior) 5% 50% 95%
Base
Complex
12 min1 7.3E-2
15 min1 0.049
0.6 0.5 0.4 1.8 1.4 2.6E-2
0.7 1.4 2.4 2.7 1.2 1.7E-1
5.8E-4 7.3E-3 9.1E-2
9.9E-4 4.0E-2 1.0E + 03
1
Difference in time window between the base case and complex case is that, in the complex case, the plant trip is actuated immediately in the beginning of the scenario, while in the base scenario an alarm is received first and the first indication of increasing level in the ruptured SG is received 3 min after the alarm. 2 Interpretation of the scale: 0.2 = very good condition, 0.5 = good condition, 1 = normal, 2 = poor condition, 5 = very poor condition. Note that full scale is not used for all PSFs. 3 Due to the min-function in the human error probability model, see formula (1).
5 5.1
results from this pilot study did not clarify the actual need for calibration.
EVALUATION FINDINGS Strengths
The enhanced Bayesian THERP method seems to be a cost-effective approach for these type of standard ‘‘PSA operator actions’’ when the aim is to model and quantify operator actions for a PSA model. As mentioned above, the predictions of the method are well in line with the outcomes of the simulator experiments. This is true for the quantification as well as for most of the PSFs. 5.2
Potential weaknesses
Assessment of the time window is critical in this method. It seems, however, that the time reliability curve is quite reasonable at least for operator actions with a time window between 5–30 min. It should be noted that the time window in this case can be defined quite accurately since the operator action is the first one of the event sequence. There is much more variability in time windows for the subsequent actions, which is a challenge for this type of HRA models. Another critical point in the method is the interpretation of the performance shaping factors and their numerical rating. It is obvious that different experts will always interpret differently the explanations given for the scaling. As long as an expert is consistent in his/her judgments, values given for different operator actions can be compared. From the absolute level point of view, some calibration may be needed. So far,
5.3
Possible improvement areas
A significant empirical observation was the variability between crews with regard to affecting performance shaping factors which means that PSFs are not only action dependent but also crew dependent. This variability is not explicitly accounted in the enhanced Bayesian THERP method, even though the method produces a probability distribution for each PSF. These probability distributions, however, reflect variability of expert judgements not the variability of crews. Method development may be needed to account the variability of the crews. Experts should be urged to justify the rates. This is an essential way to collect insights, e.g., for improvements of the human factors. Another finding was that the method could be complemented with a discussion phase after the expert judgements where experts could jointly comment the results and draw conclusions from the assessments. This would facilitate the interpretation of the results which is now based on pure interpretation of the numbers.
6
CONCLUSIONS
The experiment shows that the Enhanced Bayesian THERP method gives results in close match with
231
simulator data, at least within the experimental limitations. Concerning the quantitative results, no significant deviations were identified. For negative PSFs, there was a difference in common for both scenarios. While the Enhanced Bayesian THERP method predicted mental load/stress and deficient feedback as important factors, the simulation focused more on procedural feedback and task complexity. The reasons behind this might be method related, but could also depend on limitations in expert selection and/or differences in stress level between real operation and simulator runs. The comparison of empirical observations with predictions was found as a useful exercise to identify areas of improvements in the HRA method. An aspect not covered by the method is the variability between the crews with regard to importance of different PSFs. Also explanations for numerical scales for PSFs could be improved to harmonize the way experts interpret the scales. In this way, empirical tests are necessary to validate an HRA method. Otherwise the evaluation gives confidence that the time reliability curve is a feasible and cost effective method to estimate human error probabilities, at least when the time window is well defined and relatively short.
REFERENCES Lois, E. et al 2007. International HRA Empirical Study— Description of Overall Approach and First Pilot Results from Comparing HRA Methods to Simulator Data. Report HWR-844, OECD Halden Reactor Project, draft, limited distribution. Dang, V.N. et al 2008. Benchmarking HRA Methods Against Simulator Data—Design and Organization of the Halden Empirical Study. In: Proc. of the 9th International Conference on Probabilistic Safety Assessment and Management (PSAM 9), Hong Kong, China. Swain, A.D. & Guttmann H.E. 1983. Handbook of Human Reliability Analysis with Emphasis on Nuclear Power Plant Applications. NUREG/CR-1278, Sandia National Laboratories, Albuquerque, USA, 554 p. Pyy, P. & Himanen R. 1996. A Praxis Oriented Approach for Plant Specific Human Reliability Analysis—Finnish Experience from Olkiluoto NPP. In: Cacciabue, P.C., and Papazoglou, I.A. (eds.), Proc. of the Probabilistic Safety Assessment and Management ’96 ESREL’96—PSAMIII Conference, Crete. Springer Verlag, London, pp. 882–887. Holmberg, J. & Pyy, P. 2000. An expert judgement based method for human reliability analysis of Forsmark 1 and 2 probabilistic safety assessment. In: Kondo, S. & Furuta, K. (eds.), Proc. of the 5th International Conference on Probabilistic Safety Assessment and Management (PSAM 5), Osaka, JP. Vol. 2/4. Universal Academy Press, Tokyo, pp. 797–802.
232