An Evolving Approach to Unsupervised and Real-Time Fault Detection in Industrial Processes Clauber Gomes Bezerraa,∗, Bruno Sielly Jales Costab , Luiz Affonso Guedesc , Plamen Parvanov Angelovd,e a
[email protected] Federal Institute of Rio Grande do Norte - IFRN, Campus EaD Av. Senador Salgado Filho 1559, Tirol, CEP: 59015-000, Natal, RN, Brazil b
[email protected] IFRN - Campus Natal Zona Norte Rua Brusque 2926, Potengi, CEP 59112-490, Natal, RN, Brazil c
[email protected] Federal University of Rio Grande do Norte - UFRN, Department of Computer Engineering and Automation - DCA Campus Universitrio, Lagoa Nova, CEP: 59078-900, Natal, RN, Brazil d
[email protected] Lancaster University, Data Science Group, School of Computing and Communications, Lancaster LA1 4WA, United Kingdom e Chair of Excellence, Carlos III University, Madrid, Spain
Abstract Fault detection in industrial processes is a field of application that has gaining considerable attention in the past few years, resulting in a large variety of techniques and methodologies designed to solve that problem. However, many of the approaches presented in literature require relevant amounts of prior knowledge about the process, such as mathematical models, data distribution and pre-defined parameters. In this paper, we propose the application of TEDA Typicality and Eccentricity Data Analytics - , a fully autonomous algorithm, to the problem of fault detection in industrial processes. In order to perform fault detection, TEDA analyzes the density of each read data sample, which is calculated based on the distance between that sample and all the others read so far. TEDA is an online algorithm that learns autonomously and does not require any previous knowledge about the process nor any user-defined param∗ Corresponding
author Email address:
[email protected] (Clauber Gomes Bezerra)
Preprint submitted to Journal of LATEX Templates
June 15, 2016
eters. Moreover, it requires minimum computational effort, enabling its use for real-time applications. The efficiency of the proposed approach is demonstrated with two different real world industrial plant data streams that provide “normal” and “faulty” data. The results shown in this paper are very encouraging when compared with traditional fault detection approaches. Keywords: fault detection, industrial processes, typicality, eccentricity, TEDA, autonomous learning.
1. Introduction Nowadays, industries from a variety of production sectors increasingly seek to meet the market requirements, such as production increase, continuity and reliability of the processes, in addition to safety and environmental restrictions. 5
In order to cope with these challenges, industries have been investing more and more in automation of the production processes, increasing the general complexity of the systems. Thus, process maintaining becomes a complex task due to the large number of equipment and variables that need to be monitored. Therefore, there is a growing demand for robust and reliable industrial con-
10
trol and monitoring systems. The industrial process should be able to perform a specified function, under determined conditions, in a given period of time, while remaining safe for people, equipment and the environment (Isermann, 2006). Moreover, these systems should be efficient in the sense of being able to handle large amounts of variables and data provided by the equipment of the plant.
15
One of the approaches for tackling both problems is to increase quality, safety and robustness of the sensors, actuators and controllers, in addition to the structure of the plant itself. However, over time, the industrial equipment are likely to show a number of signs of degradation, such as exhaustion, dirt, corrosion, cracks, damage caused by operators, among others. The appearance
20
of such signs turns the plant susceptible to fault occurrences during its operation. A fault consists of an unpermitted deviation of at least one characteristic property or variable in a system from its acceptable, usual or standard condi-
8
tion (Isermann, 1997). In an industrial process, a fault can be defined as an unexpected change on the functioning of one or more process components that 25
can lead it to a critical situation. Sometimes, a fault may cause a number of problems, such as unexpected stoppages, production losses, reduction of equipment lifespan, or even accidents with severe consequences to the environment and human life (Venkatasubramanian, 2003). Very often, a fault-free process is not feasible. Thus, the use of a fault
30
detection and diagnosis (FDD) system becomes crucial (Ding, 2008). FDD systems usually are responsible for the increase of process availability, reliability and safety, in addition to cost reduction and more efficient maintaining. A FDD system is often integrated to the traditional supervision and control systems, as shown in Figure 1.
Figure 1: FDD system scheme.
35
The FDD systems work by monitoring process variables and analyzing their behaviors. Therefore, they should be able to determine the occurrence of a fault - fault detection - , its location and cause - fault diagnosis - , by analyzing process inputs/outputs and sending information regarding the fault to the supervisory system. Therewith, the operator is able to decide how and when to act in order
40
to avoid a critical state of the process. With this strategy, it is possible to avoid unnecessary stoppages and accidents. High demands for monitoring and fault detection in industrial systems resulted in research and development of many FDD techniques in the last few decades using different data analytics methods. These methods are often clas-
45
sified as model-based and process history-based (Venkatasubramanian et al., 9
2003; Katipamula and Brambley, 2005). Model-based methods use the concept of residual analysis. In this type of approach, the residual error, which consist of the difference between a value measured on the output and a value estimated from a previously defined quan50
titative or qualitative model, is calculated and considerable difference between the estimated and measured values might indicate the presence of a fault. On the other hand, process history-based methods do not required predefined models of the system. These methods, also known as data-driven, analyze the temporal evolution of data from the system in order to detect anomalies
55
in its behavior. Many different approaches have been used to tackle FDD problems, including fuzzy systems (Mendon¸ca et al., 2009; Oblak et al., 2007; Yang et al., 2011), state observers (Zhou et al., 2014; Sobhani and Poshtan, 2011; Li and Yang, 2012; Chen and Saif, 2007), neural networks (Yuan et al., 2015; Mrugalski and
60
Korbicz, 2007; Zhou et al., 2011; Leite et al., 2009), principal component analysis (Cui et al., 2008), support vector machines (Zeng et al., 2013), parity equations (Zakharov et al., 2013), analytical redundancy (Halder and Sarkar, 2007; Anwar and Chen, 2007; Xu and Tseng, 2007; Serdio et al., 2014b,a) and immune system-based methods (Laurentys et al., 2010a,b). One of the main dis-
65
advantages of most of these approaches is that they require a pre-defined model (quantitative or qualitative) of the system, mathematically defined or estimated by offline training. However, most of the mentioned approaches are limited in the sense that they require some kind of previous knowledge about the characteristics of the process.
70
Therefore, the availability of mathematical, physical or behavioral models or the non-intuitive definition of parameters and thresholds are required. Moreover, large databases and extensive training are often mandatory. Recently, methods for outlier detection have been applied to different problems, including fault detection in industrial problems (Hodge and Austin, 2004;
75
Chandola et al., 2007; Singh and Upadhyaya, 2012). An outlier consists of an element from a data set that is significantly distinct from the other elements. 10
Considering a signal obtained from an industrial plant, an outlier might indicate an anomaly or fault in the process. Generally, the data in an industrial process is obtained continuously, in real 80
time and, thus, outlier detection methods must be able to handle the data in the form of data streams. Therefore, each sample analyzed has a temporal aspect and is only available at the instant of the acquisition. In this context, an outlier is detected from the observation of a sequence of data samples analyzed over time.
85
Accordingly, other important aspects should be considering when choosing an outlier detection method, such as computational effort when handling high dimensional streaming data. Hence, information about past data samples must be stored and analyzed without compromising memory and execution time. Many authors address such problem with time series analysis (Hu and Dong,
90
2015) and outlier detection methods, thoroughly discussed in Chandola et al. (2007) and Hodge and Austin (2004), which include Statistical Modeling (Ma et al., 2013; Yan et al., 2016), Neural Networks (King et al., 2002; Li et al., 2002), Spectral Decomposition (Fujimaki et al., 2005) and Rule-based Systems (Ramezani and Memariani, 2011).
95
In this work, we deal solely with the fault detection stage, omitting, then, the diagnosis stage. This is an application of the anomaly detection field of study, consisting of a “one-class” classification problem, by deciding whether a data sample belongs to the “normal” class or not (fault). In order to solve this problem, we will make use of a recently proposed ap-
100
proach to anomaly detection within a data stream. Typicality and Eccentricity Data Analytics (TEDA) is based on the spatial proximity among the data samples and has been successfully applied to anomaly detection (Bezerra et al., 2015), clustering, classification, regression, among other problems (Kangin and Angelov, 2015).
105
This paper presents a practical application of TEDA algorithm to two different real world industrial fault detection problems. The first application uses the well known DAMADICS fault detection benchmark, that provides real data 11
(not simulated) from the operation of a sugar factory plant. The second application consists of a laboratory pilot plant for process control, equipped with 110
real industrial instruments. The remainder of this paper is organized as follows. Section 2 presents the theoretical concepts of the fault detection method used in this work. Section 3 details both data sets used for validation of the proposed approach. Section 4 presents the obtained results. Finally, Section 5 presents final remarks, open
115
problems and future work.
2. TEDA The approach used in this paper for fault detection is based on TEDA algorithm. TEDA was introduced by Angelov (2014) and builds upon the RDE (Recursive Density Estimation) algorithm family. Since then, TEDA was ap120
plied to different detection and classification problems (Kangin and Angelov, 2015; Costa et al., 2015b). The word “typicality” is related to the similarity of a particular data sample to an entire data set in the sense of spatial proximity on a n-dimensional feature space. On the other hand, “eccentricity” reflects how distinct is a data sample from the data group. A data sample with high
125
eccentricity and, thus, low typicality, is very likely to be an outlier. TEDA approach presents many advantages over the traditional statistical methods for anomaly detection. The first one that should be mentioned is that TEDA does not require any a priori knowledge about the analyzed data set. Therefore, previously known mathematical models or user-defined parameters
130
are not necessary. Moreover, TEDA does not rely on assumptions about data distribution or independence of data, which very often do not hold in real world applications. Another major advantage is that TEDA is a recursive algorithm, enabling large amounts (theoretically infinite) of data in the form of data streams to be
135
processed with very low computational effort, very fast, online and in real-time, allowing its application to fault detection in industrial processes.
12
To exemplify the ideas of typicality and eccentricity, consider the data sets illustrated in Figure 2. It is easy to understand that the point P1 in Figure 2(a), regarding spatial proximity to all the other points in the data set, is very “typ140
ical”, while the point P2 in Figure 2(b) is more “eccentric”. In other words, the sum of distances from P to all the other data points, or how close the point P is to the data set, determines the degree of membership from P to the group.
(a)
(b)
Figure 2: membership of a sample P to a data set.
In order to formulate this idea, consider a data space X ∈ ℜn , consisting of a set of observations in the n-dimensional feature space, as an ordered sequence {x1 , x2 , . . . , xk , . . .}, xi ∈ Rn , i ∈ N, where k represents the discrete time instant of the observation. Consider d(xi , xj ) the distance between the samples xi and xj , where Euclidean, Mahalanobis, cosine or any other formulations can be used. For the entire data set, which is in the form of a data stream, we define π k (x) =
k X
d(x, xi )
(1)
i=1
as the sum distance a particular observation x ∈ X, for each element up to the k-th one. The eccentricity ξ of the data sample x at the time instant k can be defined as (Angelov, 2014) Pk 2π k (x) i=1 d(x, xi ) ξ k (x) = Pk , = 2 Pk P k k j=1 d(xi , xj ) i=1 π (xi ) i=1 k ≥ 2,
k X i=1
13
π k (x) > 0
(2)
The typicality τ of the data sample x at the time instant k is defined as a complement to the eccentricity as (Angelov, 2014) τ (xk ) = 1 − ξ k (x)
(3)
The eccentricity and typicality are both bounded (Angelov, 2014): 0 ≤ ξ k (x) ≤ 1,
k X
0 ≤ τ k (x) ≤ 1,
k X
ξ k (xi ) = 2,
i=1
τ k (xi ) = k − 2,
i=1
k ≥ 2, k X
π k (xi ) > 0
i=1
Eccentricity ξ can be calculated recursively. It can be shown, that equation 2 can be derived as (Angelov, 2014) ξ k (x) =
(k − 1)µk−1 xk 1 (µkx − x)T (µkx − x) k x µx = + + , 2 k k k[σx ] k k
k ≥ 1,
µ0x = 0 (4)
µkxT x =
(k − 1)µk−1 xT xk xT x + k , k k
k ≥ 1,
µ0xT x = 0 (5)
[σxk ]2 = µkxT x − [µkx ]T µx 145
(6)
where the mean µkx and the variance k[σxk ]2 are recursively updated. In a similar manner, typicality can be calculated as (Angelov, 2014) τ k (x) = 1 − ξ k (x) =
k − 1 (µkx − x)T (µkx − x) − k k[σxk ]2
(7)
Finally, the normalized eccentricity can be calculated by (Angelov, 2014) ζ k (x) =
(µk − x)T (µkx − x) 1 + x 2k 2k[σxk ]2
(8)
The recursive nature of TEDA provides an efficient algorithm with very low computational cost, processor- and memory-wise. It does not require storing 14
previous data observations in memory and only the mean and variation are needed for the calculation of ξk . Although the data samples are not stored, 150
there is no data loss regarding eccentricity and typicality. Thus, TEDA is very suitable for a wide range or real-time problems, including those with limited computational resources and where fast response is necessary. TEDA is part of the fast growing set of methods known as autonomous learning systems (Angelov, 2012). The whole life-cycle of the algorithm is data-
155
driven and, therefore, user- or problem-defined parameters are not necessary. Fault detection problems, on the other hand, may be frequently seen as oneclass classifiers. Thus, the task of defining the boolean membership to a certain group of data (e.g. normal or faulty) requires the definition of a threshold which, very often, does not need to be static. A very well known principle for outlier detection is the use of the so called “mσ” thresholds (Bernieri et al., 1996). However, using mσ requires the prior strict assumption of a Gaussian distribution - one of the problems that TEDA tries to avoid. However, for any distribution, but, assuming a representatively large amount of independent data samples, it is possible to use the well known Chebyshev inequality (Saw et al., 1984), which states that no more than 1/m2 of the data observations are more than mσ away from the mean, where σ represents the standard deviation of the data. The authors in (Bernieri et al., 1996) show that the condition that provides exactly the same result (but without making any assumptions on the amount of data, their independence and so on) as the Chebyshev inequality can be given as: ζk >
160
m2 + 1 , 2k
m>0
(9)
3. Experimental Setup In order to validate the technique for fault detection problems, data from two real-world (not simulated) industrial plants were used. Therewith, the proposed approach needs to handle all characteristics that are intrinsic to real processes,
15
such as inertia, environmental noise, uncertainties, unpredictable disturbances 165
and so on. The following subsections present both experimental setups. 3.1. DAMADICS Benchmark The first data set used was obtained from the well known DAMADICS (Development and Application of Methods for Actuator Diagnosis in Industrial Control Systems) benchmark (Bartys et al., 2006; DAMADICS), which has
170
been largely used for fault detection and diagnosis and, thus, many different proposals and experimental results are available in literature. DAMADICS benchmark provide an extensive set of real data collected from a water evaporation process in a Polish sugar factory. This process consists of three actuators, where each one of them is used for flow control of a specific
175
part of the process. DAMADICS is based on the actuator presented in Figure 3, which consists of the following components: • Control valve: controls water flow in the pipes. • Pneumatic servomotor: consists of a rod connected to the control valve, allowing opening variations.
180
• Positioner: used for internally handle incorrect rod positioning caused by friction, pressure variations and so on. DAMADICS provides a software toolbox for MATLAB/SIMULINK that allows simulation and real-time monitoring of 19 different types of fault. However, we chose to use only the real (not simulated) data set provided. The data is
185
organized in several files, where each file refers to a full working day of the plant. Each file contains data from 32 different variables/signals, with a sampling rate of 1 sample/second. Thereby, each file provides a total of 86,400 x 32 observations. The data set contains observations of 25 full working days of the plant,
190
however, only 4 of them present faulty behaviors, introduced in different periods of the day, therefore, only such files were used. There are 4 different types 16
(a)
(b)
Figure 3: model of the actuator used in DAMADICS. (Adapted from DAMADICS)
of faults, corresponding to the fault codes f16 , f17 , f18 e f19 defined by the benchmark, as described in Table 1. Table 1: fault codes and descriptions of DAMADICS.
Fault code
Description
f16
Positioner supply pressure drop
f17
Unexpected pressure drop across the valve
f18
Partly opened bypass valve
f19
Flow rate sensor fault
A total of 19 fault items were added to the plant in each of its three actua195
tors. Since these faults are from different types and occur in different actuators, different subsets of signals/variables were used to analyze each of the fault items. The selection of the features to be analyzed is based on the information presented in DAMADICS manual (DAMADICS). Table 2 presents the signals used for each of the analyzed fault items.
200
Figure 4 shows the variables x1 and x2 , respectively the signals FC57 03CV and FC57 03X of the process, representing the fault item #12, where the fault period is indicated by vertical red dotted lines. 17
Table 2: signals analyzed for fault detection.
Item
Actuator
Fault type
Monitored variables
#1
f18
LC51 03CV
LC51 03PV
#2
f16
LC51 03CV
LC51 03PV
#3
f18
LC51 03CV
LC51 03PV
f18
LC51 03CV
LC51 03PV
#5
f18
LC51 03CV
LC51 03PV
#6
f16
LC51 03CV
LC51 03PV
#7
f17
LC51 06
T51 01
#8
f17
P57 03
P57 04
#9
f17
P57 03
P57 04
f19
FC57 03CV
FC57 03X
f19
FC57 03CV
FC57 03X
#12
f19
FC57 03CV
FC57 03X
#13
f17
#14
f18
LC74 20CV
LC74 20X
#15
f16
LC74 20CV
LC74 20X
f16
LC74 20CV
LC74 20X
f16
LC74 20CV
LC74 20X
#18
f16
F74 00
LC74 20X
#19
f19
F74 00
LC74 20X
#4
#10 #11
#16 #17
1
2
3
P57 03
3.2. Pilot Plant The second data set used in this work was obtained from a laboratory pilot 205
plant (do Brasil) and used in different fault detection and diagnosis applications (Costa et al., 2014, 2015a; Precup et al., 2015). The plant, which is shown in Figure 5, consists of two tanks, connected by a piping system, allowing liquid flow between them. Moreover, the plant provides data from several sensors, such as level, flow, pressure, and temperature. The flow between the two tanks
210
is controlled by two pneumatic control valves and a centrifugal pump. The plant
18
x1 x2
80
60
40 5.7
5.7
5.7
5.71
5.71
T ime(s)
5.71 ·104
Figure 4: behavior of the fault item #12.
is controlled by a Programmable Logical Controller (PLC) and all sensors and actuators are real-size devices and often used in real industrial environments.
Figure 5: Laboratory pilot plant.
Figure 6 illustrates the working scheme of the pilot plant. The liquid from the tank T1 is transferred to the tank T2 by gravity, passing through valve 215
V1 . The liquid is transferred from T2 to T1 by pressure generated in pump C1 , passing through valve V2 . The flow can be controlled by valve opening and/or pressure from the pump. 19
Figure 6: Scheme of the pilot plant.
Using a level control application on the pilot plant, 23 different fault items were artificially generated. Some of the faults were physically generated (e.g. 220
tank leakages) while others were inserted by software (e.g. actuator offsets). Table 3 describes the whole set of generated faults. The generated fault items are divided in three main groups, described as follows: • Actuator and Sensor: faults generated by software, by applying fixed offset values to the centrifugal pump.
225
• Structural: faults in the structure of the plant, that might be generated physically or by software. They represent physical problems in the equipment of the plant, such as valves and tanks. • Disturbance: consist of unexpected changes in the output of the plant. Generated by the manual addition of different amounts of water to tank
230
T1 during plant operation. In each data stream, data were collected from normal, faulty and, again, normal operation of the plant. The sampling period used in this experiment 20
Table 3: fault items generated on the pilot plant.
Fault item
Group
Description
#1
+2% actuator offset
#2
+4% actuator offset
#3
+8% actuator offset
#4
-2% actuator offset
#5
-4% actuator offset
#6 #7
Actuator and Sensor
-8% actuator offset +2% sensor offset
#8
+4% sensor offset
#9
+8% sensor offset
#10
-2% sensor offset
#11
-4% sensor offset
#12
-8% sensor offset
#13
66% tank leakage
#14
100% tank leakage
#15
30% stuck valve V1
#16
50% stuck valve V1
#17
Structural
85% stuck valve V1
#18
100% stuck valve V1
#19
25% stuck valve V2
#20
50% stuck valve V2
#21
75% stuck valve V2
#22 #23
Disturbance
Low disturbance High disturbance
is 100ms and the dataset consists of several files, one for each stream/fault occurrence, following the format described in Table 4. 235
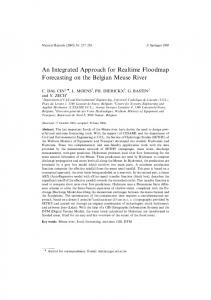
As an example of data stream, Figure 7 presents a chart for fault item #02, as available in the mentioned data set. The variables setpoint (r), process
21
Table 4: monitored variables in each data stream.
Variable
Description
k
discrete time
setpoint (r)
reference signal
control signal (u)
pressure applied to B1
process variable (y)
level on T1
variable (y) and control signal (u) are visible in the chart. Fault occurrences are bounded by vertical dashed lines. As one may notice, the plant is started in a normal state of operation and, after approximately t = 20s, fault #02 is 240
initiated, being easily noticed by the high oscillation of the control signal (and minor oscillation on the plant output). The normal state of operation is, again, achieved around t = 110 and this format is repeated for the other fault items. 50 40 30 (r) (y)
20
(u) 0
50
100
150
T ime(s)
Figure 7: behavior of fault #22 over time.
4. Results The results of this work were obtained by applying TEDA to each of the fault 245
items described in Section 3. There is a total of 19 fault items for DAMADICS benchmark and 23 fault items for the pilot plant experiment. In each of these fault streams we define an interval of occurrence and an interval of analysis of the fault. Figure 8 illustrates the definition of both intervals. 22
(a)
(b)
Figure 8: Interval of occurrence and interval of analysis of a generic fault.
Interval of occurrence of a fault is the time frame in which all collected data 250
observations belong to a faulty state, while interval of analysis is the time frame used to obtain hit/miss rates, to be described further in this section, containing both normal and faulty data samples. As one may notice in Figure 8, the interval of analysis of the fault is started with a sequence of normal samples, followed by a sequence of faulty samples and finalized, again, with a sequence of normal
255
samples, as illustrated in Figure 8(a). However, for some exceptional cases, the process does not return to its original state after the occurrence of the fault, as shown in Figure 8(b). Concerning to the interval of the fault occurrence, for DAMADICS, this interval was defined according to the description manual of the benchmark (DAMADICS).
260
For the pilot plant, the interval of occurrence was experimentally defined (Costa et al., 2014). In relation to the analysis interval, it was defined as the whole data stream, from the first to the last collected sample. It should be stressed that the interval of occurrence and interval of analysis are used solely for obtaining hit/miss rates, by comparing, for each read data
265
sample, the output from the detection system to the actual state of the plant. These intervals are not used for calculation/analysis/decision making of any kind. Moreover, it is important to remember that in a real application, where the data is collected online, the location of the fault is unknown. Therefore, it is
270
not possible to accurately obtain the interval of fault occurrence. However, to measure the efficiency of the method, it is necessary to know the exact beginning 23
and end of each fault. If these limits were unknown, the hit/miss rate method would be infeasible. The metrics used for performance analysis are based on the hit/miss count, 275
both for faulty and normal data observations. They are described as follows. True positive rate (TPR) determines the percentage of faulty data samples correctly detected and is defined as
TPR =
nf 100 Nf
(10)
where nf is the number of correctly detected faulty samples and Nf is the total of faulty samples within the interval of analysis. 280
False positive rate (FPR) determines the percentage of normal data samples incorrectly detected as faulty samples, being defined as
FPR =
nn 100 Nn
(11)
where nn is the number of normal samples incorrectly detected as faulty samples and Nn is the total of normal samples within the interval of analysis. Finally, total hit rate (THR) determines the percentage of correctly classified 285
data samples, both in normal and faulty states and is defined as
T HR =
nt 100 Nt
(12)
where nt is the number of correctly classified samples and Nt is the total of data samples within the interval of analysis. Therefore, for each of the analyzed fault streams, we calculate TPR, FPR and THR. The results obtained for each specific experiment are shown as follows. 290
4.1. Obtained Result Using the DAMADICS Benchmark The detailed results obtained from the experiments using DAMADICS benchmark are presented in Table 5. The average value obtained from THR, considering all the 19 fault streams is 98.38% . This result presents the TEDA efficiency in the correct detection of the condition for each sample analyzed. 24
295
Furthermore, another very important result is that the average number of false positives obtained was very low, FPR = 1.26%. In relation to the samples in a fault condition correctly detected, the result was also quite relevant. The TPR average value obtained was 74.96%. Still, the value was limited once TEDA failed to detect two of the analyzed fault items (fault items #4 and #13). Table 5: results obtained with DAMADICS benchmark.
Item
TPR
FPR
THR
#1
92.01%
6.49%
93.49%
#2
83.33%
1.20%
98.75%
#3
36.63%
1.42%
98.50%
0.00%
1.47%
98.41%
#5
72.28%
2.67%
97.30%
#6
73.27%
2.67%
97.30%
#7
100%
0.54%
99.46%
#8
93.33%
0.29%
99.71%
#9
91.30%
0.28%
99.71%
91.67%
0.17%
99.83%
89.74%
0.17%
99.83%
#12
93.02%
0.16%
99.83%
#13
0.09%
0.22%
93.32%
#14
80.76%
1.52%
98.36%
#15
68.63%
0.65%
99.33%
#16
83.52%
0.60%
99.38%
83.93%
1.09%
98.91%
#18
93.65%
1.15%
98.84%
#19
97.16%
1.09%
98.91%
74.96%
1.26%
98.38%
#4
#10 #11
#17
Actuator
Actuator 1
Actuator 2
Actuator 3
Mean
300
It is easy to observe that the experiments resulted in high THR for all analyzed items. For example, for the fault stream #7, the total hit rate obtained
25
is THR = 99.46%, where all faulty data samples were correctly classified (TPR = 100%), with very low false positive rate (FPR = 0.54%). Similar results may be observed for different fault items. Figure 9, for example, presents the 305
visual outcome of TEDA algorithm for the fault stream #1. The m = 3, or equivalently (5/k), threshold was used in these experiments. 60
x1 x2
50
40
30
5.85
5.9
5.95
6
T ime(s)
6.05 ·104
(a) ·10−3 ζ 1.5
5/k
1 0.5 0 5.85
5.9
5.95 T ime(s)
6
6.05 ·104
(b) Figure 9: results obtained for fault item #1: (a) input vector x and (b) normalized eccentricity ζ with 5/k threshold.
Figure 9(a) illustrates the behavior of two input variables (x1 and x2 ) analyzed by TEDA, where the beginning and end of the fault are indicated by red dotted vertical lines. One may observe the occurrence of abrupt changes in 310
both signals x1 and x2 at the exact instants where the fault begins and ends. 26
These changes are immediately followed by the eccentricity signal, indicated in Figure 9(b), increasing its value (and surpassing the threshold) at the beginning and decreasing it after the end of the fault. Regarding false positives, the value of F P R < 1.00% was obtained for 9 315
fault items. Among them, one can highlight the fault #12 where, in addition to the lack of false positives (F P R = 0.16%), a T P R = 93.02% was obtained. Figure 10 presents the visual outcome of TEDA algorithm for fault item #12. x1 x2
80
60
40 5.7
5.7
5.7
5.71
5.71
T ime(s)
5.71 ·104
(a)
3
·10−3 ζ 5/k
2
1
0 5.7
5.7
5.7
5.71
T ime(s)
5.71
5.71 ·104
(b) Figure 10: results obtained for fault item #12: (a) input vector x and (b) normalized eccentricity ζ with 5/k threshold.
It should be highlighted that the eccentricity significantly increases if the values of one or more input variables change, specially in the case of abrupt 27
320
deviations. Similarly, Figure 11 presents the obtained results for fault item #2. 100
x1 x2
80 60 40
5.7
5.72
5.74
5.76
5.78
T ime(s)
5.8 ·104
(a) ·10−3 ζ 5/k
1
0.5
0 5.7
5.72
5.74
5.76
T ime(s)
5.78
5.8 ·104
(b) Figure 11: results obtained for fault item #2: (a) input vector x and (b) normalized eccentricity ζ with 5/k threshold.
DAMADICS benchmark introduces the definition of a set of indexes that should be calculated for fair comparison with other fault detection methods applied to the same benchmark. However, in our work, different metrics were used for result analysis. Therefore, direct comparison with other existing techniques 325
is not an easy nor fair task, since 1) different metrics were chosen for analysis of the results that focus mainly on the aspect of detection of outliers in the data streams provided by DAMADICS and 2) to the best of our knowledge, it is the first application of a fully autonomous, online and data-driven method to the
28
referred benchmark. 330
4.2. Results obtained using the pilot plant Table 6 presents the results obtained using the laboratory pilot plant, where the mean TPR = 83.30%, the mean FPR = 0.50% and the mean THR = 97.12% were achieved. When comparing these results with those obtained from DAMADICS benchmark, it is easy to observe that the obtained results in both
335
experiments were very similar. Note that the TEDA was applied in two different plants, under different types and severities of faults and, still, presented good results in both cases. Some features of TEDA deserve to be highlighted one more time. TEDA does not need any training or pre-defined model of the process. It operates autonomously
340
with the data set presented to the algorithm, using solely statistical information extracted from the data stream. In order to graphically represent the results obtained with TEDA for the pilot plant, Figure 12 presents the charts for fault #1. More specifically, in Figure 12(a) the input signals (x1 and x2 ) are presented. Note that x2 is very
345
oscillatory during the faulty state. This oscillation is due to the fact that the controller is trying to compensate the effect of the fault. Nevertheless, TEDA was able to detect most of the faulty samples, since that, for fault #1, we obtained a THR = 98.87% and a TPR = 93.82%, regardless of a FPR = 0.00%. In Figure 12(b) the behavior of the eccentricity ζ and the threshold 5/k is shown.
350
It should be noted that the value of ζ reflects the oscillations from the input signals. Figure 13 illustrates the behavior of TEDA when applied to fault #15. Again, the signal x2 , as shown in Figure 13(a) is very oscillatory during the fault, which is reflected in the eccentricity shown in Figure 13(b).
355
The results, again, were successful if we consider the values of TPR = 96.62%, FPR = 0.12% and THR = 97.41%. Is should be highlighted that, around k = 30, 200, there is a noticeable oscillation in x2 , resulting in a small
29
Table 6: results obtained with the laboratory pilot plant.
Item
TPR
FPR
THR
#1
93.82%
0.00%
98.87%
#2
93.36%
0.00%
98.05%
#3
73.60%
0.05%
97.69%
85.55%
0.01%
97.58%
#5
95.82%
0.01%
97.25%
#6
88.79%
0.02%
98.13%
#7
99.93%
0.15%
94.83%
#8
99.90%
0.22%
96.42%
#9
99.88%
0.28%
96.26%
99.87%
0.16%
96.82%
99.87%
0.18%
97.05%
#12
99.85%
2.67%
95.92%
#13
42.32%
0.24%
96.55%
#14
54.03%
0.04%
97.71%
#15
96.62%
0.12%
97.41%
#16
96.90%
2.57%
96.38%
30.81%
0.03%
96.09%
#18
42.13%
0.21%
97.50%
#19
93.62%
0.08%
97.33%
#20
94.40%
0.07%
97.40%
#21
88.43%
0.10%
97.52%
#22
51.64%
3.89%
97.33%
#23
94.15%
0.32%
97.60%
83.30%
0.50%
97.12%
#4
#10 #11
#17
Actuator
Actuator 1
Actuator 2
Actuator 3
Mean
set of false positive samples, which is promptly corrected further in the experiment.
30
30 x1 x2
20 10 0 0
20
40
60
80
100
T ime(s)
(a)
ζ 5/k
0.4
0.2
0 0
20
40
60
80
100
T ime(s)
(b) Figure 12: results obtained for fault stream #1: (a) input signals and (b) normalized eccentricity ζ with threshold = 5/k.
360
5. Conclusion This paper presented a new approach to fault detection in industrial processes. This approach is based on TEDA, a recently introduced algorithm for anomaly detection in data streams. In order to validate the proposal, TEDA algorithm was applied to two different real-world datasets, in the form of online
365
data streams, collected from two industrial plants. The obtained results have shown that TEDA was very efficient in both fault detection applications, presenting high hit and low miss rates. The results are even more significant if we consider that TEDA is fully autonomous, does not
31
x1 x2
60 40 20 0 0
50
100
150
200
T ime(s)
(a)
ζ 5/k
0.4
0.2
0 0
50
100
150
200
T ime(s)
(b) Figure 13: results obtained for fault stream #15: (a) input signals and (b) normalized eccentricity ζ with threshold = 5/k.
require any training stages nor previous knowledge about the system, it is able 370
to start from scratch, from the very first acquired data sample, and is free of user-defined parameters. The algorithm is also fast and require very low computational effort, being very suitable for real-time applications such as fault detection in industrial processes. It should be noted that the proposed approach might not be fully suitable
375
for incipient/gradual/smooth faults, that might not be easily distinguished from concept drift. Moreover, it might be sensible to natural signal oscillation, particularly if the “concept of normality” is not well established, i.e. the period
32
of normal behavior is not significantly long. Nevertheless, these disadvantages are easily overcome by the previously mentioned advantages, particularly in 380
applications where detailed information about the system, expertise from the operator or high computational power is not available. It is also worth mention that the classification of a data sample as “normal” or “fault” is based on the threshold (m2 + 1)/2k and, thus, on the parameter m. Although it can be defined from different criteria, m = 3 is largely used
385
in literature (Cook et al., 1997; Liukkonen and Tuominen, 2004) as a standard value and presents satisfactory results for different data sets and different configurations. The value of the threshold directly influences the sensibility of the detection system. Lower values of m will result in more sensibility to oscillation and vice versa. Obviously, m = 3 might not be an optimal value and future
390
work can be directed to autonomous adaptation of such parameter. As future work, TEDA algorithm will be used for both detection and classification (i.e. determination of location/cause/severity) of real-world industrial faults, working as central core of a new unsupervised classification algorithm.
References 395
Angelov, P., 2012. Autonomous Learning Systems: From Data Streams to Knowledge in Real-time.
Wiley.
URL: https://books.google.com.br/
books?id=Cj5A01JxuxIC. Angelov, P., 2014. Anomaly detection based on eccentricity analysis, in: Proc. IEEE Symposium Series in Computational Intelligence (SSCI 2014), Orlando, 400
Florida, U.S.A. Anwar, S., Chen, L., 2007. An analytical redundancy-based fault detection and isolation algorithm for a road-wheel control subsystem in a steer-by-wire system. Vehicular Technology, IEEE Transactions on 56, 2859–2869. Bartys, M., Patton, R., Syfert, M., de las Heras, S., Quevedo, J., 2006. Intro-
33
405
duction to the damadics actuator fdi benchmark study. Control Engineering Practice 14, 577–596. Bernieri, A., G., B., C., L., 1996. On-line fault detection and diagnosis obtained by implementing neural algorithms on a digital signal processor. IEEE Transactions on Instrumentation and Measurement 45, 894899.
410
Bezerra, C., Costa, B., Guedes, L.A., Angelov, P., 2015. A comparative study of autonomous learning outlier detection methods applied to fault detection, in: Proc. IEEE International Conference on Fuzzy Systems (FUZZ-IEEE 2015), Istanbul, Turkey. do Brasil, D.L., . De lorenzo do brasil web site. http://www.delorenzo.com.
415
br/. Accessed: 15 december 2015. Chandola, V., Banerjee, A., Kumar, V., 2007. Outlier detection: a survey. Technical Report. University of Minnesota. Chen, W., Saif, M., 2007. Observer-based strategies for actuator fault detection, isolation and estimation for certain class of uncertain nonlinear systems.
420
Control Theory Applications, IET 1, 1672–1680. Cook, G.E., Maxwell, J.E., Barnett, R.J., Strauss, A.M., 1997. Statistical process control application to weld process. IEEE Transactions on Industry Applications 33, 454–463. doi:10.1109/28.568010. Costa, B.S.J., Angelov, P., Guedes, L.A., 2014. Real-time fault detection using
425
recursive density estimation. Journal of Control, Automation and Electrical Systems 25, 428–437. doi:10.1007/s40313-014-0128-4. Costa, B.S.J., Angelov, P., Guedes, L.A., 2015a.
Fully unsupervised fault
detection and identification based on recursive density estimation and selfevolving cloud-based classifier. Neurocomputing 150, 289–303. doi:10.1016/ 430
j.neucom.2014.05.086.
34
Costa, B.S.J., Bezerra, C.G., Guedes, L.A., Angelov, P.P., 2015b.
On-
line fault detection based on typicality and eccentricity data analytics, in: 2015 International Joint Conference on Neural Networks (IJCNN), pp. 1–6. doi:10.1109/IJCNN.2015.7280712. 435
Cui, P., Li, J., Wang, G., 2008. nent analysis for fault detection. 1210 – 1219.
Improved kernel principal compoExpert Systems with Applications 34,
URL: http://www.sciencedirect.com/science/article/
pii/S095741740600409X, doi:http://dx.doi.org/10.1016/j.eswa.2006. 12.010. 440
DAMADICS, . Damadics information web site. http://diag.mchtr.pw.edu. pl/damadics/. Accessed: 15 december 2015. Ding, S.X., 2008. Model-based Fault Diagnosis Techniques: Design Schemes, Algorithms, and Tools. 1st ed., Springer Publishing Company, Incorporated. Fujimaki, R., Yairi, T., Machida, K., 2005. An approach to spacecraft anomaly
445
detection problem using kernel feature space, in: Proceeding of the eleventh ACM SIGKDD international conference on Knowledge discovery in data mining - KDD ´ 05, Association for Computing Machinery (ACM). URL: http: //dx.doi.org/10.1145/1081870.1081917, doi:10.1145/1081870.1081917. Halder, B., Sarkar, N., 2007.
450
in mobile robot, in:
Robust fault detection and isolation
Zhang, H.Y. (Ed.), Fault Detection, Supervi-
sion and Safety of Technical Processes 2006. Elsevier Science Ltd, Oxford, pp. 1407 – 1412. URL: http://www.sciencedirect.com/science/ article/pii/B9780080444857502372,
doi:http://dx.doi.org/10.1016/
B978-008044485-7/50237-2. 455
Hodge, V., Austin, J., 2004. A survey of outlier detection methodologies. Artif. Intell. Rev. 22, 85–126. doi:10.1023/B:AIRE.0000045502.10941.a9. Hu, J., Dong, K., 2015. Detection and repair faults of sensors in sampled control system, in: Fuzzy Systems and Knowledge Discovery (FSKD), 2015 35
12th International Conference on, pp. 2343–2347. doi:10.1109/FSKD.2015. 460
7382319. Isermann, R., 1997. Supervision, fault-detection and fault-diagnosis methods an introduction. Control Engineering Practice 5, 639–652. Isermann, R., 2006. Fault-Diagnosis Systems. An Introduction from Fault Detection to Fault Tolerance. 1 ed., Springer.
465
Kangin, D., Angelov, P., 2015. Evolving clustering, classification and regression with TEDA, in: Proc. IEEE The International Joint Conference on Neural Networks (IJCNN 2015), IEEE. Katipamula, S., Brambley, M.R., 2005. Review article: Methods for fault detection, diagnostics, and prognostics for building systemsa review, part i.
470
HVAC&R Research 11, 3–25. King, S., King, D., Astley, K., Tarassenko, L., Hayton, P., Utete, S., 2002. The use of novelty detection techniques for monitoring high-integrity plant, in: Proceedings of the International Conference on Control Applications, Institute of Electrical & Electronics Engineers (IEEE). URL: http://dx.doi.
475
org/10.1109/CCA.2002.1040189, doi:10.1109/cca.2002.1040189. Laurentys, C., Palhares, R., Caminhas, W., 2010a. Design of an artificial immune system based on danger model for fault detection. Expert Systems with Applications 37, 5145 – 5152. Laurentys, C., Ronacher, G., Palhares, R., Caminhas, W., 2010b. Design of an
480
artificial immune system for fault detection: A negative selection approach. Expert Systems with Applications 37, 5507 – 5513. Leite, D.F., Hell, M.B., Jr., P.C., Gomide, F., 2009. Real-time fault diagnosis of nonlinear systems. Nonlinear Analysis: Theory, Methods & Applications 71, e2665 – e2673.
36
485
Li, X.J., Yang, G.H., 2012. Dynamic observer-based robust control and fault detection for linear systems. Control Theory Applications, IET 6, 2657–2666. Li, Y., Pont, M.J., Jones, N.B., 2002. Improving the performance of radial basis function classifiers in condition monitoring and fault diagnosis applications where ‘unknown’ faults may occur. Pattern Recognition Letters 23, 569–
490
577. URL: http://dx.doi.org/10.1016/S0167-8655(01)00133-7, doi:10. 1016/s0167-8655(01)00133-7. Liukkonen, T., Tuominen, A., 2004. A case study of spc in circuit board assembly: statistical mounting process control, in: Microelectronics, 2004. 24th International Conference on, pp. 445–448 vol.2. doi:10.1109/ICMEL.2004.
495
1314857. Ma, H., Hu, Y., Shi, H., 2013. Fault detection and identification based on the neighborhood standardized local outlier factor method. Industrial & Engineering Chemistry Research 52, 2389–2402. URL: http://dx.doi.org/10. 1021/ie302042c, doi:10.1021/ie302042c.
500
Mendon¸ca, L.F., Sousa, J.M.C., S´ a da Costa, J.M.G., 2009. An architecture for fault detection and isolation based on fuzzy methods. Expert Syst. Appl. 36, 1092–1104. URL: http://dx.doi.org/10.1016/j.eswa.2007.11.009, doi:10.1016/j.eswa.2007.11.009. Mrugalski, M., Korbicz, J., 2007. Application of the {MLP} neural network
505
to the robust fault detection, in: Zhang, H.Y. (Ed.), Fault Detection, Supervision and Safety of Technical Processes 2006. Elsevier Science Ltd, Oxford, pp. 1390 – 1395. URL: http://www.sciencedirect.com/science/ article/pii/B9780080444857502347,
doi:http://dx.doi.org/10.1016/
B978-008044485-7/50234-7. 510
Oblak, S., Skrjanc, I., Blazic, S., 2007. Fault detection for nonlinear systems with uncertain parameters based on the interval fuzzy model. Engineering Applications of Artificial Intelligence 20, 503 – 510.
37
Precup, R.E., Angelov, P., Costa, B.S.J., Sayed-Mouchaweh, M., 2015. An overview on fault diagnosis and nature-inspired optimal control 515
of industrial process applications. – 94.
Computers in Industry 74,
75
URL: http://www.sciencedirect.com/science/article/pii/
S0166361515000469,
doi:http://dx.doi.org/10.1016/j.compind.2015.
03.001. Ramezani, S., Memariani, A., 2011. A fuzzy rule based system for fault diagno520
sis, using oil analysis results. International Journal of Industiral Engineering & Producion Research 22. Saw, J.G., Yang, M., Mo, T.C., 1984. Chebyshev inequality with estimated mean and variance. The American Statistician 38, 130–132. Serdio, F., Lughofer, E., Pichler, K., Buchegger, T., Efendic, H., 2014a.
525
Residual-based fault detection using soft computing techniques for condition monitoring at rolling mills. Inf. Sci. 259, 304–320. doi:10.1016/j.ins.2013. 06.045. Serdio, F., Lughofer, E., Pichler, K., Buchegger, T., Pichler, M., Efendic, H., 2014b. Fault detection in multi-sensor networks based on multivariate time-
530
series models and orthogonal transformations. Information Fusion 20, 272– 291. doi:10.1016/j.inffus.2014.03.006. Singh, K., Upadhyaya, D.S., 2012. Outlier detection: Applications and techniques. International Journal of Computer Science Issues 9. Sobhani, M., Poshtan, J., 2011. Observer-based fault detection and isolation of
535
three-tank benchmark system, in: Control, Instrumentation and Automation (ICCIA), 2011 2nd International Conference on, pp. 759–763. doi:10.1109/ ICCIAutom.2011.6356755. Venkatasubramanian, V., 2003. Abnormal events management in complex process plants: Challenges and opportunities in intelligent supervisory control,
540
in: Foundations of Computer-Aided Process Operations, pp. 117–132. 38
Venkatasubramanian, V., Rengaswamy, R., Kavuri, S., 2003. A review of process fault detection and diagnosis. part i: Quantitative model-based methods. Computers and chemical engineering 27, 293–311. Xu, L., Tseng, H., 2007. Robust model-based fault detection for a roll stability 545
control system. Control Systems Technology, IEEE Transactions on 15, 519– 528. Yan, Z., Chen, C.Y., Yao, Y., Huang, C.C., 2016. Robust multivariate statistical process monitoring via stable principal component pursuit. Industrial & Engineering Chemistry Research 55, 4011–4021. URL: http://dx.doi.org/
550
10.1021/acs.iecr.5b02913, doi:10.1021/acs.iecr.5b02913. Yang, H., Xia, Y., Liu, B., 2011. Fault detection for t-s fuzzy discrete systems in finite-frequency domain. Systems, Man, and Cybernetics, Part B: Cybernetics, IEEE Transactions on 41, 911–920. Yuan, H., Lu, C., Ma, J., han Chen, Z., 2015.
555
based fault detection method for aileron actuator. ical Modelling 39, 5803 – 5815.
Neural networkApplied Mathemat-
URL: http://www.sciencedirect.
com/science/article/pii/S0307904X15001183, doi:http://dx.doi.org/ 10.1016/j.apm.2015.02.032. Zakharov, A., Tikkala, V.M., Jms-Jounela, S.L., 2013. Fault detection and di560
agnosis approach based on nonlinear parity equations and its application to leakages and blockages in the drying section of a board machine. Journal of Process Control 23, 1380 – 1393. URL: http://www.sciencedirect. com/science/article/pii/S0959152413000504, doi:http://dx.doi.org/ 10.1016/j.jprocont.2013.03.006.
565
Zeng, J., Lu, D., Zhao, Y., Zhang, Z., Qiao, W., Gong, X., 2013. Wind turbine fault detection and isolation using support vector machine and a residualbased method, in: American Control Conference (ACC), 2013, IEEE. pp. 3661–3666. URL: http://dx.doi.org/10.1109/acc.2013.6580398, doi:10. 1109/acc.2013.6580398. 39
570
Zhou,
J.H.,
Pang,
C.K.,
Lewis,
F.L.,
Zhong,
Z.W.,
2011.
Dom-
inant feature identification for industrial fault detection and isolation applications. 10684.
URL: http://www.sciencedirect.com/science/article/pii/
S095741741100193X, 575
Expert Systems with Applications 38, 10676 –
doi:http://dx.doi.org/10.1016/j.eswa.2011.01.
160. Zhou,
Y.,
Liu,
J.,
Dexter,
A.L.,
2014.
Estimation of an incipi-
ent fault using an adaptive neurofuzzy sliding-mode observer. ergy and Buildings 77, 256 – 269.
En-
URL: http://www.sciencedirect.
com/science/article/pii/S0378778814000917, doi:http://dx.doi.org/ 580
10.1016/j.enbuild.2014.02.001.
40