In the fuzzy literature, the regression problem with fuzzy data has been previously ..... regression literature, the case of simple linear regression model involving a ...
IFSA-EUSFLAT 2009
An Interval Approach for Fuzzy Linear Regression with Imprecise Data Amory Bisserier1 Reda Boukezzoula1 Sylvie Galichet1 1 Laboratoire d’Informatique, Systèmes, Traitement de l’Information et de la Connaissance (LISTIC)
Université de Savoie BP 80439 74941 Annecy le Vieux, Cedex France Email: {amory.bisserier, reda.boukezzoula, sylvie.galichet}@univ-savoie.fr
Abstract In this paper, a revisited approach for fuzzy regression linear model representation and identification is introduced. By adopting the commonly used principle of D-cuts, the fuzzy regression implementation is reduced to the handling of conventional intervals, for inputs, parameters and outputs. Using the Midpoint-Radius representation of intervals, the uncertainty attached to linear models becomes more interpretable. Actually, it is possible to determine the output uncertainty origin (model parameters and/or inputs). In this context, a possibilistic regression method is proposed to identify models of minimal global uncertainty, that is with respect to all possible inputs. Keywords Interval Regression, Fuzzy Regression, Uncertainty Representation, Fuzzy Inputs-Fuzzy Outputs.
1 Introduction Fuzzy regression, a fuzzy type of conventional regression analysis, has been proposed to evaluate the functional relationship between input and output variables in a fuzzy environment. Indeed, unlike statistical regression modeling based on probability theory, fuzzy regression is based on possibility theory and fuzzy set theory [14]. In the fuzzy literature, the regression problem with fuzzy data has been previously treated from different points of view. According to [5], fuzzy regression techniques can be classified into two distinct areas. The first proposed by Tanaka ([10], [12]) which minimizes the total spread of the output is named possibilistic regression. In this case, the problem is viewed as finding fuzzy coefficients of a regression model according to a mathematical programming problem. The second approach developed by Diamond [4], which minimizes the total square error of the output is called the fuzzy least square method. In this paper a possibilistic approach is adopted. In the chosen possibilistic context, different kinds of input/ output data can be considered. Actually, the complete specification of regression problems highly depends on the nature of input-output data [5]. Some researches are thus devoted to Crisp-Input Crisp-Output (CICO) data [9] while others [6], [7], [8], [13] consider the regression problem using Fuzzy-Inputs and Fuzzy-Outputs (FIFO) data. Most commonly, a mixed approach with Crisp-Inputs and Fuzzy-Outputs (CIFO) is used [1], [2], [10], [11], [12]. In this framework, the fuzzy regression with CICO and CIFO data aroused a major interest. However, the FIFO model regression remains a little studied field. Indeed, only a few paISBN: 978-989-95079-6-8
pers concerning this problem have been published ([6], [7], [8], [13]). For instance, in [6] and [13], different distances are proposed in order to extend the least square method to FIFO data. In [8], a multiobjective optimization technique for FIFO systems is proposed, whereas in [7] the optimization is based on the minimization of the deviation between observations and predictions. All above mentioned methods lead to interesting results but present a lack of representativity and an awkward illustration of the uncertainties in the regression model. In order to overcome this problem, an extension of the regression methodology initially developed for CIFO systems in [1], [2] to FIFO ones is proposed. The key idea of the proposed approach resides in using a Midpoint-Radius regression model representation. By doing so, the regression problem can be viewed as a conventional linear optimization problem where a new criterion is proposed. From a practical point of view and as commonly used in fuzzy regression literature ([5], [7], [8], [12]), the a-cut principle is adopted. In this case, for a specified a-cut, the fuzzy interval becomes a conventional interval, which states that a fuzzy interval representation is a generalization of a conventional one. In order to take into account the maximum of uncertainty in the system (the pessimistic case), an a-cut equal to 0 (0-cut) is considered. In this case, the fuzzy regression problem can be reduced to an interval regression one. That is the approach adopted in this paper where a new regression methodology is proposed. The structure of this paper is as follows. In section 2, relevant concepts and notations are introduced. Section 3 is devoted to fuzzy regressive models representation. An identification method of such models based on a linear problem optimization is proposed in section 4. An application is shown in section 5. Finally, conclusion and perspectives are presented in section 6.
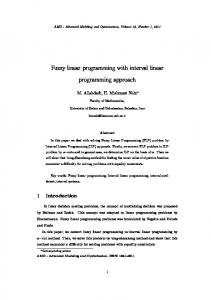
2 Relevant Concepts and Notations For the sake of rigor and clarity, let us define the basic notions and notations used in this paper. A fuzzy trapezoidal interval A is a particular case of a fuzzy number where a possibility distribution, represented by a membership function PA, is associated with the conventional intervals of the support and the kernel (see Figure 1).
1305
IFSA-EUSFLAT 2009
level 1
Radius
Kernel
A-(0)
A-(1)
A+(1)
Thick intervals
RA level 0
A+(0)
Support
Figure 1: Trapezoidal fuzzy interval representation
+
(1)
A � D = > A � D � A � D @ Using the D-cut representation, a symmetrical fuzzy interval is viewed as a weighted family of nested intervals. In the sequel, in order to consider the maximum uncertainty, only Dcuts at level 0 will be considered. Consequently, all computations are performed with conventional intervals. In this framework, an interval A is defined by the set of elements lying between its lower and upper limits (endpoints) as: -
+
-
+
A = >A � A @ = ^x A d x d A � x `
(2)
The interval A is called thick if A- < A+ and thin (or point) if A - = A +. In order to manipulate and exhibit the uncertainty with intervals, an efficient representation is needed. Indeed, the latter should be able to represent arbitrary intervals and their sets in a single and uniform graphical way. In this framework, it is obvious that to uniquely define an interval, two parameters are necessary, hence the space of intervals is two-dimensional. There are many possible representations of an interval. The most used one is the endpoints representation given in equation (2). However, the main drawback of this representation resides in the fact that the uncertainty (the Radius) is awkward and not directly exhibited in the interval. In order to overcome this difficulty, another representation is adopted. Indeed, in order to facilitate the uncertainty representation, Midpoint (M) and Radius (R) coordinates are used (see Figure 2). In this case, an interval is represented as a point in the space (M, R). For an interval A, its Midpoint and its Radius are defined by: -
+
+
-
lower bound line of A
0
A-
(3) M A = � A + A e 2 and: R A = � A – A e 2 Moreover, the set of all the intervals contained in the interval A can be represented by a domain C(A). As shown in Figure 2, the domain C(A) is represented by the upper and lower bound lines of A, forming a triangle. In the (M, R) representation, it is clear that the most imprecise element of C(A) is the interval A itself which corresponds to the highest value of Radius, i.e. the top of the triangle. On the opposite, the triangle base represents all the crisp values between the lower and the upper bounds (the set of all the thin intervals).
upper bound line of A
Midpoint +
A = MA + R A
MA
Thin intervals = M - R A A
In this case, for a given D-cut (D[0, 1]) on the fuzzy interval A, a conventional interval is obtained: -
.
A = [A-, A+]= MA ± RA
Constant Radius Line
Midpoint Line
A
Constant
PA
Figure 2: Midpoint-Radius representation of A and C(A) For two intervals A = [A�, A+] and B = [B�, B+], the addition and multiplication operations are defined as follows: A B = > A - + B -� A + + B + @ ® ¯ A
B = > min � Z � max � Z @
(4)
where: - -
- +
+ -
+ +
(5) Z = ^A B � A B � A B � A B ` In this case, it can be stated that the Midpoint and Radius of these operations are given by: MA B = MA MB (6) ® ¯ RA B = RA RB and: M A
B = M A M B + M A
B sign � M A M B ® ¯ RA
B = RA RB + MA RB + RA MB – MA
B where: M A
B = min ^ M A R B� R A M B � R A R B `
(7)
(8)
For two intervals [3] A and B, an inclusion relation of A in B (see Figure 3) is defined as follows: B dA MB – RB d MA – RA ® AB® ¯ A+ d B+ ¯ MA + RA d MB + RB
(9)
MB – MA d RB – RA ® ¯ MA – MB d RB – RA
(10)
From equation (10) it follows: A B MB – M A d RB – RA Radius RB RA
0
..
(11)
B = [B-, B+] = MB ± RB A = [A-, A+]= MA ± RA
Midpoint B- A
MA
MB
A+
B+
Figure 3: Inclusion of two intervals (A �B)
3 Fuzzy Regressive Model Representation ISBN: 978-989-95079-6-8
1306
IFSA-EUSFLAT 2009 The fuzzy linear regression model is the most frequently used form in regression analysis for expressing the relationship between one or more explanatory variables and response. For the sake of simplicity and as commonly assumed in the fuzzy regression literature, the case of simple linear regression model involving a single independent variable is considered. The case of multiple inputs is a straightforward generalization of this methodology but more complex in a computational point of view. An interval regression model is mathematically expressed in the following form: Y � X = A0 A1
X (12) where Y is the interval output (dependant variable), A0 and A1 the interval parameters, i.e. unknowns to be estimated from observed data. According to (3), the parameters A0 and A1 are denoted as follows: -
Imprecise-Inputs and Imprecise-Outputs. For an interval in- + put X = X * = > X *� X * @ , the interval model output is given by the following equation with Z defined according to (5): -
+
-
(15) - + + + = > A 0 + A 1 X *� A 0 + A 1 X * @ In this case, the input X can be any interval included in the interval D previously defined for crisp inputs. Consequently, the model definition domain is now ' = C(D) (see Figure 2). The model output evolution is presented in Figure 5. Y
.
Y*+
. . .
+
-
+
Y � X * = > Y *� Y * @ = A 0 A 1 X * (14) In this case, the definition domain is the interval D = [inf(D), sup(D)], which means that the input X can take any crisp value in D. For the sake of illustration simplicity, in the sequel, the particular case when the parameter A1 and the input are positive is considered. The other cases are a straightforward generalization of this particular case. The evolution of the model output (14) is illustrated in Figure 4. Actually, as the input X is a crisp value of D, the model output uncertainty is only due to the uncertainty of the two parameters A0 and A1. Y Definition domain : D
S3
S4
A 0 = > A 0� A 0 @ = > M A – R A � M A + R A @ 0 0 0 0
(13) - + A 1 = > A 1� A 1 @ = > M A – R A � M A + R A @ 1 1 1 1 The input X can take any value in a definition domain to be chosen. As mentioned in the introduction, the regression problem has been previously treated from different points of view and by considering different kinds of input/output data. Indeed, according to the nature of X (crisp or imprecise) two regression problems can been distinguished. The first one deals with Crisp-Input Imprecise-Output data ([12], [10], [1], [2]). In this case, as the model is linear and the inputs are considered as crisp values, the model output (12) will also be an interval. So, for a crisp input X = X*, equation (12) becomes:
+
Y � X * = > Y *� Y * @ = > A 0 + min � Z � A 0 + max � Z @
S1
Y*-
S2
Y* = A0 A1
�X*
A0
X*-
0
X
X*+
Figure 5: Conventional interval model representation Several main drawbacks can be underlined: • The interval input X* is represented by its endpoints coordinates on a real line with only one dimension. It leads to a lack of information about the input uncertainty (Radius). In this case, neither the definition domain '�nor the output uncertainty on it can be exhibited in a conventional 2D space. • According to Figure 5, the model output is defined by the 4-sided area delimited by the four vertices (S1, S2, S3, S4). If the vertices S1 and S3 exhibit the model output bounds, the others (S2 and S4) have no interpretability in the model output. In this situation, two intervals are defined to represent the model output, which limits the interpretability of this kind of representation ([7], [8]). In order to deal with these drawbacks, the Midpoint-Radius representation is used to define all handled intervals. In this context, the output Y is expressed by:
Y*+
-
+
Y � X * = > Y *� Y * @ = > M Y � X – R Y � X � M Y � X + R Y � X @ *
*
*
(16)
*
where:
Y*
Y* = A0 A1.X* A0 0
.
X*
X
Figure 4: Interval model representation with a crisp input The second regression problem is devoted to systems with ISBN: 978-989-95079-6-8
= MA + MA
X M Y � X* 0 1 * ® ¯ RY � X* = RA0 + RA1
X* For positive parameter A1 and input X*, we have: M A
X = M A M X + M A
X sign � M A M X 1
*
1
*
1
*
1
*
(17)
(18)
As:
1307
IFSA-EUSFLAT 2009 M A
X = min ^ M A R X � R A M X � R A R X ` 1 * 1 * 1 * 1 *
,
(19)
= RA RX 1 * the equation (18) becomes: MA
X = MA MX + RA RX (20) 1 * 1 * 1 * By adopting the same principle, the following Radius expression is determined: RA
X = RA RX + MA RX + RA MX – RA RX 1 * 1 * 1 * 1 * 1 * (21) = MA RX + RA MX 1
*
1
0
1
*
1
Y*+ RX
Y* = A0 A1
�X* Definition domain ' = C(D)
A0
*
The Midpoint and Radius output evolutions on the domain ' are illustrated in Figure 6 and Figure 7. MY
Y
*
By substitution of equations (20) and (21) in (17), it follows: = MA + MA MX + RA RX M Y � X* 0 1 * 1 * (22) ® ¯ RY � X = RA + MA RX + RA MX *
the contributions of the parameters A0, A1 and the input X are well defined in the model output (22).
Y*-
RX*
MX
MX*
RX
Figure 8: The model output evolution
4 Interval Regressive Model Identification M Y* MA
0
RX
Definition domain ' = C(D)
*
MX
MX *
Figure 6: The midpoint output evolution RY
RX
Definition domain ' = C(D)
R Y* RA
0
RX* MX*
Figure 7: The radius output evolution.
+
-
0
From equations (16) and (22), it is obvious that: (23)
A global representation of the model output evolution on the domain ' is illustrated in Figure 8. This Midpoint-Radius representation presents several advantages: • In this representation, only one interval output is defined for a considered input. Indeed, the output expression represents as well the contribution of the input Midpoint and Radius. • According to this representation, the origin of uncertainty in the output can be precisely determined. In other words, ISBN: 978-989-95079-6-8
-
+
D = min � X j and D = max � X j
(24)
Like any regression technique, the fuzzy regression objective is to determine a predicted functional relationship between inputs X and outputs Y: (25) Yˆ � X = A A
X
MX
Definition domain : C(D)
Y- = M – R + � M – R � M – R A0 A0 A1 A1 X* X* ° * ® + °Y = M + R + �M + R �M + R A0 A0 A1 A1 X* X* ¯ *
In the context of regression model identification, two main problems come up, namely, the model structure specification and the estimation of the given model. The first problem is focused on the choice of a suitable model structure for a data set. This problem is traditionally addressed a priori. In this paper, as commonly used, the model structure is assumed to be linear. In this case, the regression problem is reduced to an estimation problem of the model parameters. Let us consider a set of N observed data samples. Let the jth sample be represented by the couple (Xj, Yj), j = 1,..., N where Xj are interval inputs and the Yj are the corresponding interval output. All the observed input intervals are assumed to be included in the interval D = > D-� D+ @ given by:
1
In this case, the definition domain of the identified model is the set of all the intervals included in D, i.e. ' = C(D). As discussed in the paper introduction, a possibilistic regression approach is adopted where the objective is to determine the model parameters such that the observed data are included in the predicted ones (possibility model). In this framework, another kind of model (necessity one) could be identified [11]. In the proposed identification methodology, two points have to be considered for its implementation: • the interval inclusion constraints to be introduced in the optimization problem, • the identification criterion to be optimized. 4.1 The optimization constraints In this case, the inclusion constraints are given by:
1308
IFSA-EUSFLAT 2009 Y j Yˆj M ˆ – M Y d R ˆ – R Y Yj Yj j j
with: M ˆ = M A + M A
X and: R ˆ = R A + R A
X (27) Yj Yj 0 1 j 0 1 j By substitution of (27) in (26), the constraints inclusion can be written as: MA + MA MX + RA RX – MY d 0 1 j 1 j j (28) RA + MA RX + RA MX – RY 0
1
j
1
j
j
Moreover, the optimization constraints must ensure the identification of intervals, whose bounds are ordered. Moreover, the sign of the parameter A1 must be constrained as well. In the case of a model whose parameter A1 is identified as positive, it follows: (29) R A t 0� and : M A t R t 0 0
1
4.2 The used criterion The objective is to identify the less imprecise model on its definition domain, as it has been proposed in our previous works [1]. The computation of the global uncertainty on the whole domain D proposed in [1] is here extended to the whole domain ', whose elements are intervals. It follows that the criterion J to be optimized, i.e. the global uncertainty on ', is expressed as:: ˆ + – Yˆ - dM dR = 2 X X
³ ³ �Y '
= 2
³³
³ ³ RYˆ dMX dRX '
(30)
R A + M A R X + R A M X dM X d R X 0 1 1
'
The substitution of equation (23) in (30) yields to: 2 2 3 2 (31) J = 2R A R D + 2R A R D M D + --- M A R D 0 1 1 3 To sum up, the identification method is performed by minimizing the criterion (31) under the constraints (28) and (29). At this stage, several points can be discussed about the proposed approach: • As the interval D is defined with the observed inputs, its Radius and Midpoint are known numerical values. So, the criterion J is linear according to the optimization variables. Moreover, J is independent of the observed inputs, i.e. the optimization is made on the whole domain ' of the model, not only on the observed data. This point contributes to improve the model robustness. • It is obvious that the criterion must be optimized under constraints in order to ensure inclusion property. If the constraints are released, the identified model corresponds to the minimal possible uncertainty, achieved with null parameters, and has no sense. • As the minimization of the model uncertainty is performed on ', the input uncertainty is considered in the model output expression in the identification process.
ISBN: 978-989-95079-6-8
In this part, the proposed identification method is applied on the illustrative example given in [8], [7]. Given the data set [8], [7] illustrated in Table 1, corresponding of D-cuts of level 0 of proposed fuzzy data set, the objective is to identify the model parameters A0 and A1. Table 1: Observed data set and predicted one inputs Xj
observed outputs Yj
predicted outputs Yˆ
[1.5 ; 2.5]
[3.5 ; 4.5]
[3.5 ; 6.5]
[3 ; 4]
[5 ; 6]
[4.16 ; 7.25]
[4.5 ; 6.5]
[6.5 ; 8.5]
[4.82 ; 8.5]
[6.5 ; 7.5]
[6 ; 7]
[5.69 ; 9]
[8 ; 9]
[8 ; 9]
[6.35 ; 9.75]
[9.5 ; 11.5]
[7 ; 9]
[7 ; 11]
[10.5 ; 11.5]
[10 ; 11]
[7.45 ; 11]
[12 ; 13]
[9 ; 10]
[8.1 ; 11.75]
j
A1
It is important to note that all the considered constraints in the identification problem are linear according to the identification variables (Midpoint and Radius of A0 and A1).
J =
5 Illustrative example
(26)
The considered definition domain is D = [1.5, 13] and represented in Figure 9. This domain corresponds to a set of positive inputs, and, as discussed previously, the parameter A1 is assumed to be positive too. The identified parameters corresponding to the less imprecise model according to the criterion J defined in (31) are: (32) A 0 = > 2.844 ; 5.25 @ and A 1 = > 0.438 ; 0.5 @ In this case, the optimal value of uncertainty obtained is J = 153.95 . The identified model output representation is given in Figure 9, whereas the predicted outputs are presented in Table 1.
Figure 9: Identified model representation. As presented in Table 1, the main advantage of the proposed approach compared to those presented in [7] and [8] is that only one interval output corresponds to a considered input. In Figure 9, it can be stated that the desired inclusion is respected. Another advantage of the representation using the (Midpoint, Radius) space for the interval inputs concerns the exploitation
1309
IFSA-EUSFLAT 2009 of the model characteristics. According to (22), the output Radius evolution on ' can be represented (see Figure 10). On the axe (MX, RX = 0), i.e. the triangle basis, only the parameter uncertainty is exhibited, whereas at the top of the triangle, the output uncertainty is maximum, corresponding to the most uncertain input in ', i.e. D. In this example (Figure 10), the output radius is nearly constant on the basis of the triangle, corresponding to the case of a nearly crisp parameter A1. The output radius increasing on ' is essentially due to the input uncertainty.
inclusion is ensured. Further work will focus on the extension of this approach to fuzzy linear systems, by considering the vertical dimension D. In the proposed space, a symmetrical trapezoidal fuzzy interval can be interpreted by a zooming operation as illustrated in the following Figure 11: Radius RA(0) Zooming operation
RA(1)
. .
A(0) = MA(0) ± RA(0) A(1) = MA(1) ± RA(1) A(D) = MA(D) ± RA(D)
Midpoint MA(0) = MA(1)
Figure 11: Midpoint-Radius representation of symmetrical trapezoidal fuzzy interval D-cuts. A particular attention should be paid to the loss of linearity of the membership function of the model output, due to the fuzzy product between the input X and the parameter A1. References
Figure 10: Identified model output Radius evolution. The same analysis can be performed on the output Midpoint evolution on ', corresponding to the global tendency of the output on the domain. In [8], the identified model, whose output respects the inclusion statement, corresponds to a criterion value J = 281.03 , according to (31). Its parameters are the following: (33) A 0 = > 1.25 ; 6.75 @and A 1 = > 0.4 ; 0.56 @ In fact, the vertical dimension D is introduced into the proposed multiobjective optimization problem. It is known that the higher the D value is set for optimization, the more uncertain the identified model is and inclusion is respected for any lower D levels. So, this compromise between higher level of inclusion and lower uncertainty leads to the identification of a model whose uncertainty is not minimal on the domain. On the other hand, the proposed method in [7], which minimizes deviations between observations and predictions without constraining inclusion, leads to the identification of a model which corresponds to a criterion value J = 102.6 , and whose parameters are: (34) A 0 = > 3 ; 3.82 @and A 1 = > 0.5 ; 0.54 @ It is obvious that guaranteeing the inclusion increase the model uncertainty.
6 Conclusion In this paper, a revisited representation of interval regressive model is proposed and used in an identification problem. By adopting the Midpoint-Radius formalism for intervals, uncertainty representation is improved. Applied to regressive interval models, this formalism allows a better handling of the input uncertainty in the definition domain establishment and in the model output definition. In an identification problem, based on the optimization of a linear expression of the model output global uncertainty on its definition domain, the desired ISBN: 978-989-95079-6-8
[1] A. Bisserier, S. Galichet, R. Boukezzoula, Fuzzy Piecewise Linear Regression, 5th IEEE World Congress on Computational Intelligence (WCCI 2008 / FUZZ-IEEE 2008), Hong-Kong, China, 2008, 2089-2094. [2] A. Bisserier, R. Boukezzoula, S. Galichet, Linear fuzzy regression using trapezoidal fuzzy intervals, Information Processing and Management of Uncertainty (IPMU2008), Malaga, Spain, 2008, 181-188 [3] R.Boukezzoula, S. Galichet and L. Foulloy, MIN and MAX Operators for Fuzzy Intervals and their Potential Use in Aggregation Operators, IEEE Trans. on Fuzzy Systems 15(6): 1135-1144, 2007 [4] P. Diamond, Fuzzy Least Squares, Information Sciences 46: 141-157, 1988. [5] P. Diamond , H. Tanaka, Fuzzy regression analysis, Fuzzy sets in decision analysis, operations research and statistics, Kluwer Academic Publishers, Norwell, MA, 1999. [6] P. D'Urso, Linear regression analysis for fuzzy/crisp input and fuzzy/ crisp output data, Computational Statistics & Data Analysis 42 (1-2), 2003, 47-72. [7] M. Hojati, C.R. Bector, K. Smimou, A simple method for computation of fuzzy linear regression, European Journal of Operational Research 166: 172-184, 2005. [8] M. Sakawa, H. Yano, Multiobjective fuzzy linear regression analysis for fuzzy input-output data, Fuzzy Sets and Systems 47: 173-181, 1992. [9] D.A. Savic, W. Pedrycz, Evaluation of fuzzy linear regression models, Fuzzy Sets and Systems 39, 1991, 51-63. [10] H.Tanaka, I. Hayashi, J. Watada, Possibilistic linear regression analysis for fuzzy data, European Journal of Operational Research 40: 389-396, 1989. [11] H. Tanaka, H. Lee, Interval regression analysis by quadratic programming approach, IEEE Trans. on Fuzzy Systems 6(4): 473-481, 1998. [12] H.Tanaka, S. Uejima, K. Asai, Linear regression analysis with fuzzy model, IEEE, Systems, Trans. Systems Man Cybernet. SMC-2: 903-907, 1982. [13] H.-C. Wu, Fuzzy estimates of regression parameters in linear regression models for imprecise input and output data, Computational Statistics & Data Analysis 42 (1-2), 2003, 203-217. [14] L.A. Zadeh, Fuzzy Sets, Information and Control 8: 338-353, 1965.
1310