Implemented in Python and relying on existing open-source software GRASS GIS and R. The ... We tested the performance and transferability of the processing chain using sub-metric ..... Classification scheme and size of training and test set.
AN OPEN-SOURCE SEMI-AUTOMATED PROCESSING CHAIN FOR URBAN OBIA CLASSIFICATION T. Grippaa*, M. Lennerta, B. Beaumontab, S. Vanhuyssea, N. Stephenneb, E. Wolffa a
IGEAT, Université Libre De Bruxelles, Belgium - (tgrippa, mlennert, bbeaumon, svnhuyse, ewolff)@ulb.ac.be b ISSeP, Institut Scientifique de Service Public, Belgium - (b.beaumont, n.stephenne)@issep.be
KEY WORDS: Open source, Urban land-cover, OBIA supervised classification, Segmentation, Optimization, GRASS GIS
ABSTRACT: This study presents the development of a semi-automated processing chain for OBIA urban land-cover and land-use classification. Implemented in Python and relying on existing open-source software GRASS GIS and R. The complete tool chain is available in open-access and adaptable to specific user needs. For automation purpose, we developed two GRASS GIS add-ons allowing (1) to optimize segmentation parameters in an unsupervised manner and (2) to classify remote sensing data using several individual machine learning classifiers or their predictions combination through voting-schemes. We tested the performance and transferability of the processing chain using sub-metric multispectral and height data on two very different urban environments: Ouagadougou, Burkina Faso in sub-Saharan Africa and Liège, Belgium in Western Europe. Using a hierarchical classification scheme, the kappa values reached for both cities about 0.78 at the second level (9 and 11 classes) and 0.90 at the first level (5 classes).
1. INTRODUCTION Land-use/land-cover (LULC) information extraction is one of the main use cases of remote sensing imagery. The advent of sub-meter resolution data brought about the revolution of methods from pixel-based to object-based image analysis (OBIA) involving image segmentation. The latter provides many new opportunities and highly increases the quality of the output, but there remains a number of challenges to address. First of all, segmentation parameters are often selected after tedious and time-consuming trial-and-error refinement (Zhang et al., 2008; Blaschke, 2010). This method consists in a manual step-by-step segmentation parameters adjustment, relying on subjective visual human interpretation. Despite such efforts, the validity of the selected parameters is usually restricted to the specific scene under study, or even to specific areas within this scene, and they have to be adapted for each dataset. Unsupervised evaluation methods meet the requirements for automation in the OBIA process, as they can be used to automatically adjust segmentation parameters (Zhang et al., 2008). Second, during the classification step, many authors use rulebased approaches, which can be quite efficient on a specific dataset (e.g. Salehi et al., 2012; O’Neil-Dunne et al., 2013). However, their transferability remains an issue as they also generally rely on manual intervention by the authors, with many choices guided by scene specificities. As an alternative, machine-learning classifiers have proven their efficiency for remote sensing data classification. While identification of the best performing classifier cannot rely on a-priori knowledge, the combination of results of multiple classifiers through ensemble or voting schemes is a solution towards the development of more automated classification processes (Moreno-Seco et al., 2006).
*
Corresponding author
Third, much of the work presented on OBIA tool chains is black box. First, specific decisions of authors concerning parameter settings in the manual processes described above are based on their subjective evaluation, which is not always easy to reproduce. Moreover, proprietary software used for the analyses presents issues of lack of peer review options, even if the procedures that are implemented are documented. This concerns the core software and also, in some cases, extensions of that software published closed-source (Drăguţ et al., 2014). In times when reproducibility of research is high on the discussion agenda, the use of free and open-source solutions, including access to the code developed by researchers in their work, becomes paramount. Linked to the previous point, the question of access to the necessary tools is of great importance, especially for many researchers in poorer countries where the lack of resources reduces the options. Again, free and open-source solutions provide an answer to this issue by creating common pool resources that all researchers can use, but also contribute to. Licensing costs can also be an obstacle to upscaling of processes, especially in times of big data with ever-increasing spatial, spectral and temporal resolutions. Free and open-source software can help researchers surmount this challenge by letting them run their programs on as many different cores or machines as necessary without having to worry about software costs. In this paper, we present a complete framework for urban LULC mapping from earth observation data, which responds at least partly to the above issues. It was developed in a completely free and open-source environment, using GRASS GIS and R, and immediately reinjected into the wider open-source community. It contains tools for automatic parameter selection for segmentation, statistical characterization of objects and machine-learning techniques combined through a majorityvoting scheme. Care was taken to make the use of this processing chain accessible even to non-programmers. The
proposed framework was tested on two very different urban environments. 2. METHODS AND TOOLS The entire processing chain relies on existing open-source software. It was implemented in a 'Jupyter notebook' using the GRASS Python scripting library, which allows calling GRASS GIS functions directly from Python. The script is structured into clear steps and documented with references to scientific articles used. The GRASS GIS add-ons implemented in our processing chain are briefly presented below. 2.1 Segmentation and unsupervised parameter optimization (USPO) tools
segmentation
The segmentation was performed using the i.segment module of GRASS GIS (Eric Momsen, Markus Metz, and GRASS Development Team, 2015). This module implements image segmentation with a region-growing algorithm that requires a standardized ‘threshold’ parameter below which regions are merged, and a ‘minsize’ parameter defining the minimum size of regions. As we looked for automation, we elaborated a new GRASS GIS add-on for unsupervised segmentation parameter optimization (USPO) called i.segment.uspo (Moritz Lennert, and GRASS Development Team, 2016a). This tool is an implementation of methods developed by Espindola et al. (2006) and Johnson et al. (2015). It relies on optimization functions combining measures of weighted variance (as intra-segment homogeneity quality measure) and spatial autocorrelation (as inter-segment heterogeneity quality measure). Two optimization functions are proposed: a simple sum of the normalized criteria values as defined by Espindola et al. (2006), or the F-function as defined by Johnson et al. (2015) which permits to weight the two optimization criteria. On the basis of a range of parameter values provided by the user, the i.segment.uspo tool creates a set of segmentation results, which are then assessed using the optimization function. With this module, it is possible to optimize the segmentation parameter for several subsets of the scene.
2.2 Object statistics computation Object statistics were computed using the i.segment.stats GRASS GIS add-on (Moritz Lennert, and GRASS Development Team, 2016b) and were used as features in the classification process. This tool allows the computation of both spectral and morphological statistics of objects. 2.3 Classification by combination of multiple machine learning classifiers The classification stage of the processing chain uses the v.class.mlR GRASS GIS add-on (Moritz Lennert, and GRASS Development Team, 2016c). It relies on the utilization of the "Caret" library of R software (R Development Core Team, 2008), and allows the classification of data using Support Vector Machine, Random Forest, Recursive partitioning, and k-Nearest Neighbors classifiers. This add-on automatically tunes classifiers' parameters using repeated cross-validation with 10 iterations of 5-fold cross-validation on the training data set (these default values can be changed). Predictions of individual classifiers are then combined using several types of majority vote. Four voting systems are provided: "Simple Majority Vote" (SMV), "Simple Weighted Vote" (SWV), "Best Worst Weighted Vote" (BWWV) and "Quadratic Best Worst Weighted Vote" (QBWWV) (Moreno-Seco et al., 2006). 3. CASE STUDIES 3.1 Study areas and data As a proof of concept, the processing chain was applied to two very distinct urban environments using datasets with different spatial resolutions and consisting of multi-spectral and height data: Ouagadougou (Burkina Faso, in Sub-Saharan Africa) and Liège (Belgium, in Western Europe). More broadly, this work is linked with two research projects dealing with the production (MAUPP project, focusing on African Sub-Saharan cities) and the update (SmartPop project, focusing on the Walloon region in Belgium) of LULC maps. These maps will be used later as input in census population data disaggregation models. The processing chain was first developed on Ouagadougou,
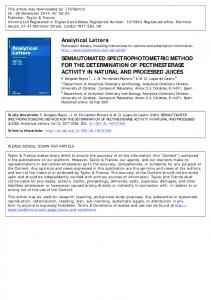
Figure 1. Ouagadougou and Liège case studies. True color composite is used as background. The classification was made on the white-squared subset. Training samples are in yellow while the test samples are in red
capital of Burkina Faso in Western Africa. Covering more than 615 km², this city has been facing intensive urban sprawl during the last decades as most of Sub-Saharan cities and is characterized by very different urban patterns, among others planned versus unplanned residential areas. The processing chain was then applied to the Liège area (261 km²), a Western European city located in Belgium which shows strong land artificialization (more than 55% of the territory). Urban morphologies are more diversified (from isolated houses to 10+ storey buildings), but urban sprawl is limited and controlled in comparison with Africa. Data used for Ouagadougou were a pansharpenened stereo WorldView-3 imagery (VNIR product, 0.5 meters) acquired during the wet season (October 2015) and a nDSM produced from WorldView-3 by stereophotogrammetry (0.5 meters). For Liège, the data consisted in VNIR aerial orthophotos with a spatial resolution of 0.25 meters acquired on leaf-on (May 2012) and a nDSM extracted from LiDAR data (1-3pt/m²) that was acquired on leaf-off (winter 2013-2014). As our processing chain is under development, we focused the classification effort on a 25 km² subset for both cities (see Figure 1), representative of the diversity of landscapes and urban forms.
class is dedicated to shadows; their post-processing is out of the scope of this article. The classification was made based on the second-level classes, which were aggregated to match the first-level classes. 3.3 Sampling scheme Sampling was conducted outside the processing chain, by generating random points and labelling them through image interpretation. Although existing geodatabases were used for stratification, a visual interpretation was needed to bypass misregistration or land-cover changes. The training set was generated for the whole area excluding the subset where the classification was produced. An independent test set was generated inside this subset for performance evaluation purposes. We used this approach to avoid potential spatial autocorrelation between the training and test sets (Brenning, 2012). For Ouagadougou, OpenStreetMap (OSM) datasets were used for stratification as far as possible according to availability, i.e., for the level 2 classes Buildings, Asphalt surfaces, and Inland waters. When OSM datasets consisted of lines, as is the case for asphalt roads and watercourses, buffers were created. Manual sampling was required for Swimming pools and Shadow classes.
3.2 Legend / Classification scheme Because our final goal is to map the land use, the classification scheme is organized in two hierarchical levels (see Table 1).
For Liège, existing TOP10V (IGN, 2010) and PICC (SPW, 2007) geodatabases were used for the stratification of the majority of level 2 classes. Manual sampling was needed for the class Shadow. Given the production date of the geodatabases used, visual validation of sampling was needed to match the 2013 land-cover status. In total, 1352 training points and 369 test points were created for Ouagadougou and 549 training points and 388 test points for Liège. The smaller size of the training set for Liège is explained by the reduced number of classes, their higher homogeneity and the intensive use of reference geodatabases. The class-distribution detail is presented in Table 1. 3.4 Segmentation The segmentation and USPO steps were made using multispectral information for each datasets. For Ouagadougou, NDVI was also used as additional layer. The "minsize" parameter was set in order to match the chosen minimum mapping unit. The latter was defined according to the geographical context in order to identify the smallest houses/shelters : 2 m² for Ouagadougou and 15 m² for Liège. The intervention of the operator in the segmentation process was limited to set the range of "threshold" parameters to be tested (minimum, maximum and intervals). The optimized threshold was then automatically determined via the i.segment.uspo add-on. 3.5 Classification feature
Table 1. Classification scheme and size of training and test set for Ouagadougou and Liège The first level contains only land-cover (LC) classes, while the second level is a LULC mix of classes. At both levels, an extra
For both case studies, the minimum, maximum, range, standard deviation, sum and median statistics were computed on each multispectral bands, NDVI and nDSM. The latter were completed with morphological attributes of objects (area, perimeter and compactness).
4. RESULTS Existing open-source solutions were used for developing a semi-automated processing chain for urban OBIA classification. This chain is available at http://maupp.ulb.ac.be/geobia_2016. Anyone interested can use and/or adapt it to match different project-specific needs, by integrating additional steps (e.g., automated image pre-processing, computation of spectral or textural indices, automated sampling based on existing reference geodatasets,..). The transferability and adaptability of the processing chain was confirmed by applying it to two very different urban contexts. Some results are illustrated here after.
Using our semi-automated processing chain, we reach kappa values of 0.79 (Ouagadougou) and 0.77 (Liège) at level 2. When considering the first level, kappa values increase up to 0.90 (Ouagadougou) and 0.89 (Liège). Classification confusions occur between different vegetation classes or between asphalt and bare soil classes for both case studies. In Ouagadougou specific confusion is observed between bare soils classes. This explains the gaps of performance between the two hierarchical classification levels.
The segmentation process using USPO enabled us to obtain very convincing results. As can be seen on Figure 2, the image is segmented into meaningful objects; under-segmentation is nearly absent and over-segmentation is limited. Accuracy measures for the four individual classifiers and their fusion using four voting systems are presented in Table 2. Individual classifier performance ranking is the same for both cities, with Random Forest (RF) performed best, followed by Support Vector Machine (SVMradial), then Recursive partitioning (Rpart) and finally K–Nearest Neighbors classifiers (kNN). Votes' results are very close to each other and perform similarly as the best individual classifier (RF), excepting for SMV. This appears consistent with Moreno-Seco et al. (2006) who showed that use of voting-systems could either improve, equal or underperform accuracy of individual classifiers.
Table 2. Performance evaluation of individual classifiers and four different voting systems (OA: Overall accuracy. L1 and L2: Levels of the classification scheme) The Building class is of particular importance in the framework of the MAUPP and SmartPop projects since their objective is to disaggregate census population data using LULC maps in order to map the spatial distribution of the population densities inside each city. This class reached per-class kappa values of 0.88
Figure 2. True color composite (left), results of USPO segmentation (center), classification at level 2 with SWV vote (right) on a subset for each case studies
(Ouagadougou) and 0.97 (Liège). 5. CONCLUSION AND PERSPECTIVES This research is a contribution towards the development of a transparent and open-source fully automated processing chain for urban LULC mapping. This framework is very adaptable and transferable. It proved its ability of being quickly customized in order to match the requirements of different projects, with very different urban morphologies and different datasets. The results achieved on our case studies are very satisfying taking into account the complexity of the urban environments and the detail of the legend. The generation of training and validation samples still requires strong manual experts’ intervention. This remains a challenge to overcome by future research looking for automation, especially when highly accurate reference geodatabases are not available. In that case, alternative data like OpenStreetMap data could be used but their quality is often inconsistent and they should therefore be assessed prior to any automated use. In order to improve the segmentation and hence the resulting classification, we intend to implement multi-level segmentation and to assess its added value. Another improvement concerns the features used as input in the classification process. Currently, only relatively simple object statistics are used. Band ratios and several textural indices will be added. They will be automatically computed and submitted to a feature selection procedure. Regarding the classification, as the potential spatial autocorrelation in the training/validation set can lead to undetected overfitting (Brenning, 2012), we will investigate the possibility of implementing spatial cross-validation instead of the non-spatial one currently used. Moreover, we will explore the possibilities to implement a class-specific weighted vote. Voting-system currently used to combine predictions of the different classifiers are based weights computed with overall accuracy or kappa, but non-best classifiers often outperform the best one's performance regarding to specific classes. Since the performances of different LULC mapping methods are currently being assessed in the SmartPop project, our open-source semi-automated approach will be compared to a rule-based classification. This second approach integrates existing GIS layers (buildings, roads, rails & water bodies), updates them and classifies lands outside of these thematic data using rule-based on remotely sensed input data. Constrained segmentation using ancillary vector layers in GRASS GIS will be investigated in the next steps. In the near future, the processing chain will be tested on different datasets and/or cities. For the MAUPP project, optical and SAR data will be integrated in order to improve the accuracy and the chain will be applied to Ouagadougou (Burkina Faso), Dakar and Saint-Louis (Senegal). For the SmartPop project, Pleiades imagery will be used instead of orthophotos in order to assess the comparative advantage of each dataset. Thereafter, the efficiency of the processing chain will be tested for the automated processing of a very large area (i.e., the Walloon Region in Belgium).
ACKNOWLEDGEMENTS This work was funded by the Belgian Federal Science Policy Office (BELSPO) (Research Program for Earth Obervation STEREO III, contract SR/00/304 - as part of the MAUPP project - http://maupp.ulb.ac.be) and by Moerman research program of ISSeP (SmartPop project http://www.issep.be/smartpop). REFERENCES Blaschke, T. (2010). Object based image analysis for remote sensing. ISPRS J. Photogramm. Remote Sens. 65, pp. 2–16. Brenning, A. (2012). Spatial cross-validation and bootstrap for the assessment of prediction rules in remote sensing: The R package sperrorest. (IEEE), pp. 5372–5375. Drăguţ, L., Csillik, O., Eisank, C., and Tiede, D. (2014). Automated parameterisation for multi-scale image segmentation on multiple layers. ISPRS J. Photogramm. Remote Sens. 88, pp. 119–127. Eric Momsen, Markus Metz, and GRASS Development Team (2015). Module i.segment. Geographic Resources Analysis Support System (GRASS) Software, Version 7.0. Open Source Geospatial Foundation. https://grass.osgeo.org/grass70/manuals/i.segment.html Espindola, G.M., Camara, G., Reis, I.A., Bins, L.S., and Monteiro, A.M. (2006). Parameter selection for region‐ growing image segmentation algorithms using spatial autocorrelation. Int. J. Remote Sens. 27, pp. 3035–3040. Johnson, B.A., Bragais, M., Endo, I., Magcale-Macandog, D.B., and Macandog, P.B.M. (2015). Image Segmentation Parameter Optimization Considering Within- and Between-Segment Heterogeneity at Multiple Scale Levels: Test Case for Mapping Residential Areas Using Landsat Imagery. ISPRS Int. J. GeoInf. 4, pp. 2292–2305. Moreno-Seco, F., Inesta, J.M., De León, P.J.P., and Micó, L. (2006). Comparison of classifier fusion methods for classification in pattern recognition tasks. In Joint IAPR International Workshops on Statistical Techniques in Pattern Recognition (SPR) and Structural and Syntactic Pattern Recognition (SSPR), (Springer), pp. 705–713. Moritz Lennert, and GRASS Development Team (2016a). Addon i.segment.uspo. Geographic Resources Analysis Support System (GRASS) Software, Version 7.0. Open Source Geospatial Foundation. https://grass.osgeo.org/grass70/manuals/addons/i.segment.uspo. html Moritz Lennert, and GRASS Development Team (2016b). Addon i.segment.stats. Geographic Resources Analysis Support System (GRASS) Software, Version 7.0. Open Source Geospatial Foundation. https://grass.osgeo.org/grass70/manuals/addons/i.segment.stats. html Moritz Lennert, and GRASS Development Team (2016c). Addon v.class.mlR. Geographic Resources Analysis Support
System (GRASS) Software, Version 7.0. Open Source Geospatial Foundation. https://grass.osgeo.org/grass70/manuals/addons/v.class.mlR.htm l O’Neil-Dunne, J.P.M., MacFaden, S.W., Royar, A.R., and Pelletier, K.C. (2013). An object-based system for LiDAR data fusion and feature extraction. Geocarto Int. 28, pp. 227–242. R Development Core Team (2008). R: A language and environment for statistical computing (Vienna, Austria: R Foundation for Statistical Computing). Salehi, B., Zhang, Y., Zhong, M., and Dey, V. (2012). ObjectBased Classification of Urban Areas Using VHR Imagery and Height Points Ancillary Data. Remote Sens. 4, pp. 2256–2276. Zhang, H., Fritts, J.E., and Goldman, S.A. (2008). Image segmentation evaluation: A survey of unsupervised methods. Comput. Vis. Image Underst. 110, pp. 260–280.