AN UNSUPERVISED SEGMENTATION WITH AN ADAPTIVE NUMBER OF CLUSTERS USING CLOUDE-POTTIER DECOMPOSITION, WISHART TEST STATISTIC AND MCCV ALGORITHM FOR FULLY POLARIMETRIC SAR DATA ANALYSIS Cao Fang1,2,3 , Hong Wen1,2 , Wu Yirong1,2 , and Eric Pottier4 1
National Key Laboratory of Microwave Imaging Technology, Beijing, China 2 3
Institute of Electronics, Chinese Academy of Sciences, Beijing, China
The Graduate School of Chinese Academy of Sciences, Beijing, China 4
IETR UMR CNRS 6164, University of Rennes 1, Rennes, France
[email protected]
ABSTRACT In this paper, an unsupervised segmentation method is proposed for fully polarimetric SAR data. We introduce the MCCV algorithm to automatically estimate the optimal number of clusters from the data inner structure. The experimental results show that the number of classes is a crucial point for the unsupervised segmentation, which will strictly affect the segmentation performance. The MCCV algorithm represents to be a reliable method to estimate the appropriate number of clusters, and the proposed segmentation algorithm also provides better performance than the general Wishart H/α/A segmentation. Key words: Cloude-Pottier decomposition; SPAN; H/α/A; complex Wishart; agglomerative hierarchical clustering; Monte-Carlo Cross-Validation (MCCV); loglikelihood; unsupervised classification; polarimetric SAR.
Monte-Carlo Cross-Validation (MCCV) algorithm to determine the number of clusters which is the best for the data inner structure. The segmentation result with the optimal number of clusters is chosen as the final result.
2.
SPAN/H/α/A INITIALIZATION
The SPAN [3, 4] and the H/α/A are combined to perform the initialization. Since the H/α/A contain no power information, it may be useful to add SPAN to improve the initialization performance. Moreover, since we are going to search all possible numbers of clusters to estimate the optimal one, the searching range of the possible number of clusters should be large enough. It seems reasonable to use SPAN to achieve our purposes. The SPAN is defined as the total backscattering power of the three scattering mechanisms SP AN = λ1 + λ2 + λ3 .
1. INTRODUCTION The standard Cloude-Pottier eigenvalue/eigenvector decomposition is widely used to extract the feature parameters of the polarimetric SAR data. Three parameters, entropy (H), scattering angle (α) [1], anisotropy (A) [2], are given from this decomposition, which can be used for fully polarimetric SAR data segmentation. The proposed unsupervised segmentation uses the SPAN/H/α/A to initialize the data. The Wishart Maximum Likelihood (ML) algorithm [5, 6] is applied to optimize the initialization. Then an agglomerative hierarchical clustering algorithm based on the Wishart test statistic [7, 8] is iteratively performed to merge the pair of classes with the smallest distance. We introduce the
(1)
Our experiments show that the scattering power information is able to maintain the fine structures within the image and to preserve the image resolution. The hyper-box segmentation of the SPAN/H/α/A combined with the complex Wishart clustering is used to perform the unsupervised initialization. The thresholds for the H/α plane are given by [1], which provide 8 clusters. The threshold for the A is given by [2], which can further segment the data into 16 clusters. The thresholds of the SPAN are determined by separating the histogram into equal density parts. Theoretically the number of the parts could be freely defined, from 1 to the number of the whole data samples, but in practice, we usually set the number of the parts to 3 to save computation time and get enough large range of the possible number of clusters. Thus the initialization can provide 48 clusters.
3. AGGLOMERATIVE HIERARCHICAL CLUSTERING We propose an agglomerative hierarchical clustering to provide the initial clusters with different number of clusters. It should be noted that this agglomerative hierarchical clustering could also be used for the segmentation with a predefined number of clusters. The agglomerative hierarchical clustering algorithm [10] performs a hierarchical clustering process from the maximum number of clusters to the minimum number of clusters. The maximum number of clusters is set to 48 (Sec. 2), which is also the initial number of clusters for the agglomerative hierarchical clustering. The minimum number of clusters is 1. For each iteration, the distances of all possible pairs of clusters are calculated using a measure function, and the two clusters with the minimum distance are chosen to be merged to decrease the number of clusters. The Wishart test statistic [7, 8, 11] is used as a measure function to quantify the distance of two clusters. It can be defined as a likelihood-ratio function to test the equality of two cluster center coherency matrices (Ci , Cj ), and the distance measure dm (Ci , Cj ) at the mth iteration is given by dm (Ci , Cj ) = (Ni + Nj ) ln Cˆ − Ni ln Cˆi − Nj ln Cˆj ,
(2)
where Ni and Nj are the numbers of samples within the cluster sets θi and θj , i, j = 1, · · · , m, i 6= j. Equation (2) is used as the measure function to calculate the distance of two clusters. The pair of clusters with the minimum log-likelihood min(dm (Ci , Cj )) should be merged during the agglomerative hierarchical clustering procedure.
Let N be the number of the whole samples, and X represents the whole sample coherency matrix set (X = {T1 , · · · , TN }). The mth data log-likelihood is ÃN ! Y Lm (X) = ln p(Tl |Θm ) . (4) l=1
Assuming a priori probability p(i) is equal for all i,The mth data log-likelihood can be defined as Lm (X) = −N ln m + (n − q)ΣN l=1 ln |Tl | m +ΣN l=1 ln (Σi=1 exp (−n · dm (Tl , Ci ))) , (5)
where dm (Tl , Ci ) = ln |Ci | + Tr(Ci−1 Tl ) [5, 6]. Lm (X) is only dependent on m. Thus it provides a validation function of m. Unfortunately, Lm (X) can not be directly used to estimate the optimal number of clusters, since Lm (X) shall increase monotonically with the increasing of m when the data set X is fixed [12]. The solution is to introduce the Cross-Validation algorithm to propose a mth Cross-Validation log-likelihood. We separate randomly the data into two disjoint parts: the training data X train and the test data X test . X train is used to calculate the mth training cluster center coherency matrices Citrain , and the X test and Citrain are used to calculate the mth Cross-Validation log-likelihood. The Monte-Carlo method is used to get an unbiased estimation of the Cross-Validation log-likelihood. The Cross-Validation is performed Q times, and at each time we choose randomly the test data and the training data. Typically, As the m increases, the Cross-Validation log-likelihood shall increase firstly, and then decrease [12, 13]. The decreasing indicates that the segmentation may be over-fitted [13]. The optimal number of clusters is chosen at the first maximum of the averaged CrossValidation log-likelihood [13].
5.
4. MONTE-CARLO CROSS-VALIDATION
EXPERIMENTAL RESULTS AND DISCUSSION
The MCCV algorithm [12] is introduced to estimate the optimal number of clusters. Smyth [12] shows that the MCCV algorithm is a reliable method to estimate the number of clusters for the data with complex inner structure [12]. It might also be a valuable method for fully polarimetric SAR data.
ESAR L-band data of Oberpfaffenhofen, Germany 1 are used for discussion. This fully polarimetric SAR data has a dimension of 2816×1540 pixels. It provides a good coverage of typical targets, such as buildings, forests, agricultural crops, highway and airport. Lee’s polarimetric filter [14] is used to reduce the speckle.
Let m be the number of clusters. The mixture probability density function of T given m clusters can be written as
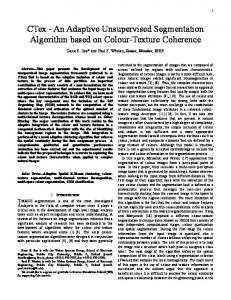
The statistics of the averaged Cross-Validation loglikelihood versus the number of clusters m are given in fig. 1. The plot of the averaged Cross-Validation loglikelihood increases rapidly at first, and then decrease slowly. The averaged Cross-Validation log-likelihoods reaches the local maximum when m equals 13, which is chosen as the location of the estimated optimal number of
p(T |Θm ) =
m X
p(i)p(T |θi ),
(3)
i=1
where p(T |θi ) is the probability density function of T given a cluster θi (i = 1, · · · , m). It should be noted that p(T |Θm ) is only related to T and m.
1 The data are downloaded http://earth.esa.int/polsarpro/datasets.html.
from
0.035
−39.4
0.03
−39.6 −39.8 −40 −40.2
The averaged Cross− Validation log−likelihood The estimated optimal number of clusters
−40.4 −40.6
0
10
20 30 The number of clusters
40
50
(a) The averaged Cross-Validation log-likelihood
The standard deviation
The averaged Cross−Validation log−likelihood
−39.2
Std The estimated optimal number of clusters
0.025 0.02 0.015 0.01 0.005 0
0
10
20 30 The number of clusters
40
50
(b) The standard deviation
Figure 1. The statistics of the Cross-Validation log-likelihood versus the number of clusters m (Lee 5×5). The range of m is set to 3 ≤ m ≤ 48 to improve the contrast. The estimated optimal number of clusters is 13. clusters. This consists with our analysis that typically, the Cross-Validation log-likelihood shall reach a maximum, which could be chosen as the estimated optimal number of clusters (Sec. 4).
the proposed segmentation algorithm also provides better performance than the general Wishart H/α/A method.
The resulting image of the proposed segmentation is given to show the effectiveness (Fig. 2(c)). The segmentation results of the Wishart H/α classification [15, 16] and the Wishart H/α/A classification [17, 18, 19] are also provided for comparison (Fig. 2(a) and 2(b)). According to the results in fig. 2, the averaged Cross-Validation loglikelihood of the Wishart H/α method is less than that of the Wishart H/α/A. It coincides with the statement that the Wishart H/α/A method provides better performance than the Wishart H/α method [17, 18, 19]. Moreover, the proposed method provides the highest averaged CrossValidation log-likelihood, which is in agreement with the viewpoint that determining the number of clusters directly from the data analysis should improve the segmentation performance. It also shows the potential capability to use the MCCV algorithm to validate quantitatively the segmentation performance.
REFERENCES
6. CONCLUSION This proposed method uses the SPAN/H/α/A initialization and the complex Wishart segmentation to perform the unsupervised segmentation. The agglomerative hierarchical clustering algorithm and the MCCV algorithm are introduced to reduce the number of classes and to estimate the optimal number of clusters. The main advantage of this unsupervised segmentation is that it classifies the fully polarimetric SAR data with an adaptive number of clusters instead of a fixed number of clusters. It automatically searches the optimal number of clusters according to the inner structure of the data. The experimental results show that the MCCV algorithm seems to be a reliable method to estimate the optimal number of clusters, and
[1] S. Cloude and E. Pottier, “A review of target decomposition theorems in radar polarimetry,” IEEE Trans. Geosci. Remote Sensing, vol. 34, no. 2, pp. 498–518, Nov. 1996. [2] E. Pottier, “The H/A/α polarimetric decomposition approach applied to PolSAR data processing,” in Proceedings of the PIERS Workshop on Advances in Radar Methods, Baveno, Italy, July 1998, pp. 120– 122. [3] K. Kimura, Y. Yamaguchi, and H. Yamada, “Unsupervised land cover classification using H/α/T P space applied to POLSAR image analysis,” IEICE Transactions on Communications, vol. E87-B, no. 6, pp. 1639–1647, Jun. 2004. [4] ——, “Pi-SAR image analysis using polarimetric scattering parameters and total power,” in Proc. IGARSS’03, vol. 1, July 2003, pp. 425–427. [5] J. S. Lee, M. R. Grunes, and R. Kwok, “Classification of multi-look polarimetric SAR imagery based on complex Wishart distribution,” Int.J. Remote Sensing, vol. 15, no. 11, pp. 2299–2311, 1994. [6] J. S. Lee, M. R. Grunes, T. Ainsworth, L.-J. Du, D. Schuler, and S. Cloude, “Unsupervised classification using polarimetric decomposition and the complex Wishart classifier,” IEEE Trans. Geosci. Remote Sensing, vol. 37, no. 5, pp. 2249–2257, Sept. 1999. [7] K. Conradsen, A. A. Nielsen, J. Schou, and H. Skriver, “Change detection in polarimetric SAR data and the complex wishart distribution,” in Proc. IGARSS’01, vol. 6, Jul 2001, pp. 2628–2630.
(a) Wishart H/α (m=8, L=-39.634765)
(b) Wishart H/α/A (m=16, L=-39.496821)
(c) The proposed method (m=13, 39.334405)
L=-
Figure 2. The segmentation results of the Wishart H/α, the Wishart H/α/A and the proposed method. m represents the number of clusters within the resulting image. The L represents the averaged Cross-Validation log-likelihood. (ESAR, L-band, Oberpfaffenhofen, Lee filter 5×5) [8] K. Conradsen, A. Nielsen, J. Schou, and H. Skriver, “A test statistic in the complex Wishart distribution and its application to change detection in polarimetric SAR data,” IEEE Trans. Geosci. Remote Sensing, vol. 41, no. 1, pp. 4–19, Jan. 2003. [9] E. Pottier, “Unsupervised classification scheme and topography derivation of PolSAR data based on the H/α/A polarimetric decomposition theorem,” in Proceedings of the 4th International Workshop on Radar Polarimetry, Nantes, France, July 1998, pp. 535–548. [10] S. Theodoridis and K. Koutroumbas, Pattern Recognition, second ed. Beijing, P.R. China: China Machine Press, Sept. 2003. [11] P. Kersten, J. S. Lee, and T. Ainsworth, “Unsupervised classification of polarimetric synthetic aperture radar images using fuzzy clustering and EM clustering,” IEEE Trans. Geosci. Remote Sensing, vol. 43, no. 3, pp. 519–527, Mar. 2005. [12] P. Smyth, “Clustering using Monte-Carlo CrossValidation,” in Proceedings of the 2nd International Conference on Knowledge Discovery and Data Mining. Portland, Oregon: AAAI Press, 1996, pp. 126–133. [13] R. O. Duda, P. E. Hart, and D. G. Stork, Pattern Classification, second ed. New York: John wiley and Sons, 2001.
[14] J. S. Lee, M. R. Grunes, and G. Grandi, “Polarimetric SAR speckle filtering and its implication for classification,” IEEE Transaction on Geoscience and Remote Sensing, vol. 37, no. 5, pp. 2363–2373, Sep 1999. [15] J. S. Lee and M. Grunes, “Unsupervised classification using polarimetric decomposition and complex Wishart classifier,” in PIERS 1998, 1998. [16] J. S. Lee, M. R. Grunes, T. L. Ainsworth, L. Du, D. L. Shuler, and S. R. Cloude, “Unsupervised classification of polarimetric SAR images by applying target decomposition and complex Wishart distribution,” in Proc. 4th Int. Workshop on Radar Polarimetry, Nantes, France, Jul 1998, pp. 196–202. [17] E. Pottier and J. S. Lee, “Application of the H/A/alpha polarimetric decomposition theorem for unsupervised classification of fully polarimetric SAR data based on the Wishart distribution,” in Proc. Committee on Earth Observing Satellites SAR Workshop, Toulouse, France, Oct 1999. [18] E. Pottier and J. S. Lee, “Unsupervised classification scheme of PolSAR data based on the complex Wishart distribution and the H/A/α polarimetric decompostion theorem,” in EUSAR2000, 2000. [19] L. Ferro-Famil, E. Pottier, and J. S. Lee, “Classification and interpretation of polarimetric SAR data,” in Proc. IGARSS’02, Toronto, Canada, Jun 2002.