STATISTICAL INFERENCE BY INVERSE PROBABILITY. Inverse probability .... θ
itself is a random variable with a probability density p(θ). We can then find the.
Anders Hald A History of Parametric Statistical Inference from Bernoulli to Fisher, 1713 to 1935
department of applied mathematics and statistics university of copenhagen
department of applied mathematics and statistics university of copenhagen universitetsparken 5 dk-2100 copenhagen ø c Anders Hald ° 2004 ISBN 87-7834-628-2
Contents Preface
v
Chapter 1. The three revolutions in parametric statistical inference 1.1. Introduction 1.2. Laplace on direct probability, 1776-1799 1.3. The first revolution: Laplace 1774-1786 1.4. The second revolution: Gauss and Laplace 1809-1828 1.5. The third revolution: R. A. Fisher 1912-1956
1 1 1 2 3 5
Part 1. BINOMIAL STATISTICAL INFERENCE The three pioneers: Bernoulli (1713), de Moivre (1733) and Bayes (1764)
9
Chapter 2. James Bernoulli’s law of large numbers for the binomial, 1713, and its generalization 11 2.1. Bernoulli’s law of large numbers for the binomial, 1713 11 2.2. Remarks on further developments 13 Chapter 3. De Moivre’s normal approximation to the binomial, 1733, and its generalization 3.1. De Moivre’s normal approximation to the binomial, 1733 3.2. Lagrange’s multivariate normal approximation to the multinomial and his confidence interval for the binomial parameter, 1776 3.3. De Morgan’s continuity correction, 1838 Chapter 4. Bayes’s posterior distribution of the binomial parameter and his rule for inductive inference, 1764 4.1. The posterior distribution of the binomial parameter, 1764 4.2. Bayes’s rule for inductive inference, 1764
15 15 19 21 23 23 25
Part 2. STATISTICAL INFERENCE BY INVERSE PROBABILITY. Inverse probability from Laplace (1774), and Gauss (1809) to Edgeworth (1909) 27 Chapter 5. Laplace’s theory of inverse probability, 1774-1786 5.1. Biography of Laplace 5.2. The principle of inverse probability and the symmetry of direct and inverse probability, 1774 5.3. Posterior consistency and asymptotic normality in the binomial case, 1774 i
29 29 30 33
ii 5.4. The predictive distribution, 1774-1786 35 5.5. A statistical model and a method of estimation. The double exponential distribution, 1774 36 5.6. The asymptotic normality of posterior distributions, 1785 38 Chapter 6. A nonprobabilistic interlude: The fitting of equations to data, 1750-1805 6.1. The measurement error model 6.2. The method of averages by Mayer, 1750, and Laplace, 1788 6.3. The method of least absolute deviations by Boscovich, 1757, and Laplace, 1799 6.4. The method of least squares by Legendre, 1805 Chapter 7. Gauss’s derivation of the normal distribution and the method of least squares, 1809 7.1. Biography of Gauss 7.2. Gauss’s derivation of the normal distribution, 1809 7.3. Gauss’s first proof of the method of least squares, 1809 7.4. Laplace’s large-sample justification of the method of least squares, 1810 Chapter 8. Credibility and confidence intervals by Laplace and Gauss 8.1. Large-sample credibility and confidence intervals for the binomial parameter by Laplace, 1785 and 1812 8.2. Laplace’s general method for constructing large-sample credibility and confidence intervals, 1785 and 1812 8.3. Credibility intervals for the parameters of the linear normal model by Gauss, 1809 and 1816 8.4. Gauss’s rule for transformation of estimates and its implication for the principle of inverse probability, 1816 8.5. Gauss’s shortest confidence interval for the standard deviation of the normal distribution, 1816
43 43 44 45 47 49 49 50 52 53 55 55 55 56 57 57
Chapter 9. The multivariate posterior distribution 59 9.1. Bienaymé’s distribution of a linear combination of the variables, 1838 59 9.2. Pearson and Filon’s derivation of the multivariate posterior distribution, 1898 59 Chapter 10. Edgeworth’s genuine inverse method and the equivalence of inverse and direct probability in large samples, 1908 and 1909 10.1. Biography of Edgeworth 10.2. The derivation of the t distribution by Lüroth, 1876, and Edgeworth, 1883 10.3. Edgeworth’s genuine inverse method, 1908 and 1909 Chapter 11.1. 11.2. 11.3.
11. Criticisms of inverse probability Laplace Poisson Cournot
61 61 61 63 65 65 67 68
iii 11.4. Ellis, Boole and Venn 11.5. Bing and von Kries 11.6. Edgeworth and Fisher
69 70 71
Part 3. THE CENTRAL LIMIT THEOREM AND LINEAR MINIMUM VARIANCE ESTIMATION BY LAPLACE AND GAUSS
73
Chapter 12. Laplace’s central limit theorem and linear minimum variance estimation 12.1. The central limit theorem, 1810 and 1812 12.2. Linear minimum variance estimation, 1811 and 1812 12.3. Asymptotic relative efficiency of estimates, 1818 12.4. Generalizations of the central limit theorem
75 75 77 79 81
Chapter 13.1. 13.2. 13.3. 13.4.
13. Gauss’s theory of linear minimum variance estimation The general theory, 1823 Estimation under linear constraints, 1828 A review of justifications for the method of least squares The state of estimation theory about 1830
85 85 87 88 90
Part 4. ERROR THEORY. SKEW DISTRIBUTIONS. CORRELATION. SAMPLING DISTRIBUTIONS
93
Chapter 14. The development of a frequentist error theory 14.1. The transition from inverse to frequentist error theory 14.2. Hagen’s hypothesis of elementary errors and his maximum likelihood argument, 1837 14.3. Frequentist error theory by Chauvenet, 1863, and Merriman, 1884 Chapter 15.1. 15.2. 15.3. 15.4. 15.5. 15.6. 15.7.
15. Skew distributions and the method of moments The need for skew distributions Series expansions of frequency functions. The A and B series Biography of Karl Pearson Pearson’s four-parameter system of continuous distributions, 1895 Pearson’s χ2 test for goodness of fit, 1900 The asymptotic distribution of the moments by Sheppard, 1899 Kapteyn’s derivation of skew distributions, 1903
95 95 96 97 101 101 102 107 109 111 113 114
Chapter 16. Normal correlation and regression 16.1. Some early cases of normal correlation and regression 16.2. Galton’s empirical investigations of regression and correlation, 1869-1890 16.3. The mathematization of Galton’s ideas by Edgeworth, Pearson and Yule 16.4. Orthogonal regression. The orthogonalization of the linear model
117 117
125 130
Chapter 17. Sampling distributions under normality, 1876-1908
133
120
iv 17.1. The distribution of the arithmetic mean 17.2. The distribution of the variance and the mean deviation by Helmert, 1876 17.3. Pizzetti’s orthonormal decomposition of the sum of squared errors in the linear-normal model, 1892 17.4. Student’s t distribution by Gosset, 1908 Part 5.
THE FISHERIAN REVOLUTION, 1912-1935
133 133 136 137 141
Chapter 18.1. 18.2. 18.3.
18. Fisher’s early papers, 1912-1921 143 Biography of Fisher 143 Fisher’s “absolute criterion”, 1912 147 The distribution of the correlation coefficient, 1915, its transform, 1921, with remarks on later results on partial and multiple correlation148 18.4. The sufficiency of the sample variance, 1920 155
Chapter 19.1. 19.2. 19.3.
19. The revolutionary paper, 1922 The parametric model and criteria of estimation, 1922 Properties of the maximum likelihood estimate The two-stage maximum likelihood method and unbiasedness
157 157 159 163
Chapter 20. Studentization, the F distribution and the analysis of variance, 1922-1925 165 20.1. Studentization and applications of the t distribution 165 20.2. The F distribution 167 20.3. The analysis of variance 168 Chapter 21. The likelihood function, ancillarity and conditional inference 21.1. The amount of information, 1925 21.2. Ancillarity and conditional inference 21.3. The exponential family of distributions, 1934 21.4. The likelihood function Epilogue Terminology and notation Books on the history of statistics Books on the history of statistical ideas References Subject index Author index
173 173 173 174 174 175 176 177 177 178 195 199
Preface This is an attempt to write a history of parametric statistical inference. It may be used as the basis for a course in this important topic. It should be easy to read for anybody having taken an elementary course in probability and statistics. The reader wanting more details, more proofs, more references and more information on related topics may find so in my previous two books: A History of Probability and Statistics and Their Applications before 1750, Wiley, 1990, and A History of Mathematical Statistics from 1750 to 1930, Wiley, 1998. The text contains a republication of pages 488-489, 494-496, 612-618, 620-626, 633-636, 652-655, 670-685, 713-720, and 734-738 from A. Hald: A History of Mathc 1998 by John Wiley & Sons, ematical Statistics from 1750 to 1930, Copyright ° Inc. This material is used by permission of John Wiley & Sons, Inc. I thank my granddaughter Nina Hald for typing the first version of the manuscript. September 2003 Anders Hald I thank Professor Søren Johansen, University of Copenhagen, for a thorough discussion of the manuscript with me. I thank Professor Michael Sørensen, Department of Applied Mathematics and Statistics, University of Copenhagen for including my book in the Department’s series of publications. December 2004 Anders Hald
v
vi
James Bernoulli (1654-1705)
Abraham de Moivre (1667-1754)
Pierre Simon Laplace (1749-1827)
vii
Carl Frederich Gauss (1777-1855)
Ronald Aylmer Fisher (1890-1962)
CHAPTER 1
The three revolutions in parametric statistical inference 1.1. Introduction The three revolutions in parametric statistical inference are due to Laplace (1774), Gauss and Laplace (1809-1811) and Fisher (1922a). We shall use p(·) generically to denote a frequency function, continuous or discontinuous, and p(x|θ) to denote a statistical model defined on a given sample space and parameter space. Let x = (x1 , . . . , xn ) denote a sample of n independent observations. From the model we can find the sampling distribution of the statistic t(x), and from p(t|θ) we can find probability limits for t for any given value of θ. This is a problem in direct probability, as it was called in the nineteenth century. In inverse probability the problem is to find probability limits for θ for a given value of x. Bayes (1764) was the first to realize that a solution is possible only if θ itself is a random variable with a probability density p(θ). We can then find the conditional distributions p(θ|x) and p(θ|t), which can be used to find probability limits for θ for any given value of x. Independently of Bayes, Laplace (1774) gave the first general theory of statistical inference based on inverse probability. 1.2. Laplace on direct probability, 1776-1799 At the same time as he worked on inverse probability Laplace also developed methods of statistical inference based on direct probability. At the time the problems in applied statistics were mainly from demography (rates of mortality and the frequency of male births) and from the natural sciences (distribution of errors and laws of nature). It was therefore natural for Laplace to create a theory of testing and estimation comprising relative frequencies, the arithmetic mean and the linear model, which we shall write in the form y = Xβ + ε, where y = [y1 , . . . , yn ]0 denotes the vector of observations, β = [β 1 , . . . , β m ]0 the unknown parameters, ε = [ε1 , . . . , εn ]0 the independently distributed errors, and X = [x1 , . . . , xm ] the m column vectors of the matrix of coefficients, which are supposed to be given numbers. We also write y = Xb + e, where b is an estimate of β and e denotes the corresponding residuals. The error distributions discussed at the time were symmetric with known scale parameter, the most important being the rectangular, triangular, quadratic, cosine, semi-circular, and the double exponential. The normal distribution was not yet invented. The arithmetic mean was ordinarily used as estimate of the location parameter. Laplace (1781) solved the problem of finding the distribution of the mean by means of the convolution formula. However, this was only a solution in principle because all the known error distributions, apart from the rectangular, led to unmanageable distributions of the mean. He also gave the first test of significance of a mean based 1
2 1.3. The first revolution: Laplace 1774-1786 on the probability of a deviation from the expected value as large or larger than the observed, assuming that the observations are rectangularly distributed. Three methods of fitting the linear model to data without specification of the error distribution were developed. P The method of averages by Mayer (1750) and Laplace (1788) requiring that wik ei = 0, where the w’s are suitably chosen weights and the number of equations equals the number of unknown parameters. The method of least absolute deviations by Boscovich (1757) and Laplace (1786), P P were wi e = 0 and wi |ei | is minimized for the two-parameter model. The method of minimizing the largest absolute deviation by Laplace (1786), that is, minβ maxi |yi − βxi |. He evaluated the results of such analyses by studying the distribution of the residuals. 1.3. The first revolution: Laplace 1774-1786 Turning to inverse probability let us first consider two values of the parameter and the corresponding direct probabilities. Laplace’s principle says, that if x is more probable under θ2 than under θ1 and x has been observed, then the probability of θ2 being the underlying value of θ (the cause of x) is larger than the probability of θ1 . Specifically, Laplace’s principle of inverse probability says that p(θ2 |x) p(x|θ2 ) = p(θ1 |x) p(x|θ1 ) for all (θ1 , θ2 ), or equivalently that p(θ|x) ∝ p(x|θ), that is, inverse probability is proportional to direct probability. In the first instance Laplace formulated this principle intuitively, later he proved it under the supposition that the prior density is uniform on the parameter space. Fisher (1922a) introduced the likelihood function Lx (θ), defined as proportional to p(θ|x), to avoid the theory of inverse probability. The relation between the theories of Laplace and Fisher is illustrated in the following diagram: p(θ|x) Inverse probability
∝
p(x|θ) ∝ Lx (θ) Direct probability Likelihood Laplace | F isher
The history of statistical inference is about p(x|θ) and its two interpretations, or in modern terminology about sampling distributions, posterior distributions, and the likelihood function. The mathematical part of the three topics are closely related and a new result in any of the three fields has repercussions in the other two. Based on Laplace’s principle it is a matter of mathematical technique to develop a theory of testing, estimation and prediction, given the model and the observations. Laplace did so between 1774 and 1786. To implement the theory for large samples Laplace developed approximations by means of asymptotic expansion of integrals, both for tail probabilities and for probability integrals over an interval containing the mode. Using the Taylor expansion about the mode ˆθ, and setting log Lx (θ) = l(θ),
3 1.4. The second revolution: Gauss and Laplace 1809-1828 he found 1 log p(x|θ) = constant + l(θ) = constant + l(ˆθ) + (θ − ˆθ)2 l00 (ˆθ) + . . . , 2 which shows that θ is asymptotically normal with mean ˆθ and variance [−l00 (ˆθ)]−1 . In this way Laplace proved for the binomial distribution that the most probable value of θ equals the observed relative frequency h and that θ is asymptotically normal with mean h and variance h(1 − h)/n. Moreover, to test the significance of the difference h1 − h2 between two relative frequencies, he showed that θ1 − θ2 is asymptotically normal with mean h1 −h2 and variance h1 (1−h1 )/n1 +h2 (1−h2 )/n2 , which led him to the large sample test of significance used today. There is, however, an inconsistency in Laplace’s theory of estimation. For the binomial and the multinomial distributions he uses the most probable value as estimate, but in the measurement error model he introduces a new criterion to estimate the location parameter, namely to minimize the posterior expected loss, using the absolute deviation as loss function. He proves that this leads to the posterior median as estimator. His justification for this procedure is that the absolute deviation is the natural measure of the goodness of the estimate and that it corresponds to the gambler’s expected loss in a game of chance. The introduction of a loss function proved to be a serious mistake, which came to hamper the development of an objective theory of statistical inference to the present day. It is of course the beginning of the split between inference and decision theory. To try out the new method Laplace chose the simplest possible error distribution with infinite support, the double exponential distribution. For three observations he found that the estimate is a root of a polynomial equation of the 15th degree. It must have been a great disappointment for him that the combination of the simplest possible error distribution and the simplest possible loss function led to an unmanageable solution, even for three observations. In 1799, at the end of the first revolution, one important problem was still unsolved: the problem of the arithmetic mean. Applying all the known methods of estimation to all the known error distributions led to estimates of the location parameter different from the mean. Nevertheless, in practice everybody used the mean. 1.4. The second revolution: Gauss and Laplace 1809-1828 The second revolution began in 1809-1810 with the solution of the problem of the mean, which gave us two of the most important tools in statistics, the normal distribution as a distribution of observations, and the normal distribution as an approximation to the distribution of the mean in large samples. In 1809 Gauss asked the question: Does there exist an error distribution leading to the mean as estimate of the location parameter according to the principle of inverse probability? Gauss did not make the mistake of Laplace of introducing a loss function, instead he used the most probable value of the parameter as estimate. Setting the posterior mode equal to the arithmetic mean of the observations he got a functional equation with the normal distribution as solution. The normal
4 1.4. The second revolution: Gauss and Laplace 1809-1828 distribution thus emerged as a mathematical construct, and Gauss did not compare the new error distribution with observations. Assuming that the observations are normally distributed he found that the most probable value of the location parameter is obtained by minimizing the exponent P (yi − θ)2 , which naturally leads to the mean. If θ is a linear function of m parameters, θ = Xβ, the estimates are found by minimizing the sum of the squared errors (Y − Xβ)0 (Y − Xβ). Assuming the variance of the y’s to be known, Gauss solved the estimation problems for the linear-normal model and derived the multivariate normal distribution of the parameters. Before having seen Gauss’s book, Laplace (1810a) published a paper in which he derived the first version of the central limit theorem, which says that regardless of the shape of the error distribution, if only the variance is finite, the mean will be approximately normally distributed in large samples. As his immediate reaction to Gauss’s results Laplace made two remarks (1810b): (1) If the error distribution is normal, then the posterior distribution is normal and the posterior mean and median are equal. Hence, the method of least squares follows from my method of estimation as a special case. (2) If the error distribution has finite variance, but is otherwise unknown, then the central limit theorem gives a large-sample justification for the method. Hence, in the first instance, both Gauss and Laplace used inverse probability in their derivations of the method of least squares. But already in 1811 Laplace gave an alternative derivation based on direct probability using the asymptotic normality of a linear combination of observations and minimizing the expected absolute error, which for the normal distribution is proportional to the expected squared error. In 1823 and 1828 Gauss supplemented Laplace’s large-sample frequentist theory by a small-sample theory. Like Laplace he replaced the assumption of normality with the weaker assumption of finite variance, but in contradistinction to Laplace he used squared error as loss function because of its greater mathematical simplicity. He then developed the theory of linear, unbiased, minimum variance estimation for the linear model in the form known today. Hence, they both gave up the normality assumption as too restrictive. Gauss’s two proofs both became popular and existed beside each other in spite of their contradictory assumptions. One reason for this may be the following argument due to Laplace. In 1812 Laplace made an important observation on the equivalence of direct and inverse probability for finding large-sample limits for the binomial parameter. Direct probability leads to the limits for the relative frequency h of the form p h ∼ θ ± θ(1 − θ)/n,
disregarding terms of the order of 1/n. But for this order of approximation the limits may also be written as p h ∼ θ ± h(1 − h)/n,
5 1.5. The third revolution: R. A. Fisher 1912-1956 which solved for θ gives p θ ∼ h ± h(1 − h)/n. However, these limits are the same as those following from inverse probability. Generalizing this argument, the probability limits for the estimate t becomes √ t ∼ θ ± σ/ n, and for the estimate s
√ s ∼ σ ± κ/ n. Combining these relations we get √ t ∼ θ ± s/ n
which leads to the limits for θ,
√ θ ∼ t ± s/ n.
This kind of reasoning explains why the methods of direct and inverse probability could coexist in statistical practice without serious conflict for about a hundred years. For large samples the normal distribution could be used to find probability or confidence limits. For moderately large samples the so-called 3σ-limits became a standard procedure in estimation and testing as a safeguard against deviations from normality. During the following period the application of statistical methods was extended to the social and biological sciences in which variation among individuals, instead of errors, was studied by means of skew frequency curves, and the measurement error model was replaced by linear regression and correlation. Two systems of frequency curves were developed: Pearson’s system of skew frequency curves, and Kapteyn’s system of transformations to obtain normality. Correspondingly, a new method of estimation was developed which may be called the analogy-method. Pearson equated the empirical moments to the theoretical moments and thus got as many non-linear equations as parameters to be estimated. Kapteyn equated the empirical and theoretical percentiles. 1.5. The third revolution: R. A. Fisher 1912-1956 At the beginning of the present century the theory of statistical inference thus consisted of a large number of ad hoc methods, some of them contradictory, and the small-sample theory was only in a rudimentary state. Some important questions were as follows: How to choose between direct and inverse probability methods? How to choose between various loss functions? How to choose between various statistics for use in the analogy-method? How to find probability limits for the parameters from direct probability methods? These problems were attacked and most of them solved by Fisher between 1922 and 1936.
6 1.5. The third revolution: R. A. Fisher 1912-1956 He turned the estimation problem upside down by beginning with requirements to estimators. He formulated the criteria of consistency, efficiency, and sufficiency, the last concept being new. Having thus defined the properties of good estimators he turned to a criticism of the existing methods of estimation. He showed that the inverse probability estimate depends on the parameterization of the model, which means that the resulting estimate is arbitrary. For a time this argument led to less interest in inverse probability methods. He rejected the use of loss functions as extraneous to statistical inference. Turning to analogy-methods he showed that the method of moments in general is inefficient. Given the model and the observations, he noted that all information on the parameters is contained in the likelihood function, and he proved the asymptotic optimality of the estimates derived from this function, the maximum likelihood estimates. Basing his inference theory on the likelihood function he avoided the arbitrariness introduced by Laplace and Gauss due to loss functions and the assumption of finite variance. Assuming normality, he derived the t, χ2 , and F distributions, and showed how to use them in testing and interval estimation, thus solving the small-sample problems for the linear-normal model. He also derived the distribution of the correlation coefficient and the partial correlation coefficients in normal samples. He initiated the theory of ancillary statistics and conditional inference. Largesample probability limits for a parameter were found by what today is called a pivotal statistic. By an ingenious use of the pivotal argument, Fisher derived what he called fiducial limits for a parameter, for example by means of the t distribution. Fisher explained the new statistical ideas and techniques in an aggressive and persuasive language, which lead to acceptance of his theories within a rather short period of time, not alone among mathematical statisticians, but also among research workers in general. A large part of mathematical statistics since 1922 has consisted in an elaboration of Fisher’s ideas, both in theory and practice. Because of the fundamental relation between the posterior density and the likelihood function many of Fisher’s asymptotic results are identical to those of Laplace from a mathematical point of view, only a new interpretation is required. Fisher never acknowledged his debt to Laplace. The following diagram indicates how the ideas of Laplace, Gauss and Fisher have influenced statistical theory today.
7 1.5. The third revolution: R. A. Fisher 1912-1956
Figure 1
Part 1
BINOMIAL STATISTICAL INFERENCE The three pioneers: Bernoulli (1713), de Moivre (1733) and Bayes (1764)
CHAPTER 2
James Bernoulli’s law of large numbers for the binomial, 1713, and its generalization 2.1. Bernoulli’s law of large numbers for the binomial, 1713 James Bernoulli (1654-1705) graduated in theology from the University of Basel in 1676; at the same time he studied mathematics and astronomy. For the next seven years he spent most of his time travelling as tutor and scholar in Switzerland, France, the Netherlands, England, and Germany. Returning to Basel in 1683 he lectured on mathematics and experimental physics and in 1687 he became professor of mathematics at the University. He and his younger brother John made essential contributions to Leibniz’s new infinitesimal calculus. He left his great work on probability Ars Conjectandi (The Art of Conjecturing) unfinished; it was published in 1713. At the times of Bernoulli the doctrine of chances, as probability theory then was called, had as its main aim the calculation of a gambler’s expected gain in a game of chance. Because of the symmetry of such games, all possible outcomes were considered equally probable which led to the classical definition of probability as the ratio of the number of favourable cases to the total number of possible cases. Bernoulli’s great vision was to extend the doctrine of chances to a probability theory for treating uncertain events in “civil, moral and economic affairs”. He observes that in demography, meteorology, insurance, and so on it is impossible to use the classical definition, because such events depend on many causes that are hidden for us. He writes (1713, p. 224): “But indeed, another way is open to us here by which we may obtain what is sought; and what you cannot deduce a priori, you can at least deduce a posteriori — i.e. you will be able to make a deduction from the many observed outcomes of similar events. For it may be presumed that every single thing is able to happen and not to happen in as many cases as it was previously observed to have happened or not to have happened in like circumstances.” Bernoulli refers to the well-known empirical fact that the relative frequency of an event, calculated from observations taken under the same circumstances, becomes more and more stable with an increasing number of observations. Noting that the statistical model for such observations is the binomial distribution, Bernoulli asks the fundamental question: Does the relative frequency derived from the binomial have the same property as the empirical relative frequency? He proves that this is so and concludes that we may then extend the application of probability theory from 11
12 2.1. Bernoulli’s law of large numbers for the binomial, 1713 games of chance to other fields where stable relative frequencies exist. We shall give Bernoulli’s theorem and proof in modern formulation. Consider n independent trials each with probability p for “success”, today called Bernoulli trials. The number of successes, sn say, is binomially distributed (n, p), 0 < p < 1. Assuming that np and nε are positive integers, Bernoulli proves that the relative frequency hn = sn /n satisfies the relation Pn = P {|hn − p| ≤ ε} > c/(c + 1) for any c > 0,
(1)
if m(1 + ε) − q m(1 + ε) − p ∨ , (p + ε)ε (q + ε)ε where m is the smallest integer satisfying the inequality n ≥
m≥
log(c(q − ε)/ε) log(c(p − ε)/ε) ∨ . log((p + ε)/p) log((q + ε)/q)
(2)
(3)
Hence, for any fixed value of p and ε, however small, and for c tending to infinity, the lower bound for n tends to infinity and Pn tends to 1. This is the law of large numbers for binomially distributed variables; hn tends in probability to p. However, besides the limit theorem Bernoulli provides a lower bound for n. As an example he takes p = 0.6, ε = 0.02 and c = 1000 which leads to P (0.58 ≤ hn ≤ 0.62) > 1000/1001 for n ≥ 25, 550. In the proof Bernoulli sets sn − np = x, x = −np, −np + 1, . . . , nq,
(4)
and nε = k, k = 1, 2, . . . , so that Pn = P {|x| ≤ k}. The distribution of x is µ ¶ n f (x) = pnp+x q nq−x . np + x The inequality Pn > c/(c + 1) is replaced by the equivalent Pn /(1 − Pn ) > c, which means that the central part of the binomial should be larger than c times the sum of the tails. Disregarding f (0), it is thus sufficient to require that this inequality hold for each tail, that is, nq k X X f (x) ≥ c f (x) (5) l
k +1
for the right tail. The result for the left tail is obtained by interchanging p and q. Bernoulli investigates the properties of the binomial by means of the ratio f (x) np + x + 1 q = , x = 0, 1, . . . , nq − 1, f (x + 1) nq − x p
(6)
which is an increasing function of x. It follows that f (x) is decreasing for x ≥ 0 and that f (0)/f (k) < f (x)/f (x + k), x ≥ 1. (7)
13 2.2. Remarks on further developments Bernoulli uses the crude upper bound nq X
nq − k X f (x) ≤ f (x), k k+1 k+1
so that (5) is replaced by
k X 1
which by means of (7) leads to
2k
nq − k X f (x) ≥ c f (x), k k+1
(8)
2k
(9)
f (0) nq − k ≥c . (10) f (k) k Hence, the problem of evaluating the ratio of two sums has been reduced to the evaluation of the ratio of two binomial probabilities. From (6) it follows that k−i k+1−i f (k) Y = )/(1 − ). (1 + f (0) i=1 np nq k
(11)
The k factors are decreasing with i and lie between {1 + k/np)}/{1 − (k/nq)} and 1. To get a closer bound for f (0)/f (k), Bernoulli chooses n so large that there is an m for which f (0)/f (k) ≥ [1 + (k/np)]m 1k−m . The problem is thus reduced to solving the inequality [1 + (k/np)]m ≥ c(nq − k)/k
with respect to m, and solving the equation µ ¶µ ¶ k+1−m ε k−m 1+ ε= 1+ ε 1− kp p kq with respect to k = nε. The solution is given by (2) and (3). James Bernoulli’s ideas and his proof of the law of large numbers became a great inspiration for probabilists and statisticians for the next hundred years. 2.2. Remarks on further developments Bernoulli’s lower bound for n is rather large because of two crude approximations. First, he requires that the basic inequality holds for each tail separately instead of for the sum only, see (2.1.5). Second, he uses an arithmetic approximation for the tail probability instead of a geometric one, see (2.1.8). These defects were corrected by Chebyshev (1846) and Nicolas Bernoulli (1713), respectively. The law of large numbers may be considered as a corollary to Laplace’s central limit theorem, which holds for sums of random variables, discrete or continuous. It was generalized by Poisson (1837) to sums of random variables with different distributions P 2 so 2the sample mean xn is asymptotically normal with mean µn and V (xn ) = σi /n , which is supposed to be of order n−1 . Hence, p P {|xn − µ | < ε} ∼ (1) = Φ(u) − Φ(−u), u = ε/ V (xn ), n
14 2.2. Remarks on further developments which tends to 1 as n → ∞. As a special case Poisson considers a series of trials with varying probabilities of success, p1 , p2 , . . . , today called Poisson trials. It follows that the relative frequency P of successes in n trials, hn say, tends in probability to (p1 + · · · + pn )/n provided pi qi → ∞ as n → ∞, which is the case if the p’s are bounded away from 0 and 1. It is supposed that pn , the average of the p’s, tends to a constant. It was Poisson who introduced the name “the law of large numbers” for the fact that |xn − µn | converges in probability to zero. Chebyshev (1846) proves the law of large numbers for Poisson trials by a generalization of Bernoulli’s proof. He finds that Pn = P (|hn − µn | < ε) c/(c+1), setting each tail probability smaller than 1/[2(c + 1)]. For the right tail he finds "µ r ¸ ¶p+ε µ ¶q−ε # ∙ q−ε p+ε q(c + 1) p + ε , p = pn . ln (2) n > ln ε q−ε p q
/
The lower bound for the left tail is found by interchanging p and q. Chebyshev’s lower bound is approximately equally to 2pq times Bernoulli’s bound; for Bernoulli’s example, (2) gives n > 12, 243 compared with Bernoulli’s 25, 550. Independently, Bienaymé (1853) and Chebyshev (1867) prove the law of large numbers without recourse to the central limit theorem. For the random variable x with mean µ and standard deviation σ, 0 < σ < ∞, they prove the inequality Hence,
P {|x − µ| ≤ tσ} ≥ 1 − t−2 , for any t > 0.
(3)
p (4) P (|xn − µn |) ≤ t V (xn ) ≥ 1 − t−2 , from which the law of large numbers immediately follows. Khintchine (1929) proves that xn tends in probability to µ if the x’s are independently and identically distributed with finite expectation µ. Hence, in this case the law of large numbers holds even if the variance does not exist.
CHAPTER 3
De Moivre’s normal approximation to the binomial, 1733, and its generalization 3.1. De Moivre’s normal approximation to the binomial, 1733 Abraham de Moivre (1667-1754) was of a French Protestant family; from 1684 he studied mathematics at Paris. The persecution of the French Protestants caused him at the age of 21 to seek asylum in England. For the rest of his life he lived in London, earning his livelihood as a private tutor of mathematics and later also as a consultant to gamblers and insurance brokers. He became a prominent mathematician and a Fellow of the Royal Society in 1697, but he never got a university appointment as he had hoped. He wrote three outstanding books: Miscellanea Analytica (1730) containing papers on mathematics and probability theory, The Doctrine of Chances: or, A Method of Calculating the Probability of Events in Play (1718, 1738, 1756), and Annuities upon Lives (1725, 1743, 1750, 1752), each new edition being an enlarged version of the previous one. His Doctrine contained new solutions to old problems and an astounding number of new results; it was the best textbook on probability theory until Laplace (1812). Here we shall only discuss his two proofs of Bernoulli’s law of large numbers and his two approximations to the binomial. De Moivre (1730; 1738, Problem 87) considers a game with probability p of success in which a spectator gains |sn − np| if the outcome is sn successes in n trials, np being an integer. By means of (2.1.6) he proves that the expected gain equals Dn = E (|sn − np|) = 2npq
µ
n np
¶
pnp qnq '
p 2npq/π,
a quantity known today as the mean deviation of the binomial. The limit is obtained by means of his (1733) normal approximation to b(np, n, p). The average gain per trial is p Dn /n = E(|hn − p| ) ' 2pq/πn. (1)
De Moivre then gives another interpretation of this result, namely as a measure of the dispersion of the random variable hn around the true value p. This is the first time that such a measure is defined and discussed. Since Dn /n is a decreasing function of n, de Moivre concludes that hn converges in probability to p. However, he does not explain how the relation P (|hn − p| ≤ ε) → 1 follows from (1). [By a similar argument as that leading to the Bienaymé-Chebyshev inequality we have Pn > 1 − (Dn /nε). De Moivre adds that a more precise proof of Bernoulli’s limit theorem will be given by means of his normal approximation to the binomial. 15
16 3.1. De Moivre’s normal approximation, 1733 Like the Bernoullis, de Moivre wanted an approximation to the sum np+d
Pn (d) = P (|x − np| ≤ d) =
X
b(x, n, p), d = 1, 2, . . .
np−d
for large n, but unlike them he began by approximating b(x, n, p). Between 1721 and 1730 he worked hard on this problem and succeeded in deriving an asymptotic expansion for b(x, n, p) as n → ∞, his proofs are given in the Miscellanea Analytica (1730). He uses the same method of proof in his various attempts, we shall illustrate this method by giving his proof of Stirling’s formula for m!, which he (1730) derived independently of Stirling (1730). Taking the logarithm of ¶−1 m−1 Yµ mm−1 i 1− , m = 2, 3 . . . , = (m − 1)! m i=1 he gets
m−1 ∞ X 1 X k mm−1 i = ln (m − 1)! k=1 kmk i=1
(2)
∞ X √ B2k 1 m1−2k , = m − ln m − ln 2π − 2 (2k − 1)(2k) k=1 P where Bernoulli’s√summation formula has been used for ik , {B2k } are the Bernoulli numbers, and ln 2π is introduced by means of the relation ∞ X √ B2k /(2k − 1)(2k), (3) ln 2π = 1 − k=1
which is due to Stirling. Solving for ln(m − 1)! and adding ln m de Moivre gets ∞ X √ B2k 1 m1−2k , (4) ln m! ∼(m + ) ln m − m + ln 2π + 2 (2k − 1)(2k) k=1
and
µ ¶ √ 1 1 m m! ∼ 2πm m exp −m + − + ... , (5) 12m 360m3 which today is called Stirling’s formula. The Bernoullis had shown that the evaluation of Pn /(1 − Pn ) depends essentially on f (0)/f (d) and f (0)/f (−d). De Moivre begins by studying the symmetric binomial, thus avoiding the complications due to the skewness. He notes that the properties of b(x, n, p) for n → ∞ follow easily from the properties of b(x, n, 12 ) because 1 b(n, x, p) = b(n, x, )(2p)x (2q)n−x . (6) 2 Let b(m + d) denote the symmetric binomial for n = 2m, that is µ ¶ 2m b(m + d) = 2−m , |d| = 0, 1, . . . , m, m = 1, 2, . . . , m+d
17 3.1. De Moivre’s normal approximation, 1733 so that b(m)/b(m + d) corresponds to f (0)/f (d). It follows that ln b(m) = (−2m + 1) ln 2 +
m−1 X
ln
i=1
1 + i/m 1 − i/m
(7)
1 1 = (2m − ) ln(2m − 1) − 2m ln(2m) + ln 2 − ln(2π) + 1 + . . . , 2 2 and X 1 + i/m b(m) = ln(1 + d/m) + ln ln b(m + d) 1 − i/m i=1 d−1
(8)
1 = (m − d − ) ln(m − d − 1) 2 1 + (m − d + ) ln(m − d + 1) − 2m lnm + ln(1 + d/m) + . . . 2 The two series are obtained by expanding the logarithm of the individual terms in powers of i/m and using Bernoulli’s formula for the summation of integers, just as in (2). The following terms are of the order m−k and (m ± d)−k , k = 1, 2, . . . , respectively, for d = o(m) and m → ∞. De Moivre (1730) writes that he obtained the main terms in 1721 with the modification that he had determined the constant term in (7) to 0.7739 instead of the correct value 0.7742 because he at the time did not know (3). Combining the two series he gets an approximation to the symmetric binomial from which the skew binomial is found by means of (6). For large n the main term is 1
nn+ 2 b(x, n, p) ∼ √ px qn−x , x = np + d, d = o(n), x− 12 n−x+ 12 2πx(x − 1) (n − x + 1)
(9)
which is easy to calculate. However, he did not succeed in getting a simple expression for Pn (d) by means of this formula. It will be seen from ¡n¢(9) that the main results of de Moivre’s analysis in 1721 is an approximation to x . It was not until 1730 that he found an approximation to n! Finally he (1733) realized that he had to sacrifice the asymptotic expansions, in which he had invested so much labour, and be content with an approximation to the main term to get an expression that could be evaluated by summation (integration). Using the series expansion of ln (1 ± x) on the terms of (8) he gets lim ln
m→∞
√ d2 b(m + d) = − , d = O( m), b(m) m
so 1
b(m + d) ∼ (πm)− 2 exp(−d2 /m).
(10)
He then obtains the desired result by approximating the sum of b(m + d) by the corresponding integral. Without proof he states the general formula √ 1 b(np + d, n, p) ∼ (2πnpq)− 2 exp(−d2 /2npq), d = O( n). (11)
18 3.1. De Moivre’s normal approximation, 1733 The proof is simple. Stirling’s formula gives immediately 1
f (0) = b(np, n, p) ∼ (2πnpq)− 2 . Using that
and
d−1 Y f (0) 1 + i/np b(np) = = (1 + d/np) , f (d) b(np + d) 1 − i/nq i=1
ln it follows that ln
i 1 + i/np = + ..., 1 − i/nq npq
d2 b(np) = + ..., b(np + d) 2npq
which completes the proof. De Moivre’s result may be written as √ √ npq b(x, n, p) ∼ φ(u), u = (x − np)/ npq = O(1),
(12)
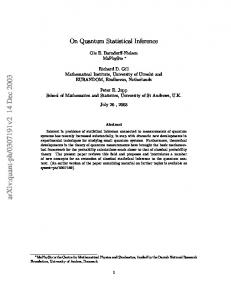
which shows that the limit distribution of the standardized variable u for n → ∞ is the same for all binomial distributions regardless of the value of p, if only p is bounded away from 0 and 1. This is the first appearance of the normal distribution in statistics. The problem is, however, under what conditions this property holds for finite values of n. It is no wonder that the logarithm of the symmetric binomial can be accurately approximated by a parabola for small values of n; this is illustrated by de Moivre by two examples for n = 900. It is also clear that this is not so for the skew binomial and one may wonder why de Moivre did not develop a correction for skewness by including one more term in his expansion. The explanation is that de Moivre was looking for an approximation to Pn (d) wherefore he was interested only in b(np − d, n, p) + b(np + d, n, p) for which the positive and negative errors of the two components to a large extent compensate each other, see Figure 1. Replacing the sum of b(x, n, p) by the corresponding integral based on (12) de Moivre concludes that Z d/√npq √ ∼ Pn (d) = (P |u| ≤ d/ npq) = 2 φ(u)du, d > 0 (13) 0
or
Pn (d) ∼ = φ(t) − φ(−t),
√ t = d/ npq.
(14)
He shows how to calculate P (|u| ≤ t) by a series expansion for t ≤ 1 and by numerical integration for t > 1 and carries out the calculation for t = 1, 2, 3. For the symmetric case he writes that (13) for n > 100 is “tolerably accurate, which I have confirmed by trials.” √ De Moivre presents examples of intervals for s n and hn of the form np ± t npq p and p ± t pq/n, respectively, corresponding to the probabilities (14) for t = 1, 2, 3.
19 3.2. Lagrange’s multivariate approximation, 1776
Figure 1. The binomial distribution for n = 100 and p = 0.1 and de Moivre’s normal approximation with mean 10 and standard deviation 3. From the relation
p P (|hn − p| ≤ ε) ∼ P (|u| ≤ ε n/pq) → 1, as n → ∞
(15)
de Moivre concludes that hn tends in probability to p. The mathematical and numerical simplicity of de Moivre’s limit theorem makes it one of the great advances in probability theory. 3.2. Lagrange’s multivariate normal approximation to the multinomial and his confidence interval for the binomial parameter, 1776 The great French mathematician Joseph Louis Lagrange (1736-1813) generalizes de Moivre’s result from the binomial to the multinomial distribution. Lagrange (1776) considers an error distribution with x1 , . . . , xk , Pk possible measurement errors, P occurring with probabilities p1 , . . . , pk , pi = 1, so that E(x) = xi pi = µ, say. He wants to estimate µ for calibrating the measuring instrument. P Let ni be the number of times the error xi occurs among n observations, ni = n, so that the sample mean is X X xn = xi hi , hi = ni /n, hi = 1. The probability of the observed outcome is the multinomial
n! pn1 1 . . . pnk k , n1 ! . . . nk ! which Lagrange considers as a function of the p’s. Maximizing f with respect to the p’s, he finds that hi is “the most probable” value of pi , today we would say “most likely”, and that f0 = max f = f (n1 , . . . , nk ; h1 , . . . , hk ). f (n1 , . . . , nk ; p1 , . . . , pk ) =
p1 ,...,pk
Setting pi = hi + di /n,
X
di = 0,
20 3.2. Lagrange’s multivariate approximation, 1776 he gets
¶n k µ Y di i 1+ . f = f0 ni i=1 √ √ Assuming that di = O( n) and setting di = δ i n he finds X 1 di 1 X δ2i ni ln(1 + ) = − + O(n− 2 ). ni 2 hi Approximating the factorials by means of Stirling’s formula, he obtains the largesample approximation n(k−1)/2 f (n1 , . . . , nk ; p1 , . . . , pk )
(1) ¶ µ 1 1 X δ 2i , k = 2, 3 . . . , exp − = p(δ 1 , . . . , δ k ) ∼ = 1 2 hi (2π)(k−1)/2 (h1 · · · hk ) 2 P which is a (k − 1) dimensional normal distribution since δ i = 0. Lagrange remarks that it is difficult to find the probability that |δ i | < ρ for all i if k > 2. For k = 2 it follows from (1) that δ 1 is asymptotically normal [0, h1 (1−h1 )] so that p1 satisfies the inequality p p h1 − t h1 (1 − h1 )/n < p1 < h1 + t h1 (1 − h1 )/n, t > 0, (2) with probability
´ ³ p P |δ 1 | < t h1 (1 − h1 ) ∼ = Φ(t) − Φ( − t).
(3)
This result seems to be the first example of a non-Bayesian probability statement about a parameter. To compare the results of de Moivre and Lagrange let us write de Moivre’s relation between h and p as p h = p + u p(1 − p)/n + o(n−1/2 ), (4) where u is asymptotically normal (0,1). Solving for p we get Lagrange’s relation p (5) p = h − u h(1 − h)/n + o(n−1/2 ). Hence,
and solving the equation
√ p u = (h − p) n/ h(1 − h) P (|u| < t) = Φ(t) − Φ(−t)
(6)
with respect to p, we get (2) and (3). This mode of reasoning is a special case of Fisher’s (1930a) fiducial probability, which Fisher (1956; p. 51) later recognized as being “entirely identical” with the classical probability concept. Lagrange’s probability interval is today called a confidence interval, it is based on the distribution of the pivot (6), which involves the sufficient statistic h only and varies monotonically with the parameter. The random variable is h, but the pivotal argument allows us to speak of the parameter p as if it were a random variable.
21 3.3. De Morgan’s continuity correction, 1838 Returning to the case k > 2, Lagrange succeeds in finding a lower bound, M say, for the probability that |δi | < ρ for all i, and he concludes that µ ¶ ρ ρ P hi − √ < pi < hi + √ , for all i > M(ρ, k, h1 , . . . , hk ), (7) n n M being independent of n. It follows that hi − pi tends in probability to zero for all i. Lagrange stops here without reverting to his original problem about the mean. However, using the fact that ¯ X ¯ √ ¯ ¯X ¯ ¯(µ − xn ) n¯ = ¯¯ |xi ||δ i | xi δ i ¯ ≤ X ≤ρ |xi |, if |δ i | ≤ ρ for all i,
it follows form (7) that xn − µ converges in probability to zero. The method of statistical inference implied by Lagrange’s procedure was overlooked by his contemporaries, perhaps because Laplace (1774) independently had proposed to solve the inferential problem by the method of inverse probability. Formula (1) gives an approximation to the likelihood function. However, setting hi = pi + di /n, the same method of proof gives an approximation to the sampling distribution, which is obtained by replacing the h’s in (1) by the corresponding p’s, as shown above for k = 2. This is the generalization of de Moivre’s result. When K. Pearson in the 1920s lectured on the history of statistics, he (1978, pp. 596-603) discovered Lagrange’s result and remarked that it was the basis for his (1900) χ2 goodness of fit test. 3.3. De Morgan’s continuity correction, 1838 Augustus de Morgan (1806-1871) improves de Moivre’s approximation by introduction a “continuity correction” (1838, p. 77) based on the idea that each binomial probability should be interpreted as an area with unit base, which means that d in (3.1.13) and (3.1.14) should be replaced by d + 1. J. V. Uspensky (1883-1946) writes (1937, p. 119): “When we use an approximate formula instead of an exact one, there is always this question to consider: How large is the committed error? If, as is usually done, this question is left unanswered, the derivation of Laplace’s formula [de Moivre’s approximation supplemented by a term for the skewness] becomes an easy matter. However, to estimate the error comparatively long and detailed investigation is required.” He provides such an investigation, taking the continuity correction into account, and finds an upper limit for the absolute value of the error, which is of the order of n−1 , provided npq ≥ 25, see (1937, p. 129).
CHAPTER 4
Bayes’s posterior distribution of the binomial parameter and his rule for inductive inference, 1764 4.1. The posterior distribution of the binomial parameter, 1764 The English physician and philosopher David Hartley (1705-1757), founder of the Associationist school of psychologists, discusses some elementary applications of probability theory in his Observations on Man (1749). On the limit theorems he (pp. 338-339) writes: “Mr. de Moivre has shown, that where the Causes of the Happening of an Event bear a fixed Ratio to those of its Failure, the Happenings must bear nearly the same Ratio to the Failures, if the Number of Trials be sufficient; and that the last Ratio approaches to the first indefinitely, as the number of Trials increases. This may be considered as an elegant Method of accounting for that Order and Proportion, which we every-where see in the Phænomena of Nature.” [. . . ] “An ingenious Friend has communicated to me a Solution of the inverse Problem, in which he has shewn what the Expectation is, when an event has happened p times, and failed q times, that the original Ratio of the Causes for the Happening or Failing of an Event should deviate in any given Degree from that of p to q. And it appears from this Solution, that where the Number of Trials is very great, the Deviation must be inconsiderable: Which shews that we may hope to determine the Proportions, and, by degrees, the whole Nature, of unknown Causes, by a sufficient Observation of their Effects.” This is a surprisingly clear statement of the law of large numbers for binomially distributed observations, based on direct and inverse probability, respectively. We believe, like most other commentators, that the ingenious friend was Bayes, who was the first to consider the probability of success, p say, as a uniformly distributed continuous random variable, so the statement above means that p converges in (posterior) probability to the observed relative frequency as the number of observations tends to infinity. De Moivre, Bayes, and Hartley were all Fellows of the Royal Society so Hartley had first-hand access to both direct and inverse probability. Hartley’s formulation is remarkable also in two other respects. First, he uses the term “inverse problem” for the problem of finding probability limits for p. Second, he uses the terms from the ongoing philosophical discussions on the relation between cause and effect. De Moivre writes about design and chance, that is, the physical properties of the game and the probability distribution of the outcomes, he does 23
24 4.1. Bayes’s posterior distribution, 1764 not use the terms cause and effect. However, Hartley’s terminology was accepted by many probabilists, who created a “probability of causes”, also called inverse probability until about 1950 when Bayesian theory became the standard term. To prevent misunderstandings of Hartley’s unfortunate terminology de Morgan (1838, p. 53) explains: “By a cause, is to be understood simply a state of things antecedent to the happening of an event, without the introduction of any notion of agency, physical or moral.” Thomas Bayes (c.1701-1761) was the son of a Presbyterian minister. He studied theology at Edinburgh University and afterwards became his father’s assistant in London. In 1731 he became Presbyterian minister in Tunbridge Wells, southeast of London. He was unmarried, and after having inherited from his father in 1746, he became a wealthy man. He retired from the ministry in 1752, but kept living in Tunbridge Wells until his death. He seems to have led a quiet life, mainly occupied with his scholarly interests, beginning with theology, moving to mathematics and the natural sciences, and ending with statistical inference. He was elected a Fellow of the Royal Society in 1742. When Bayes died in 1761 his relatives asked Richard Price (1723-1791), another Presbyterian minister, to examine the mathematical papers left by Bayes. Price found a paper on Stirling’s formula and the paper “An Essay towards solving a Problem in the Doctrine of Chances”, which he got published in two parts in the Phil. Trans. (1764, 1765) with introductory letters, comments and extensions by himself. Bayes’s mathematics is correct, but his verbal comments are obscure and have caused much discussion, which recently has led to a new interpretation of his criterion for the application of his rule for inductive inference. De Moivre had defined the expectation E of a game or a contract as the value V of the sum expected times the probability P of obtaining it, so P = E/V . Bayes chooses the value of an expectation as his primitive concept and defines probability as E/V . This is a generalization of the classical concept because an expectation may be evaluated objectively or subjectively. He then shows how the usual rules of probability calculus can be derived from this concept. De Moivre had proved that P (AB) = P (A)P (B|A) = P (B)P (A|B),
(1)
noting that the probability of the happening of both events equals the probability of the happening of one of them times the probability of the other, given that the first has happened. Bayes considers the two events as ordered in time and proves that for two “subsequent events”, A occurring before B, we have P (A|B) = P (AB)/P (B), P (B) > 0.
(2)
Bayes envisages a two-stage game of chance. At the first stage a real number p is chosen at random in the unit interval, and at the second stage n binomial trials are carried out with p as the probability of success. He describes how this game may be carried out by throwing balls at random on a rectangular table.
25 4.2. Bayes’s rule for inductive inference, 1764 Denoting the probability of success in a single trial by P (S) = p, the probability of a successes in n independent trials is µ ¶ n P (Sn = a| p) = pa qb , a + b = n, q = 1 − p, a = 0, 1, . . . , n. a By means of (1), Bayes gets the joint distribution of p and Sn Z p2 µ ¶ n pa qb dp, 0 ≤ p1 < p2 ≤ 1. P [(p1 < p < p2 ) and (Sn = a)] = a p1
(3)
Integration from 0 to 1 gives the marginal distribution of Sn P (Sn = a) = 1/(n + 1), a = 0, 1, . . . , n. Using (2) he gets the conditional distribution of p for given Sn Z (n + 1)! p2 a b P (p1 < p < p2 |Sn = a) = p q dp, p = P (S), a!b! p1
(4)
(5)
which is his final result, a distribution today called the beta distribution. Bayes remarks that the solution is uncontroversial under the conditions stated. He has thus shown that probabilistic induction is possible for the physical experiment in question; all the probabilities involved have a frequency interpretation. 4.2. Bayes’s rule for inductive inference, 1764 In a scholium Bayes (1764, pp. 392-394) then asks whether “the same rule [our (4.1.5)] is the proper one to be used in the case of an event concerning the probability of which we absolutely know nothing antecedently to any trials made concerning it.” He calls such an event an “unknown event” and formulates the problem as follows: “Given the number of times in which an unknown event has happened and failed: Required the chance that the probability of its happening in a single trial lies somewhere between any two degrees of probability that can be named.” Let us denote the unknown event by U and let Un be the number of times U happens in n independent trials under the same circumstances. Hence, U corresponds to S and Un to Sn , but S is not an unknown event because we know that P (S) is uniformly distributed on [0,1]. That (4.1.5) is the proper rule to be used for finding limits for P (U) seems, according to Bayes, to appear from the following consideration: “that concerning such an event I have no reason to think that, in a certain number of trials, it should rather happen any one possible number of times than another.” The statistical community has for nearly 200 years interpreted Bayes’s postulate of ignorance as relating to the uniform distribution of P (U). However, a closer reading of the quotation above has recently led to the result that Bayes refers to the uniform distribution of Un . Note that P (U) is unobservable and that we have only one observation of Un so it is impossible to test the hypothesis about P (Un ). For a survey of this discussion we refer to Stigler (1986a, pp. 122-130).
26 4.2. Bayes’s rule for inductive inference, 1764 Bayes’s rule for inductive inference from n binomial trials may be summarized as follows: If we have no reason to think that Un is not uniformly distributed on (0, 1, . . . , n), then limits for P (U) may be calculated from the formula Z (n + 1)! p2 a n−a p q dp, 0 ≤ p1 < p2 ≤ 1, (1) P (p1 < P (U) < p2 |Un = a) = a!b! p1
which depends on the supposition that P (U ) is uniformly distributed on [0, 1]. Thus ends the inferential part of Bayes’s paper. He does not discuss where to find unknown events in nature, his paper contains no philosophy of science, no examples and no data. Price (1764) attempts to remedy this defect in his commentary. As examples he discusses the drawings from a lottery and the probability of a sunrise to morrow. Recognizing that Bayes’s criterion of ignorance cannot be applied to himself regarding sunrises he invents “a person just brought forward into this world, knowing nothing at all about this phenomena.” He (p. 410) concludes that “It should be carefully remembered that these deductions [about P (U )] suppose a previous total ignorance of nature.” This implies that in the natural sciences “unknown events” are the exception rather than the rule. Usually we know something about the probability of a phenomenon under investigation and Bayes’s rule is therefore seldom applicable. On this background it is no wonder that the Essay did not evoke any response from British mathematicians and natural scientists. In the second part of the Essay (1765) Bayes and Price derives an excellent approximation to the beta probability integral with limits of integration symmetric about the mode. Bayes’s idea is to approximate the skew beta density with parameters (a, b) by the corresponding symmetric density with parameter (a + b)/2 and to introduce a measure of skewness on which the accuracy of the approximation depends. He obtains an asymptotic expansion, which is improved by Price. Finally, Price considers the expansion for a+b → ∞ and obtains a series which is the expansion of the normal probability integral, but he does not recognize it as such. Also this part of the Essay was overlooked. For the details of the proofs we refer to Hald (1990).
Part 2
STATISTICAL INFERENCE BY INVERSE PROBABILITY. Inverse probability from Laplace (1774), and Gauss (1809) to Edgeworth (1909)
CHAPTER 5
Laplace’s theory of inverse probability, 1774-1786 5.1. Biography of Laplace Pierre Simon Laplace (1749-1827) was born into a middle-class family at a small town in Normandy, where he spent his first 16 years. His father destined him for an ecclesiastical career and sent him to the University of Caen, where he matriculated in the Faculty of Arts with the intention to continue in the Faculty of Theology. However, after two years of study he left for Paris in 1768 bringing along a letter of recommendation from his mathematics teacher to d’Alembert. After having tested his abilities d’Alembert secured him a post as teacher of mathematics at the École Militaire. He lived in Paris for the rest of his life. Between 1770 and 1774 Laplace produced an exceptionally large number of important papers on mathematics, astronomy and probability. In 1773, at the age of 24, he was elected an adjunct member of the Paris Academy of Sciences; he became a full member in 1785 and continued to be among the leading members of the Academy, of the succeeding Institut de France from 1795, and of the restored Academy from 1816. He carried out his scientific work during the old regime, the revolution, the Napoleonic era, and the restoration. He became a professor of mathematics at the École Normale and the École Polytechnique, a member of many government commissions, among them the commission on weight and measures, and a member of the Bureau des Longitudes. Bonaparte made Laplace (an unsuccessful) Minister of the Interior for a period of six weeks and then a member of the Senate of which he later became Chancelor. After the restoration Louis XVIII created him a peer of France as a Marquis. The various regimes used his reputation as an illustrious scientist to their own advantage, and Laplace used his influence to provide economic support for his research projects, for example, the Bureau des Longitudes, and for his scientific protégés. His adaptation to the various political systems has later been criticized. Most of Laplace’s contributions to mathematics were motivated by problems in the natural sciences and probability. To mention a few examples: celestial mechanics led him to study differential equations; problems in probability theory led him to difference equations, generating functions, Laplace transforms, characteristic functions and asymptotic expansion of integrals. In the early period of probability theory problems were usually solved by combinatorial methods. Lagrange and Laplace formulated the old problems as difference equations and developed methods for their solution, see Hald (1990, pp. 437-464). This is the reason why Laplace speaks of the analytical theory of probability in contradistinction to the combinatorial. 29
30 5.2. Laplace’s theory of inverse probability, 1774 Besides his main interests in astronomy and probability, Laplace worked in physics and chemistry. He collaborated with Lavoisier about 1780 and with the chemist Berthollet from 1806. They were neighbours in Arcueil, where they created “The Society of Arcueil” as a meeting place for young scientists working in mathematics, physics and chemistry, see Crosland (1967). In 1796 Laplace published the Exposition du Systéme du Monde, a popular introduction to his later monumental work Traité de Méchanique Céleste in four volumes (1799-1805). A fifth volume was published in 1825. After having completed his astronomical work in 1805, he resumed work on probability and statistics and published the Théorie Analytique des Probabilités (TAP) in 1812, the most influential book on probability and statistics ever written. In 1814 he added the Essai Philosophique sur les Probabilités as a popular introduction to the second edition of the TAP. The Essay was also published separately and he kept on revising and enlarging it until the sixth edition. A third edition of the TAP, including important Supplements, appeared in 1820, and a fourth Supplement was added in 1825. Among Laplace’s numerous contributions to probability theory and statistics there are three outstanding ones: (1) A theory of statistical inference and prediction based on inverse probability (1774), (2) the asymptotic normality of posterior distributions (1785), which may be called the central limit theorem for inverse probability, and (3) the asymptotic normality of the sampling distribution for sums of independent and identically distributed random variables (1810, 1812), the central limit theorem for direct probability. He thus created a large-sample theory for both modes of probability. Stigler (1986b) has translated Laplace’s revolutionary paper “Memoir on the probability of causes of event” (1774) into English with an Introduction that ends as follows: “The influence of this memoir was immense. It was from here that “Bayesian” ideas first spread through the mathematical world, as Bayes’s own article (Bayes 1764), was ignored until after 1780 and played no important role in scientific debate until the twentieth century (Stigler, 1982). It was also this article of Laplace’s that introduced the mathematical techniques for the asymptotic analysis of posterior distributions that are still employed today. And it was here that the earliest example of optimum estimation can be found, the derivation and characterization of an estimator that minimized a particular measure of posterior expected loss. After more than two centuries, we mathematical statisticians cannot only recognize our roots in this masterpiece of our science, we can still learn from it.” 5.2. The principle of inverse probability and the symmetry of direct and inverse probability, 1774 In the “Memoir on the probability of causes of events” Laplace (1774) begins by discussing direct and inverse probability by means of the urn model. He distinguishes between chance events, the outcome of drawings from an urn, and causes of events, the ratio of white to black tickets in the urn. If the cause is known and the event is unknown then the (direct) probability of the event can be found either by means
31 5.2. Laplace’s theory of inverse probability, 1774 of classical combinatorial methods or by Laplace’s analytical methods. If the event is known and the cause is unknown then a new principle for finding the probability of the cause is needed. Laplace formulates the principle of inverse probability as follows: “If an event can be produced by a number n of different causes, the probabilities of the existence of theses causes given the event are to each other as the probabilities of the event given the causes, and the probability of the existence of each of them is equal to the probability of the event given that cause divided by the sum of all the probabilities of the event given each of the causes.” Laplace does not offer any reason for this principle, obviously he considers it intuitively reasonable. Denoting the n mutually exclusive and exhaustive causes by C1 , . . . , Cn and the event by E and using the modern notation for conditional probability Laplace thus considers the following scheme: Causes (n urns) C1 , . . . , Cn Direct probability P (E|C1 ), . . . , P (E|Cn ) Inverse probability P (C1 |E), . . . , P (Cn |E) Direct probability corresponds to probabilistic deduction and inverse probability to probabilistic induction. It is a remarkable fact that Laplace considers conditional probabilities only. His principle amounts to the symmetry relation P (Ci |E) ∝ P (E|Ci ), i = 1, . . . , n,
which is the form he ordinarily uses. His intuitive reasoning may have been as follows: If the probability of the observed event for a given cause is large relative to the other probabilities then it is relatively more likely that the event has been produced by this cause than by any other cause. Applying the principle to parametric statistical models he uses the symmetry relation for the frequency functions in the form p(θ|x) ∝ f (x|θ), x = (x1 , . . . , xn ), θ = (θ1 , . . . , θ m ),
(1)
that is, the posterior density of θ for given x is proportional to the density of x for given θ. In 1774 Bayes’s (1764) paper was not known among French probabilists. However, by 1781 Laplace knew Bayes’s paper and this may have induced him to derive his principle from a two-stage model with equal probabilities for the causes. In 1786 he points out that the theory of inverse probability is based on the relation P (Ci |E) = P (Ci E)/P (E),
and assuming that P (Ci ) = 1/n, i = 1, . . . , n, he finds P (E|Ci ) P (Ci |E) = P P (E|Ci ),
in agreement with his 1774 principle.
(2)
32 5.2. Laplace’s theory of inverse probability, 1774 It is thus clear that at least from 1786 on Laplace’s principle had two interpretations: A frequency interpretation based on a two-stage model with objective probabilities, and an interpretation based on the principle of insufficient reason, also called the principle of indifference. This distinction is clearly explained by Cournot (1843, Chapter 8), who notes that the first interpretation is unambiguous and uncontestable, whereas the second is subjective and arbitrary. The proof above is reproduced in the first edition of the TAP (1812, II, § 1). In the second edition (1814, II, § 1) Laplace introduces a nonuniform distribution of causes, and replacing 1/n by P (Ci ) in (2) he obtains P (Ci )P (E|Ci ) P (Ci |E) = P , P (Ci )P (E|Ci )
i = 1, . . . , n,
(3)
which today is called Bayes’s formula. Laplace had previously discussed cases of non-uniform priors for parametric models in the form p(θ|x) ∝ f (x|θ)w(θ) (4)
where w(θ) denotes the prior distribution. He remarks that if causes are not equally probable then they should be made so by subdividing the more probable ones, just as events having unequal probabilities may be perceived of as unions of events with equal probabilities. This is easily understood for a finite number of urns with rational prior probabilities. In the continuous case Laplace (1786, § 35) uses this idea only in the trivial form Z θ2 P (θ1 < θ < θ2 |x) = g(x|θ)dθ, g(x|θ) = p(x|θ)w(θ), θ1
expressing the asymptotic expansion of the integral in terms of the maximum value of g(x|θ) and the derivatives of ln g(x|θ) at this value. In the theory of inverse probability it became customary tacitly to assume that causes, hypotheses, or parameters are uniformly distributed, unless it is known that this is not so. In the specification of the statistical model (1) it is tacitly understood that x and θ belong to well-defined spaces, the sample space and the parameter space, respectively. Since p(θ|x) is a probability distribution it follows from (3) and (4) that Z (5) p(θ|x) = f (x|θ)w(θ)/ f (x|θ)w(θ)dθ.
The revolutionary step taken by Laplace in 1774 is to consider scientific hypotheses and unknown parameters as random variables and a par with observations. As noted by Cournot and many others there is no empirical evidence for this supposition, nature does not select parameters at random. A note on inverse probability and mathematical likelihood. In (1) the random variable x is observable and f (x|θ) has a frequency interpretation for a given value of the parameter θ, which is an unknown constant. Hence, all information on θ is contained in the observed value of x and the statistical model f (x|θ) that links the two together. The inference problem is to find limits for θ. At the times of Laplace
33 5.3. Posterior consistency and asymptotic normality, 1774 the only numerical measure of uncertainty was probability, so even though Laplace considered θ as an unknown constant, he had in some way to introduce a probability distribution for θ. He chose the simplest possible solution to this mathematical problem by introducing a fictitious random variable, uniformly distributed on the parameter space, and linking it to f (x|θ) by means of the relation (1). This is an ingenious mathematical device to reach his goal. It is clear that the mathematical properties of f (x|θ) as a function of θ carries over to p(θ|x), for example the posterior mode ˆθ equals the value of θ maximizing f (x|θ), today called the maximum likelihood estimate. To clear up the confusion connected with the interpretation of (1) Fisher (1921) proposed to call any function of θ, proportional to f (x|θ) the likelihood function, the constant of proportionality being arbitrary. Hence, L(θ) = L(θ|x) ∝ f (x|θ)
(6)
is not a probability distribution, there is no normalizing constant involved as in (5). 5.3. Posterior consistency and asymptotic normality in the binomial case, 1774 Bernoulli had proved that h = x/n, where x is binomial (n, θ), converges in (direct) probability to θ, so to justify the principle of inverse probability, Laplace (1774) naturally wanted to prove that θ converges in (inverse) probability to h. By means of (1), Laplace gets the posterior distribution 1 p(θ|n, h) = θx (1 − θ)n−x , (1) B(x + 1, n − x + 1) for x = 0, 1, . . . , n, 0 ≤ θ ≤ 1, which is the beta distribution with parameters (x + 1, n − x + 1). He then proposes to show that Pn = P (|θ − h| < ε|n, h) → 1, as n → ∞,
where ε “can be supposed less than any given quantity”. Setting ε = n−δ , 1/3 < δ < 1/2, he proves that Z Pn =
h+ε
h−ε
p p p(θ|n, h)dθ ∼ Φ[ε n/h(1 − h)] − Φ[ − ε n/h(1 − h)],
(2)
√ which tends to 1 because ε n → ∞. The proof is the first instance of Laplace’s method of asymptotic expansion of definite integrals. By means of Taylor’s formula he expands the logarithm of the integrand into a power series around it mode, which in the present case is h. For θ = h + t he finds 1 1 ln p(θ|n, h) = ln p(h|n, h) − nt2 (h−1 + k−1 ) + nt3 (h−2 + k−2 ) − . . . , k = 1 − h. (3) 2 3 He evaluates the constant term by means of Stirling’s formula which gives p p(h|n, h) ∼ n/2πhk. (4)
34 5.3. Posterior consistency and asymptotic normality, 1774 He remarks that |t| < ε in the evaluation of (2) which means that terms of order 3 or more are negligible in (3). Hence, √ Z ε n exp(−nt2 /2hk)dt, (5) Pn ∼ √ 2πhk −ε which leads to (2). He completes this result by giving the first proof of the fact that the integral of the normal density function equals 1. His proof is somewhat artificial and he later (1781, Art. 23) gave a simpler proof by evaluating the double integral Z ∞Z ∞ Z ∞ 1 2 exp[−s(1 + x )]dsdx = (1 + x2 )−1 dx = π, 2 0 0 0 and using the transformations s = u2 and sx2 = t2 to show that the integral equals Z ∞ Z ∞ 2 2 exp(−u )du exp(−t2 )dt. 0
0
Finally, he evaluates the tail probability of p(θ|n, h) to get a formula by which “we can judge the error made by taking E = 1.”[Pn = E]. Introducing µ ¶nh µ ¶nk ln p(h + t|n, h) t t y(t) = 1− = 1+ , ln p(h|n, h) h k he gets for the right tail that Z k−ε Z k y(t)dt = y(ε) exp[ln y(t + ε) − ln y(ε)]dt ε 0 Z k−ε ∼ y(ε) exp(−nεt/hk)dt, 0
which equals y(ε)hk/(nε). This is the first instance of his method for evaluating tail probabilities. It follows that √ hk Pn ∼ 1 − √ [y(−ε) + y(ε)], (6) ε 2πn which is easy to calculate. It is clear that Laplace’s proof implies that θ is asymptotically normal (h, hk/n), see (5), although Laplace does not discuss this result in the present context. This section of the 1774 paper is a remarkable achievement. The 24-year old Laplace had on a few pages given a simple proof of the inverse of Bernoulli’s and de Moivre’s complicated proofs, which had taken these authors 20 and 12 years, respectively, to produce. In his 1781 and 1786 papers he improves (2) and (6) by taking more terms of the expansions into account. He uses thepasymptotic normality of θ to calculate credibility intervals for θ in the form h ±u hk/n,where u is normal (0, 1). He tests the hypothesis θ ≤ r, say, against θ > r by comparing the tail probability P (θ ≤ r) with its complement. For two independent binomial samples, he (1786, Art. 40) proves that θ1 — θ2 is asymptotically normal with mean h1 −h2 and variance
35 5.4. The predictive distribution, 1774-1786 h1 k1 /n1 + h2 k2 /n2 , which he uses for testing the hypothesis θ2 ≤ θ1 against θ2 > θ1 . He thus laid the foundation for the theory of testing statistical hypotheses. 5.4. The predictive distribution, 1774-1786 Let E1 and E2 by two conditionally independent events so that P (E1 E2 |Ci ) = P (E1 |Ci )P (E2 |Ci ), i = 1, 2, ..., n, and let P (Ci ) = 1/n. The probability of the future event E2 , given that E1 has occurred, equals X X P (E2 |E1 ) = P (E1 |Ci )P (E2 |Ci )/ P (E1 |Ci ) (1) X = P (E2 |Ci )P (Ci |E1 ). Comparing with
P (E2 ) =
X
P (E2 |Ci )P (Ci ),
it will be seen that the conditional probability of E2 , given E1 , is obtained from the unconditional probability by replacing the prior distribution of Ci by the updated prior, given E1 . For the continuous case we have similarly Z (2) P (E2 |E1 ) = P (E2 |θ)P (θ|E1 )dθ.
This is the basic principle of Laplace’s theory of prediction, developed between 1774 and 1786. He uses (1) for finding the probability of a future series of events and for updating the prior successively. Let E1 be the outcome of n = a + b binomial trials with a successes and E2 the outcome of m = c + d trials under the same circumstances. Hence, µ ¶Z 1 Z 1 m a+c b+d p(c|a) = θ (1 − θ) dθ θa (1 − θ)b dθ (3) c 0 0 µ ¶ m (a + 1)[c] (b + 1)[d] = (4) c (n + 2)[m] µ ¶ 1 1 3 (a + c)a+c+ 2 (b + d)b+d+ 2 nn+ 2 m ∼ , c = 0, 1, . . . , m, (5) = 1 1 3 c aa+ 2 bb+ 2 (n + m)n+m+ 2
/
see Laplace (181, Art. 17). We have used the notation a[x] = a(a + 1) · · · (a + x − 1). In the form (4) the analogy to the binomial is obvious. Laplace obtains (5) from (4) by means of Stirling’s formula. Formula (3) is the beta-binomial or the inverse hypergeometric distribution which is also known in the form µ ¶µ ¶ µ ¶ a+c b+d n+m+1 p(c|a) = . c d m
/
Laplace derives similar results without the binomial coefficient in the 1774 paper where he considers a specified sequence of successes and failure.
36 5.5. A statistical model and a method of estimation, 1774 To find a large-sample approximation to p(c|a) based on (5), Laplace (TAP, II, Art. 30) keeps h = a/n fixed, as n → ∞. Assuming that m is large, but at most of the order of n, he proves that c is asymptotically normal with mean mh and variance mh(1 − h)(1 +
m ). n
Hence, Laplace warns against using the binomial with mean mh and variance mh(1 − h) for prediction unless m/n is small. Laplace (1786, Art. 41-43) generalizes the asymptotic theory further by evaluating the integral Z 1 Z 1 a r r b E(z (θ)|a) = z (θ)θ (1 − θ) dθÁ θa (1 − θ)b dθ, 0
0
which gives the conditional probability for the r-fold repetition of a compound event having probability z(θ). Of particular interest is the so-called rule of succession which gives the probability of a success in the next trial, given that a successes have occurred in the first n trials. Setting m = c = 1 this probability becomes (a+1)/(n+2). It is clear that p(c|a) can be found as the product of such successive conditional probabilities times a binomial coefficient. Laplace (1781, Art. 33) also derives the rule of succession for multi-nomial variables. Setting E1 = (x1 , . . . , xn ) and E2 = xn+1 in (2) we get the predictive density Z (6) p(xn+1 |x1 , . . . , xn ) = f (xn+1 |θ)p(θ|x1 , . . . , xn )dθ, where f (x|θ) is the density of x and p(θ|x1 , . . . , xn ) is given by (5). 5.5. A statistical model and a method of estimation. The double exponential distribution, 1774 At the time of Laplace (1774) it was customary in the natural sciences to use the arithmetic mean of repeated observations under essentially the same circumstances as estimate of the true value of the phenomenon in question, but a general probabilistic foundation for this practice was lacking. It was the aim of Laplace to prove that |x − θ| → 0 in probability as n → ∞, just as he had justified the use of the relative frequency as estimate of the binomial parameter. Errors were expressed as |x− θ| and error distributions were considered as symmetric about zero with finite range, only the rectangular, the triangular and the semicircular distributions had been proposed before Laplace. Thomas Simpson (1710-1761) had (1757) derived the sampling distribution of the mean for observations from a symmetric triangular distribution, a rather complicated function, and had shown numerically that P (|x| < k) > P (|x1 | < k) for n = 6 and two values of k, from which he concluded that it is advantageous to use the mean as estimate of θ.
37 5.5. A statistical model and a method of estimation, 1774 As a first step Laplace (1774) introduces a new error distribution with infinite support, the double exponential distribution m f (x|θ, m) = e−m|x−θ| , − ∞ < x < ∞, −∞ < θ < ∞, 0 < m < ∞. 2 It follows from the principle of inverse probability that X p(θ, m|x) ∝ (m/2)n exp(−m |xi − θ|).
Next Laplace proposes two principles for estimating the location parameter. According to the first, the estimate ˜θ should be chosen such that it is equally probable for the true value to fall below or above it, that is, ˜θ is the posterior median. According to the second principle the estimate should minimize the expected error of estimation. He proves that the two principles lead to the same estimate. Here we have for the first time a completely specified statistical model and a well-defined principle of estimation. It is remarkable that Laplace starts from the joint distribution of θ and m although he is interested only in estimating θ. He could have limited himself to the case with a known scale parameter as customary by other authors at the time. Now he had to take the nuisance parameter m into account. Another remarkable fact is the apparent mathematical simplicity which he obtains by keeping strictly to the then prevailing error concept. The observational error is expressed as |x− θ| and the error of estimation as |θ − ˜θ|. Laplace does not comment on the fact that he uses the posterior mode as estimate of the binomial parameter but the posterior median as estimate of the location parameter. Since the median and the mode coincide for a symmetric distribution he needed an argument for choosing between them. This he found by likening estimation to a game of chance in which the player’s expected loss should be minimized. However, he does not explain why a scientists’s “loss” caused by an error of estimation should be measured in the same way as a player’s pecuniary loss. It turned out that the solution of the estimation problem for an arbitrary sample size is extremely difficult so Laplace limits himself to consider the case n = 3. Let the observations be labelled such that x1 ≤ x2 ≤ x3 . Laplace makes the transformation λ = θ − x1 , a1 = x2 − x1 , a2 = x3 − x2 , so the posterior distribution becomes
p(λ, m|x) ∝ (m3 /8) exp[−m(|λ| + |a1 − λ| + |a1 + a2 − λ|).
(1)
Obviously, the marginal distribution of m, h(m|a1 , a2 ) say, depends only on (a1 , a2 ), which are ancillary with respect to λ. The conditional distribution of λ, given m and x will be denoted by g(λ|a1 , a2 , m), so p(λ, m|x) = g(λ|a1 , a2 , m)h(m|a1 , a2 ). Hence, for a given value of m we have g(λ|a1 , a2 , m) ∝ p(λ, m|x).
38 5.6. The asymptotic normality of posterior distributions, 1785 Assuming first that m is known, Laplace estimates λ by setting the integral of ˜ equal to half the integral from −∞ to ∞. Solving for λ ˜ he finds (1) from −∞ to λ ¶ µ 1 1 1 −ma −ma 1 2 ˜ = ˜θ − x1 = a1 + ln 1 + e λ , a1 > a2 . − e m 3 3 This is the first disappointment: ˜θ differs from the arithmetic mean. Laplace notes that 1 limm→0 ˜θ = x1 + (2a1 + a2 ) = x, 3 so the arithmetic mean is obtained only in the unrealistic case where the observed errors are uniformly distributed on the whole real line. ˜ from the Remarking that m usually is unknown Laplace proceeds to find λ marginal density of λ using that Z ∞ p(λ|a1 , a2 ) = g(λ|a1 , a2 , m)h(m|a1 , a2 )dm, (2) 0
where he obtains h(m|a1 , a2 ) by integration of (1), which gives µ ¶ 1 −ma1 1 −ma2 2 −m(a1 +a2 ) h(m|a1 , a2 ) ∝ m e 1− e . − e 3 3 He does not discuss how to use this result for estimating m. Using (2) for solving the equation Z λ˜ Z 1 ∞ p (λ|a1 , a2 ) dλ − p(λ|a1 , a2 )dλ = 0, 2 −∞ −∞ ˜ is the root of a polynomial equation of the 15th degree and proves he finds that λ ˜ that there is only one root smaller than a1 . This is the second disappointment: λ differs from x, and for n > 3 the solution is so complicated that it is of no practical value. Stigler (1986a, pp. 105-117) points out an error in Laplace’s manipulations with the conditional probabilities involved and shows that the correct solution is found as the root of an equation of the third degree. Although Laplace’s paper did not lead to practical results it is of great value because of its many new ideas. After this fruitless attempt to solve the estimation problem in a fully specified model Laplace turned to the problem of estimating the coefficients in the linear model y = Xβ + ε, assuming only that the errors are symmetrically distributed around zero, see § 7.4. 5.6. The asymptotic normality of posterior distributions, 1785 In his 1774 proof of the asymptotic normality of the beta distribution Laplace uses a uniform prior as he did later on in many other problems. However, these results may be considered as special cases of his (1785) general theory based on an arbitrary, differentiable prior.
39 5.6. The asymptotic normality of posterior distributions, 1785 First, he (1785, Art. 1; TAP, I, Art. 23) generalizes the binomial to a multinomial model with cell probabilities depending on a parameter θ with prior density w(θ) so that p(θ|x) ∝ g1x1 (θ) · · · gkxk (θ)w(θ), (1) P P gi (θ) = 1, and xi = n. He derives an asymptotic where x = (x1 , . . . , xk ), expansion of the corresponding probability integral for hi = xi /n, i = 1, . . . , k, fixed and n → ∞ Next, he (1785, Art. 6; TAP, I, Art. 27) discusses the continuous case p(θ|x) = f (x|θ)w(θ)/p(x), x = (x1 , . . . , xn ), where f (x|θ) is a frequency function, f (x|θ) = f (x1 |θ) · · · f (xn |θ) and Z p(x) = f (x|θ)w(θ)dθ.
(2)
(3)
He derives an asymptotic expansion of the probability integral for x fixed and n → ∞. Laplace derives the first three terms of the asymptotic expansions, see Hald (1998, § 13.4). We shall here only indicate the method of proof and derive the main term. It is assumed that the posterior distribution is unimodal and disappears at the endpoints of its support. The mode is denoted by ˆθ and, like Laplace, we abbreviate p(θ|x) to p(θ). As in the binomial case Laplace evaluates the probability integral by developing the integrand into a power series, which he then integrates. For α < ˆθ < β we have Z β Z β ˆ p(θ)dθ = p(θ) exp[ln p(θ) − ln p(ˆθ)]dθ (4) α α Z b dθ = p(ˆθ) exp(−u2 /2) du du a
where
−u2 /2 = ln p(θ) − ln p(ˆθ),
(5)
and the limits of integration are
1 a = −[2 ln{p(ˆθ )/p(ˆθ − α)}] 2
and 1 b = [2 ln{p(ˆθ)/p(ˆθ + β)}] 2 .
By means of the transformation (5), the problem has thus been reduced to finding dθ/du as a function of u, which may be done by means of a Taylor expansion. We therefore introduce the coefficients dk ln p(θ) ck = |θ=ˆθ , k = 1, 2, . . . , dθk noting that c1 = 0, c2 < 0, and that c2 , c3 , . . . are O(n). It follows that 1 u2 = −c2 (θ − ˆθ)2 − c3 (θ − ˆθ)3 + . . . , 3
(6)
40 5.6. The asymptotic normality of posterior distributions, 1785 which by differentiation gives √ dθ 1 = ±√ (1 + cu/ −c2 + . . .), du −c2
where c depends on the ratio c3 /c2 which is O(1). Using that the complete integral of p(θ) equals unity, p(ˆθ) may be eliminated from (4) and we get Z b Z β p(θ)dθ ∼ φ(u)du, α
a
which shows that u is asymptotically normal (0, 1). From (6) it follows that √ u = ± −c2 (θ − ˆθ)[1 + (c3 /6c2 )(θ − ˆθ) + . . . ].
1 Hence, in a neighbourhood of ˆθ of order n− 2 , u is asymptotically linear in θ so that θ becomes asymptotically normal with mean ˆθ and variance given by
d2 ln p(ˆθ) 1 1 =− = . 2 −c2 V (θ) dˆθ
(7)
By a more detailed analysis Laplace proves that p(θ)dθ = φ(u)[1 + a1 u + a2 (u2 − 1) + (a3 u3 − a1 a2 u) + . . . ]du,
(8)
where the a’s are expressed in terms of the c’s and ai is of order n−i/2 . This is Laplace’s fundamental (“central”) limit theorem, which is the foundation for the large sample theory based on inverse probability. Modern versions have been discussed by Hald (1998, § 13.5). For the two-parameter model, Laplace (TAP, I, Art. 28) shows that (ˆθ1 ,ˆθ2 ) for large n is bivariate normal with mean (θ1 ,θ2 ) and inverse dispersion matrix equal to ! Ã ∂ 2 ln p(ˆθ) , (i, j) = 1, 2, . . . (9) (cij ) = − ∂ ˆθi ∂ θˆj We shall now note some consequences of Laplace’s theorem. Since the first term of ln p(θ) is of order n and the second term, ln w(θ), is of order 1, it follows that ˆθ and V (θ) for large n are independent of the prior distribution. This property was presumably known by Laplace and his contemporaries, it is explicitly expressed by Cournot (1843, § 95), who remarks that in this case the posterior distribution assumes “an objective value, independent of the form of the unknown [prior] function”. In modern terminology the likelihood function L(θ) is defined as proportional to f (x|θ) and l(θ) = ln L(θ). If the prior is uniform then d d d ln p(θ) = ln f (x|θ) = l(θ), dθ dθ dθ
(10)
so that ˆθ equals the maximum likelihood estimate. Because of the equivalence of direct and inverse probability, see for example the binomial case treated above, it
41 5.6. The asymptotic normality of posterior distributions, 1785 follows intuitively that the maximum likelihood estimate is asymptotically normal with mean θ and that ¶ µ 2 d ln f (x |θ) ˆ ˆ , 1/V (θ) = 1/E[V (θ|x)] = E − dθ2 a result formally proved by Edgeworth (1908) under some restrictions. Laplace’s two proofs above are examples of his method of asymptotic expansions of definite integrals. In the TAP (1812, II, Art. 23) he gives a simpler proof in connection with a discussion of estimating the location parameter of a symmetric error distribution, looking only for the main term of the expansion and assuming that the prior is uniform. It is, however, easy to see that his proof holds also for the general model (2). Expanding ln p(θ) in Taylor’s series around ˆθ he finds ´2 d2 1³ ˆ ˆ ˆ (11) θ−θ ln p(θ) = ln p(θ) + 2 ln p(θ) + . . . . 2 ˆ dθ 1 For values of θ − ˆθ at most of order n− 2 the terms after the second can be neglexted. Using that the complete integral of p(θ) equals unity, p(ˆθ) is eliminated with the result that θ is asymptotically normal [ ˆθ, V (ˆθ)]. Laplace’s proof, supplemented by regularity conditions, is the basis for the modern proofs.
CHAPTER 6
A nonprobabilistic interlude: The fitting of equations to data, 1750-1805 6.1. The measurement error model We shall consider the model yi = f (xi1 , . . . , xim ; β 1 , . . . , β m ) + εi , i = 1, . . . , n, m ≤ n,
where the y 0 s represent the observations of a phenomenon, whose variation depends on the observed values of the x0 s, the β 0 s are unknown parameters, and the ε0 s random errors, distributed symmetrically about zero. Denoting the true value of y by η, the model may be described as a mathematical law giving the dependent variable η as a function of the independent variables x1 , . . . , xm with unknown errors of observation equal to ε = y − η. Setting ε1 = . . . = εn = 0, we obtain for n > m a set of inconsistent equations, called the equations of condition. Replacing the β 0 s by the estimates b1 , . . . , bm , say, we get the adjusted values of the observations and the corresponding residuals ei = yi − y˜i , i = 1, . . . , n, small residuals indicating good estimates. We shall call the model linear if f is linear in the β 0 s. If f is nonlinear, it is linearized by introducing approximate values of the β 0 s and using Taylor’s formula. In the following discussion of the estimation problem it will be assumed that linearization has taken place so that the reduced model becomes yi = β 1 xi1 + . . . + β m xim + εi , i = 1, . . . , n, m ≤ n.
(1)
For one independent variable we will often use the form yi = α + βxi + εi . Using matrix notation (1) is written as y = Xβ + ε. In the period considered no attempts were made to study the sampling distribution of the estimates. The efforts were concentrated on devising simple methods for finding point estimates of the parameters and on finding objective methods. The first methods of estimation were subjective, as for example the method of selected points which consists in choosing m out of the n observations and solving the corresponding m equations of condition. Hence, m of the residuals are by definition equal to zero. Many scientists using this method calculated the remaining n − m residuals and studied their sign and size to make sure that there were no systematic deviations between the observations and the proposed law. This procedure gave at the same time a qualitative check of the model, an impression of the goodness of fit which could be compared with previous experience on the size of observational errors, and a possibility for identifying outliers. 43
44 6.2. The method of averages by Mayer, 1750, and Laplace, 1788 In problems of estimation it is assumed that the model is given, usually formulated by the scientist by means of a combination of theoretical and empirical knowledge. In the following sections we shall sketch three methods of fitting linear equations to data: the method of averages, the method of least absolute deviations, and the method of least squares. A more detailed discussion, including the scientific background in astronomy and geodesy, the original data and their analysis, is due to Stigler (1986a) and Farebrother (1998), who carry the history up to about 1900. In the period also a fourth method was developed: the method of minimizing the largest absolute residual, today called the minimax method. However, we shall not explain this method because it is of no importance for our further discussion of methods of estimation. Farebrother (1998) has given a detailed history of the method. 6.2. The method of averages by Mayer, 1750, and Laplace, 1788 The German cartographer and astronomer Tobias Mayer (1723-1763) studied the libration of the moon by making 27 carefully planned observations of the crater Manilius during a period of a year. Using spherical trigonometry he (1750) derived a nonlinear relation between three measured arcs and three unobservable parameters. Linearizing this relation and inserting the observed values he obtained 27 equations of the form β 1 − yi = β 2 xi2 − β 3 xi3 , i = 1, . . . , 27,
where yi is the observed latitude of Manilius in relation to the moon’s apparent equator and x2i2 + x2i3 = 1, since xi2 and xi3 are the sine and the cosine of the same observed angle. The observations were planned to obtain a large variation of x2 and thus also of x1 . To estimate the parameters Mayer first uses the method of selected points. He chooses three of the 27 equations in such a way that large differences between the three values of x2 are obtained with the purpose to get a good determination of the unknowns. He solves the three equations by successive elimination of the unknowns. However, he remarks that the method is unsatisfactory because selecting three other equations will lead to other estimates, hence all the observations should be used. He proposes to divide the 27 equations into 3 groups of 9 each, to sum the equations within each group, and to solve the resulting three equations. This method became known as Mayer’s method; one may of course use averages instead of sums wherefore it later was called the method of averages. Mayer states that “the differences between the three sums are made as large as possible”, that is, the same principle as used in selecting the three equations above. To obtain this goal, he classifies the equations according to the size of xi2 , the nine largest values defining the first group and the nine smallest the second. The method of averages became popular because of its simplicity, both conceptually and numerically. However, for more than one independent variable there may be several ways of obtaining large contrasts between the coefficients in the equations. Mayer did not face this problem because in his example the two independent variables are functionally related.
45 6.3. The method of least absolute deviations, 1757 and 1799 Laplace (1788) generalizes Mayer’s method in a paper in which he explains the long inequalities in the motions of Jupiter and Saturn as periodic with a period of about 900 years, based on 24 observations on the longitude of Saturn over the period 1591-1785. After linearization Laplace obtains 24 equations of the form yi = β 0 + β 1 xi1 + β 2 xi2 + β 3 xi3 + εi , i = 1, . . . , 24, x2i2
x2i3
+ = 1. To find the four unknowns from the 24 inconsistent equations where obtained by setting the ε0 s equal to zero, Laplace constructs four linear combinations of the equations. For simplicity he uses coefficients equal to +1, 0 and −1 only, so that the calculations are reduced to additions and subtractions. This is an important advance over Mayer’s method, which is based on disjoint subsets of the equations. The first linear combination is obtained by adding all 24 equations, the second by subtracting the sum of the last 12 from the sum of the first 12. Laplace does not explain the principle used for constructing the third and the fourth combination, he only lists the number of the equations to be added, subtracted or neglected. However, it is easy to see from this list that the third combination is obtained, with one exception, from the 12 equations with the largest values of |xi3 | and neglecting the rest, the sign of each equation being chosen such that the coefficient of β 3 becomes positive. The fourth combination is obtained by the same procedure applied to |xi2 |. In this way the matrix of coefficients in the resulting four equations becomes nearly diagonal which gives a good determination of the unknowns. Laplace calculates the residuals, not only for the 24 observations but also for 19 further observations from the same period. He remarks that some of the residuals are larger than expected from a knowledge of the size of errors of observation and that the pattern of the signs shows that a small systematic variation still exists. Stigler (1986a, p. 34) has analysed the 24 observations by the method of least squares and tabulated the residuals, which do not deviate essentially from those found by Laplace. Mayer’s and Laplace’s methods are special cases of the theory of linear estimation. However, neither Mayer nor Laplace gave an algebraic formulation or a general discussion of their methods, they only solved the problem at hand. Their procedure became widely used and existed for many years as a competitor to the method of least squares because it produced good results with much less numerical work. 6.3. The method of least absolute deviations by Boscovich, 1757, and Laplace, 1799 Roger Joseph Boscovich (1711-1787) was born in Dubrovnik where he attended a Jesuit school. Fifteen years old he was sent to Rome to complete his training as a Jesuit priest, he was ordained in 1744. Besides, he studied mathematics, astronomy and physics and published papers in these fields. He became professor of mathematics at the Collegium Romanum in 1740. Between 1735 and 1754 the French Academy carried out four measurements of the length of an arc of a meridian at widely different latitudes with the purpose to determine the figure of the Earth, expressed as its ellipticity. Pope Benedict XIV wanted to contribute to this project and in 1750 he commissioned Boscovich and the English Jesuit Christopher Maire to measure an arc of the meridian near Rome
46 6.3. The method of least absolute deviations, 1757 and 1799 and at the same time to construct a new map of the Papal States. Their report was published in 1755. The relation between arc length and latitude for small arcs is approximately y = α + βx, where y is the length of the arc and x = sin2 L, where L is the latitude of the midpoint of the arc. The ellipticity equals β/3α. From the measured arcs the length of a one-degree arc is calculated and used as the observed value of y. Boscovich’s problem was to estimate α and β from the five observations of (x, y). In 1757 he published a summary of the 1755 report in which he proposed to solve the problem of reconciling inconsistent linear relations by the following method: Minimize the sum of the absolute values of the residuals P under the restriction that the sum of the residuals equals zero, that is, minimize |yi − a − bxi | with respect P to a and b under the restriction (yi − a − bxi ) = 0. Boscovich is the first to formulate a criterion for fitting a straight line to data based on the minimization of a function of the residuals. His formulation and solution is purely verbal, supported by a diagram that explains the method of minimization. We shall give an algebraic solution that follows his mode of reasoning. Using the restriction y¯ = a + b¯ x to eliminate a we get S(b) =
n X i=1
|yi − y¯ − b(xi − x¯)|,
which has to be minimized with respect to b. Setting and Xi = xi − x¯, Yi = yi − y¯ and bi = Yi /Xi (the slope of the line connecting the ith observation with the center of gravity) we get n X S(b) = |Xi ||bi − b|, i=1
where Boscovich orders the observations such that b1 > b2 > . . . > bn . Hence, S(b) is a piecewise linear function of b with a slope depending on the position of b in relation to the b0i s. For bj > b > bj+1 , j = 1, . . . , n − 1, the slope equals j j n n X X X X S(bj ) − S(bj+1 ) = |Xi | − |Xi | = |Xi | − 2 |Xi |. bj − bj+1 i=j+1 i=1 i=1 i=1
(1)
The minimum of S(b) is thus obtained for b = bk , say, where k is determined from the inequality n X
i=k+1
|Xi | −
k X i=1
|Xi | ≤ 0
b > bk+1 he gets 0
S (b) = −
k X i=1
|Xi | +
n X
i=k+1
|Xi |,
which for S 0 (b) ≤ 0, b < bk , and S 0 (b) > 0, b > bk , gives Boscovich’s result (3). In the Mécanique Céleste, (1799, Vol. 2) Laplace returns to the problem and proposes to use Boscovich’s two conditions directly on the measurements of the arcs instead of the arc lengths per degree, that is, instead P of yi he considers wi yi , where wi is the number of degrees. Hence, he minimizes wi |yi −a − bxi | under the P restriction wi (yi − a − bxi ) = 0. Introducing Xi and Yi as the deviations from the weighted means and setting bi = Yi /Xi the problem is formally the same as above, so the value of k is found from (3) by substituting wi |Xi | for |Xi |. Bowditch (1832, Vol. 2, p.438) points out that the method of least absolute deviations is preferable to the method of least squares for estimating the slope of the line if extreme errors occur. The method of least absolute deviations had two drawbacks compared with the method of averages and the method of least squares: (1) the estimate of the slope is nonlinear and complicated to calculate, (2) the method was restricted to one independent variable. The method therefore disappeared from statistical practice until the second half of the twentieth century when questions of robustness of estimates were discussed. 6.4. The method of least squares by Legendre, 1805 Adrien-Marie Legendre (1752-1833) got his basic education in mathematics and the natural sciences in Paris. He was professor of mathematics at the École Militaire in Paris from 1775 to 1780. The Academy of Sciences appointed him as a member of important committees on astronomical and geodetical projects, among them the committee for determining the standard meter based on measurements of a meridian arc through Paris. His main scientific work was concentrated on celestial mechanics, number theory and the theory of elliptic integrals. In competition with Laplace he worked on attraction and the figure of the Earth. He wrote a textbook on geometry and a treatise on the theory of elliptic functions in three volumes 1825-1828. Legendre’s “Nouvelle methods pour la determination des orbites des comètes” (1805) contains an appendix (pp. 72-80) entitled “Sur la méthode des moindres carrés” in which for the first time the method of least squares is described as an algebraic procedure for fitting linear equations to data. He begins by stating the linear measurement error model yi = b1 xi1 + . . . + bm xim + ei , m ≤ n, i = 1, . . . , n.
After some introductory remarks to the effect that one should proceed so that the extreme errors without regard to sign are contained within as narrow limits are possible, Legendre writes: “Among all the principles that can be proposed for this purpose, I think there is no one more general, more exact, and more easy to apply
48 6.4. The method of least squares, 1805 than that which we have made use of in the preceding researches, and which consists in making the sum of the squares of errors a minimum. In this way there is established a sort of equilibrium among the errors, which prevents the extremes to prevail and is well suited to make us know the state of the system most near to the truth.” The sum of the squares of the errors is n n X X e2i = (yi − b1 xi1 − . . . − bm xim )2 . i=1
i=1
To find its minimum, Legendre sets the derivative with respect to bk , k = 1, . . . , m, equal to zero, which leads to the m linear equations n n n X X X yi xik = b1 xi1 xik + . . . + bm xim xik , k = 1, . . . , m, i=1
i=1
i=1
later called “the normal equations”. Legendre remarks that they have to be solved by the ordinary methods, which presumably means by successive elimination of the unknowns. He states that if some of the resulting errors are judged to be too large, then the corresponding equations should be discarded as coming from faulty observations. Finally, P he notes that the arithmetic mean is obtained as a special case by minimizing (yi − b)2 , and that the center of gravity for the observed coordinates (y1i , y2i , y3i ), i = 1, . . . , n, is obtained by minimization of X [(y1i − b1 )2 + (y2i − b2 )2 + (y3i − b3 )2 ]. Legendre’s exposition of the method of least squares is clear and concise. However, one may wonder why he did not discuss the new method in relation to Laplace’s two methods based on the least value of the absolute errors (residuals). Legendre demonstrates the new method by analysing the same data as Laplace, namely the five measurements of the meridian arcs making up the total of the arc through Paris, and used for determining the standard meter. His result does not deviate essentially from that found by Laplace. The importance of Legendre’s method of least squares was recognized immediately by leading astronomers and geodesists in France and Germany.
CHAPTER 7
Gauss’s derivation of the normal distribution and the method of least squares, 1809 7.1. Biography of Gauss Carl Friedrich Gauss (1777-1855) was born into a humble family in Brunswick, Germany. His extraordinary talents were noted at an early age, and his father allowed him to enter the local Gymnasium in 1788, where he excelled in mathematics and numerical calculations as well as in languages. Impressed by his achievements, a professor at the local Collegium Carolinum recommended him to the Duke of Brunswick, who gave Gauss a stipend, which made it possible for him to concentrate on study and research from 1792 and 1806, when the Duke died. For three years Gauss studied mathematics and classics at the Collegium Carolinum; in 1795 he went to the University of Göttingen and continued his studies for another three years. From 1798 he worked on his own in Brunswick until he in 1807 became professor in astronomy and director of the observatory in Göttingen, where he remained for the rest of his life. This academic career took place at a time of great political turmoil, first the French revolution, then the Napoleonic wars with the French occupation of Germany, and finally the liberal revolutions of 1830 and 1848. Nevertheless, Gauss succeeded in keeping up a steady scientific activity of great originality in pure and applied mathematics. In his doctoral dissertation in 1799 he proved the fundamental theorem of algebra and showed that a real polynomial can be written as a product of linear and quadratic factors with real coefficients. Another early mathematical masterpiece was the Disquisitiones arithmeticae (Arithmetical investigations, 1801), which became of great importance for the development of number theory; here he proved the law of quadratic reciprocity, previously proved incompletely by Legendre. This work established his fame as a mathematician. Throughout his life he contributed to algebra, number theory, analysis, special functions, differential equations, differential geometry, non-Euclidean geometry, and numerical analysis. In mathematical astronomy he achieved a similar early recognition by calculating the orbit of the new planet Ceres, which had been observed for a short period of time in the beginning of 1801 but then disappeared. At the end of the year it was located at a position very close to that predicted by Gauss. From then on Gauss calculated the orbits of several other planets and finally published his methods in the Theoria motus corporum coelestium (Theory of the motion of the heavenly bodies, 1809), which contains his first exposition of the method of least squares, based on the assumptions that the observations are normally distributed and that the prior distribution of the location parameters is uniform. 49
50 7.2. Gauss’s derivation of the normal distribution, 1809 Regarding his invention of the method of least squares Gauss (1809, §186) writes: “Our principle, which we have made use of since the year 1795, has lately been published by Legendre. . . ” This statement naturally angered Legendre who responded with a letter (1809) pointing out that “There is no discovery that one cannot claim for oneself by saying that one had found the same thing some years previously; but if one does not supply the evidence by citing the place where one has published it, this assertion becomes pointless and serves only to do a disservice to the true author of the discovery”. In 1811 Laplace brought the matter of priority before Gauss, who answered that “I have used the method of least squares since the year 1795 and I find in my papers, that the month of June 1798 is the time when I reconciled it with the principle of the calculus of probabilities.” In the TAP (1812, II, §24) Laplace writes that Legendre was the first to publish the method, but that we owe to Gauss the justice to observe that he had the same idea several years before, that he had used it regularly, and that he had communicated it to several astronomers, see Plackett (1972) for a full discussion of the priority dispute. As a pure mathematician Gauss worked alone; he did not have the patience to explain and discuss his ideas with other mathematicians. He kept a mathematical diary in which he noted his results but did not publish before the proofs were in perfect form. In applied mathematics he worked together with astronomers, geodesists and physicists. Besides giving significant contributions to the mathematical, numerical and statistical analyses of data, he carried out himself a large number of observations, measurements and experiments. In particular, he took part in the triangulation of Hanover, beginning in 1818 and continuing the fieldwork during the summer months for eight years. The analysis of these data led him to his second version of the method of least squares (1823, 1828) based on the minimization of the expected loss, expressed as the squared error of estimation. Gauss was much influenced by Laplace. His first proof of the method of least squares is based on inverse probability inspired by Laplace’s 1774 paper. After having proved the central limit theorem Laplace (1810, 1812) turned to the frequentist view of probability and Gauss followed suit in his second proof. Gauss’s books, papers and some of his letters have been published in 12 volumes in Werke (1863-1933). 7.2. Gauss’s derivation of the normal distribution, 1809 As explained in §5.5 Laplace (1774) had formulated the principle for parametric statistical inference as follows: Specify the mathematical form of the probability density for the observations, depending on a finite number of unknown parameters, and define a method of estimation that minimizes the error of estimation. He had hoped in this way to show that the arithmetic mean is the best estimate of the location parameter in the error distribution but failed to do so because he used the absolute value of the deviation from the true value as the error of estimation, which led to the posterior median as estimate. The gap between statistical practice and statistical theory thus still existed when Gauss took over. Gauss (1809) solved the problem of the arithmetic mean by changing both the probability density and the method of estimation. He turned the problem around
51 7.2. Gauss’s derivation of the normal distribution, 1809 by asking the question: What form should the density have and what method of estimation should be used to get the arithmetic mean as estimate of the location parameter? He (1809, §177) writes: “It has been customary to regard as an axiom the hypothesis that if any quantity has been determined by several direct observations, made under the same circumstances and with equal care, the arithmetic mean of the observed values gives the most probable value, if not rigorously, yet very nearly, so that it is always most safe to hold on to it.” Let f (x − θ) be the probability density of the observations and assume that f (.) is differentiable and tends to zero for the absolute value of the error tending to infinity. It then follows from Laplace’s principle of inverse probability that the posterior density of θ equals Z p(θ|x) = f (x1 − θ) · · · f (xn − θ)/ f (x1 − θ) · · · f (xn − θ)dθ.
According to the quotation above Gauss requires that the most probable value, the mode of p(θ|x), should be set equal to the arithmetic mean x¯. Hence, he gets the differential equation ∂ ln p(θ|x) = 0, for θ = x¯ and all values of n and x. ∂θ The solution is the normal distribution h p(x|θ, h) = √ exp[−h2 (x−θ)2 ], −∞ < x < ∞, −∞ < θ < ∞, 0 < h < ∞. (1) π
Laplace’s exponent m|x − θ| is thus replaced by [h(x − θ)]2 . Like Laplace, Gauss parameterizes the distribution by the inverse scale parameter. Gauss’s invention of the normal distribution marks the beginning of a new era in statistics. Natural scientists now had a two-parameter distribution which (1) led to the arithmetic mean as estimate of the true value and thus to a probabilistic justification of the method of least squares, (2) had an easily understandable interpretation of the parameter h in terms of the precision of the measurement method, and (3) gave a good fit to empirical distributions of observations, as shown by Bessel (1818). Assuming that h is known it follows from the principle of inverse probability that p(θ|x) ∝ exp[−h2 (x − θ)2 ], P so the posterior mode is found by minimizing (xi − θ)2 , which of course leads to the arithmetic mean. Since X X (xi − θ)2 = (xi − x¯)2 + n(¯ x − θ)2 , √ θ is normally distributed with mean x¯ and precision h n. Gauss’s probabilistic justification of the method of least squares thus rests on the assumptions that the observations are normally distributed and that the prior distribution of the location parameter is uniform. P 2 For observations with different Gauss minimizes hi (xi − θ)2 which Pprecisions P 2 2 leads to the weighted mean x¯ = hi xi / hi .
52 7.3. Gauss’s first proof of the method of least squares, 1809 Regarding the constant term, Gauss refers to “the elegant theorem first discovered by Laplace,” which shows that he had √ read Laplace (1774). In modern notation we have h = 1/σ 2. In many contexts it is, however, convenient to use Gauss’s notation. Laplace’s result (1785) that for large n, p(θ|x) is approximately normal for an arbitrary density f (x|θ) is thus supplemented by Gauss’s result that, for any n, p(θ|x) is normal if f (x|θ) is normal. It is important to distinguish between the Gaussian method of using the posterior mode as estimate and the method of maximum likelihood. The two methods lead to the same estimate but are based on fundamentally different concepts. There has been some confusion on this matter in the literature. It is a surprising fact that nobody before Bessel (1818) studied the form of empirical error distributions, based on the many astronomical observations at hand. Presumable, they would then have realized, that the error distributions on which they spent so much mathematical labour (the rectangular, triangular and quadratic) were poor representatives of the real world. 7.3. Gauss’s first proof of the method of least squares, 1809 Gauss generalizes his results for one unknown parameter to the linear normal model y = Xβ + ε with n observations and m parameters, m < n. He assumes that the m vectors of X are linearly independent, that the β’s are independently and uniformly distributed on the real line, and that the ε0 s are independently and normally distributed with zero mean and known precision h. Using the principle of inverse probability he gets p(β|y) ∝ exp[−h2 (y − Xβ)0 (y − Xβ)].
The posterior mode, b say, is obtained by minimizing (y − Xβ)0 (y − Xβ), which leads to the normal equations X 0 Xb = X 0 y. Gauss (1809, 1810) solves these equations by successive elimination of the unknowns, in this way obtaining an upper triangular system of equations which is solved by backward substitution. The reduced normal equations may be written as Ub = GX 0 y, GX 0 X = U, where U is an upper triangular matrix, and G is a lower triangular matrix with diagonal elements equal to unity. To find the posterior distribution of β m , Gauss integrates out the first m − 1 variables of p(β|y). To carry out the integration he transforms the quadratic form in the exponent into a weighted sum of squares using the matrices from the reduced normal equations. Since (y − Xβ)0 (y − Xβ) = (y − Xb)0 (y − Xb) + (b − β)0 X 0 X(b − β),
(1)
where the first term on the right is independent of β, he introduces the new variables v = U(β − b) and proves that the second term on the right equals v 0 D−1 v, where the elements of the diagonal matrix D are the diagonal elements of U. Hence, p(β|y) ∝ exp(−h2 v 0 D−1 v).
(2)
53 7.4. Laplace’s justification of the method of least squares, 1810 Integrating successively with respect to v1 , . . . , vm−1 and using that vm = umm (β m − bm ), Gauss finds 2 2 p(β m |y) = π −1/2 hu1/2 mm exp[−h umm (β m − bm ) ],
(3)
so the posterior mode equals bm , and β m is normally distributed with mean bm and squared precision h2 umm . To find the marginal distribution of β r , r = 1, . . . , m − 1, Gauss uses the fundamental equation (4) X 0 y = X 0 Xβ − z = X 0 Xb, z = −X 0 ε, which multiplied by G gives
v = U(β − b) = Gz. In particular, zm = cm1 v1 + . . . + cm,m−1 vm−1 + vm ,
(5)
say, since G is unit lower triangular. Gauss then considers another form of the solution of the normal equations by introducing a matrix Q defined as QX 0 X = Im . Multiplying (4) by Q he gets β − b = Qz. Hence β m − bm = qm1 z1 + ... + qmm zm = vm u−1 mm .
Using (5) it follows that qmm = u−1 mm , so that the squared precision of β m is 2 h /qmm . From the equation β r − br = qr1 z1 + . . . + qrm zm ,
it then follows by symmetry that the squared precision of β r is h2 /qrr . Gauss does not discuss the covariances, neither does he discuss how to estimate h. The proof demonstrates Gauss’s mastery of linear algebra. His algorithm for inverting the symmetric matrix X 0 X to obtain b = (X 0 X)−1 X 0 y became a standard method in numerical analysis. In his proofs Gauss P uses a simple notation for the inner product of two vectors, a and b say, setting ai bi = [ab]. We shall use this symbol in the following. 7.4. Laplace’s large-sample justification of the method of least squares, 1810
Laplace had the main idea that the soundness of a statistical method should be judged by its performance in large samples. Having just proved the central limit theorem he (1810) immediately used it in his comments on Gauss’s result. For an arbitrary symmetric distribution with location parameter θ and finite √ variance he notes that x¯ is asymptotically normal with mean θ and precision h n, and combining k samples from the same population he gets X p(θ|¯ x1 , . . . , x¯k ) ∝ exp[− h2i ni (¯ xi − θ)2 ]
54 7.4. Laplace’s justification of the method of least squares, 1810 for large samples, according to the principle of inverse probability. The posterior median equals the posterior mode, and the common value is the weighted mean X X x¯ = h2i ni x¯i / h2i ni , P 2 which is the value obtained by minimizing hi ni (¯ xi −θ)2 . Hence, for large samples the method of least squares is valid under weaker assumptions than those used by Gauss. Laplace remarks that this is a reason for using the method also for small samples. Laplace points out that among all differentiable, symmetric error distributions the normal is the only one leading to the arithmetic mean as the posterior mode. Having thus presented a large-sample theory based on his own principles one would have expected him to use it in the following. However, we have here reached a turning point in Laplace’s theory of estimation. He had just developed a new theory based on the central limit theorem leading to the sample distribution of the arithmetic mean and the corresponding frequency interpretation of the method of least squares. In choosing between the two methods Laplace (1812, II, §23) remarks that since “we are in complete ignorance of the law of error for the observations” we are unable to specify the equation from which the inverse probability estimate should be obtained. We should therefore keep to the method of least squares which does not require a specification of the distribution but only the existence of the second moment.
CHAPTER 8
Credibility and confidence intervals by Laplace and Gauss 8.1. Large-sample credibility and confidence intervals for the binomial parameter by Laplace, 1785 and 1812 It follows from Laplace’s 1774 and 1785 papers that the large-sample inverse probability limits for θ are given by the relation p p P (h − u h(1 − h)/n < θ < h + u h(1 − h)/n|h) ∼ (1) = Φ(u) − Φ(−u),
for u > 0. In 1812 (TAP, II, §16) he uses the normal approximation to the binomial to find large-sample direct probability limits for the relative frequency as p p P (θ − u θ(1 − θ)/n < h < θ + u θ(1 − θ)/n|θ) ∼ (2) = Φ(u) − Φ(−u). 1
Noting that θ = h + O(n− 2 ) so that p p θ(1 − θ)/n = h(1 − h)/n + O(n−1 )
and neglecting terms of the order of n−1 as in the two formulas above he solves the inequality (2) with respect to θ and obtains for u > 0 p p P (h − u h(1 − h)/n < θ < h + u h(1 − h)/n|θ) ∼ (3) = Φ(u) − Φ(−u).
The limits for θ in (1) and (3) are the same but the probabilities have different interpretations as indicated by our use of the modern notation for conditional probabilities which did not exist at the time of Laplace. However, Laplace explains the distinction clearly by stating that (3) refers to the probability of events whereas (1) refers to the probability of causes. This important remark implies that Laplace’s previous results for binomial variables, derived by inverse probability, may be interpreted in terms of direct probability. Today the limits are called credibility and confidence limits, respectively. 8.2. Laplace’s general method for constructing large-sample credibility and confidence intervals, 1785 and 1812 From Laplace’s 1785 limit theorem it follows that θ is asymptotically normal with mean ˆθ and variance σ 2 (θ) = (−D2 ln p(ˆθ))−1 , see (5.6.7). Hence, the credibility interval for θ equals ˆθ± uσ(θ) with credibility coefficient P (u) ' Φ(u) − Φ(−u), u > 0. The interval in (8.1.1) is a special case. Similarly, he (1812) uses the central limit theorem to generalize (8.1.3). He finds confidence intervals for the absolute moments and for a regression coefficient but does not formulate a general rule. His method may, however, be described as follows. 55
56 8.3. Credibility intervals Let tn be asymptotically normal with mean θ and variance σ 2 /n so that the probability limits for tn equal θ ± uσ n n−1/2 with covering probability P (u). Solving for θ Laplace finds the limits tn ±uσ n n−1/2 . He remarks that σ n should be estimated from the sample with an accuracy of order n−1/2 , which gives the interval tn ± usn n−1/2 . The estimate sn is obtained by applications of the central limit theorem, as we shall see in the examples. He assumes that P (u) is not changed essentially if n is large. He remarks with satisfaction that he has thus found “an expression in which everything is given by the observations.” Laplace’s examples are based on the measurement error model with finite moments. P r Let m(r) = |εi | /n denote the rth absolute moment and µ(r) = E(|εr |) the corresponding true value, r = 1, 2, . . . . By means of the characteristic function Laplace (TAP, II, §19) proves that m(r) is asymptotically normal with mean µ(r) and variance (µ(2r) − µ2(r) )/n, which also follows directly from the central limit theorem. Hence, the confidence interval for µ(r) is m(r) ± u(m(2r) − m2(r) )1/2 n−1/2 .
(1)
For the regression model xi = βzi + εi he proves that, within the class of linear estimates of β, the least squares estimate b = [zx]/[zz] minimizes the absolute value of the error of estimation and that b is asymptotically normal with mean β and variance σ 2 /[zz]. He (TAP, II, pp. 326-327) then finds the confidence limits for β P 1 as b ± us[zz]− 2 , where s2 = (xi − bzi )2 /n. 8.3. Credibility intervals for the parameters of the linear normal model by Gauss, 1809 and 1816 Assuming, that h is known Gauss (1809) finds limits for the regression coefficients, and assuming that the true value of the variable in question is known he (1816) finds limits for the precision h. He does not discuss the case where both quantities are unknown. As shown in §7.3 Gauss (1809) proves that the squared precision of β r is h2 /qrr , where Q = (X 0 X)−1 . This means that V (β r ) = σ 2 qrr , so the credibility interval for 1/2 β r equals br ± uσqrr . Let ε = (ε1 , . . . , εn ) be independently and normally distributed variables with mean zero and precision h, and let h be uniformly distributed on [0, ∞) so p(h|ε) ∝ hn exp(−h2 [εε]). p ˆ = n/2[εε], and since Gauss concludes thatpthe most probable value of h is h √ ˆ + x) in Taylor’s series he shows σ = 1/h 2 he sets σ ˆ = [εε]/n. Expanding ln p(h ˆ ˆ2 that h is asymptotically normal √ with mean h and variance h /2n. The credibility ˆ interval for h is thus √ h(1 ± u/ 2n) from which he by substitution finds the interval for σ as σ ˆ (1 ± u/ 2n).
57 8.5. Gauss’s confidence interval for the standard deviation, 1816 8.4. Gauss’s rule for transformation of estimates and its implication for the principle of inverse probability, 1816 Gauss’s brief paper (1816) “Bestimmung der Genauigkeit der Beobachtungen” represents a turning point in his approach to estimation theory. First, he ends his applications of inverse probability by finding credibility limits as discussed in §8.3. Next, he refers to Laplace and the central limit theorem indicating that in the future he will use probability in the frequency sense. Finally, he derives the asymptotic relative efficiency of some estimates of the standard deviation in the normal distribution, see §8.5. We shall here discuss the implications of his estimation of the precision and the standard deviation pby inverse probability. After having found the most probable ˆ value of h as h = n/2[εε] he writes (in our notation): √ “The most probable value of σ is consequently 1/h 2. This result holds generally, whether n be large or small.” p ˆ to σ Hence, Gauss transforms h ˆ = [εε]/n as if the estimates were parameters. The general form of this rule is as follows: If tn is the most probable value of θ, then g(tn ) is the most probable value of g(θ) for any one-to-one transformation and all n. This rule was accepted by most statisticians, although it is clear that it violates the principle of inverse probability. Expressed in terms of prior distributions, it can be said that Gauss used the principle of inverse probability as follows: to estimate h he assumed that the prior distribution of h is uniform, and to estimate a one-to-one transformation of h, σ = σ(h) say, he assumed the prior distribution of σ to be uniform. However, this is equivalent to using the method of maximum likelihood. He thus realized that the posterior mode is not invariant to parameter transformations. 8.5. Gauss’s shortest confidence interval for the standard deviation of the normal distribution, 1816 Gauss uses Laplace’s result for the absolut moments under the assumption that the ε0 s are normally distributed (0, σ 2 ). It follows that 1
µ(r) = ar σ r , ar = π − 2 2r/2 Γ((r + 1)/2), r = 0, 1, . . . , so that σ = [µ(r) /ar ]1/r with the corresponding estimate sr = [m(r) /ar ]1/r . Among these estimates he proposes to find the one leading to the shortest confidence interval for σ. Taking the rth root of Laplace’s probability limits for m(r) , he gets the limits for sr as σ(1 ± ubr n−1/2 ), br = (a2r − a2r )/r2 a2r .
Solving for σ he obtains the confidence interval sr (1 ± ubr n−1/2 ). Tabulating br he shows that the shortest interval is obtained for r = 2, which gives √ s2 (1 ± u/ 2n), s2 = [εε]/n.
58 8.5. Gauss’s confidence interval for the standard deviation, 1816 He remarks that “One hundred errors of observation treated by the formula for r = 2 will give a result as reliable as 114 treated by the formula for r = 1,” and so on. Finally, he notes that the confidence interval above equals the credibility interval previously found, see §8.3.
CHAPTER 9
The multivariate posterior distribution 9.1. Bienaymé’s distribution of a linear combination of the variables, 1838 Irénée Jules Bienaymé (1796-1878) proposes to generalize Laplace’s inverse probability analysis of the binomial. Using the principle of inverse probability on the multinomial he gets the posterior distribution X pn (θ1 , . . . , θ k |n1 , . . . , nk ) ∝ θn1 1 · · · θnk k , 0 < θi < 1, θi = 1, (1) P where the n’s are nonnegative integers and ni = n. In normed form this distribution P is today called the Dirichlet distribution. The posterior mode is hi = ni /n, hi = 1. P Bienaymé considers the linear combination z = ci θi and, assuming that hi > 0 is kept that z is asymptotically normal with mean P constant as n → ∞,Phe proves 2 c¯ = ci hi and variance = (ci − c¯) hi /n. There are no new principles involved in his proof but it is lengthy and complicated because z is a function of k −1 correlated random variables. The proof has been discussed by von Mises (1919, 1931, 1964) and by Heyde and Seneta (1977). We shall, however, give a simpler proof by using Lagrange’s (1776) proof of the asymptotic normality of the Dirichlet distribution, see (3.2.1), which was overlooked by Bienaymé and later authors. Because of the normality we need only find the limiting value of the first two moments. It is easy to prove that PE(θi ) → hi , nV (θi ) → hi (1 − hi ) and nCV (θi , θj ) → −hi hj , i 6= j, so that E(z) → ci hi = c¯ and X X X nV (z) → c2i hi (1 − hi ) − ci cj hi hj = (ci − c¯)2 hi . i6=j
9.2. Pearson and Filon’s derivation of the multivariate posterior distribution, 1898 Pearson and Filon attempt to construct a general large-sample theory of estimation by starting from a multivariate distribution with density f (x1 , . . . , xm |θ1 , . . . , θk ) assuming that the parameters are uniformly distributed so that p(θ1 , . . . , θ k |S) ∝
n Y i=1
f (xi1 , . . . , xim |θ1 , . . . , θk ),
where S denotes the sample values indicated on the right side. Expanding this function in Taylor’s series around the posterior mode (ˆθ1 , . . . , ˆθk ), and neglecting terms of the third and higher degree in the deviations, they find that the distribution of 59
60 9.2. Derivation of the posterior distribution, 1898 (ˆθ1 − θ1 , . . . , ˆθk − θk ) is asymptotically normal with zero mean and inverse dispersion matrix i(θ) = {irs (θ)} where θ = (θ1 , . . . , θk ), x = (x1 , . . . , xm ), and (r, s) = 1, . . . , k. ¶ Z Z µ 2 ∂ ln f (x|θ) f (x|θ)dx1 . . . dxm . (1) irs (θ) = −n . . . ∂θr ∂θs However, this paper is unsatisfactory in several respects. They do not state explicitly that the estimates have to satisfy the equations X ∂ ln f (xi1 , . . . , xim |ˆθ1 , . . . , ˆθk )
= 0, r = 1, . . . , k, ∂ ˆθr and the inverse dispersion matrix should have been j(ˆθ) = {jrs (ˆθ)}, where X ∂ 2 ln f (xi1 , . . . , xim |ˆθ1 , . . . , ˆθk ) jrs (ˆθ) = , (r, s) = 1, . . . , k, (2) ∂ ˆθr ∂ ˆθs that is, they do not distinguish clearly between sample and population values. With these corrections, their proof is a generalization of Laplace’s univariate proof, see (11). In the applications they work out i(θ) for several univariate and multivariate distributions in common use. The applications reveal that they have not understood that the theorem holds only for the posterior mode, not for estimates derived by the method of moments, unless the two methods lead to the same estimates, as pointed out by Fisher (1922a). Edgeworth (1908) gives the correct interpretation of the theorem. The matrices i(θ) and j(θ) are called the expected and the observed information matrix, respectively.
CHAPTER 10
Edgeworth’s genuine inverse method and the equivalence of inverse and direct probability in large samples, 1908 and 1909 10.1. Biography of Edgeworth Francis Ysidro Edgeworth (1845-1926) was a complex personality with wideranging interests in both the humanities and the natural sciences. For several years he studied the classics at the universities of Dublin and Oxford, next he studied commercial law and qualified as a barrister, and finally he studied logic and mathematics on his own, using the acquired knowledge to write important books on ethics, utility and economics. In 1880 he became lecturer in logic at King’s College, London, in 1888 he was promoted to professor of political economy, and in 1891 he was appointed professor in that topic at Oxford. Besides being one of the leading British economists, he wrote a large number of papers on probability and statistics. Like Laplace and Gauss, he wrote on inverse as well as direct probability, an important contribution is the Edgeworth series which generalizes Laplace’s central limit theorem. Stigler (1986a) has discussed Edgeworth’s work. Here we shall discuss some of his contributions to inverse probability. 10.2. The derivation of the t distribution by Lüroth, 1876, and Edgeworth, 1883 The estimation of the parameters of the normal distribution by inverse probability was treated by Gauss and his followers as two independent problems, in each case assuming one of the parameters as known. However, in a paper that has been overlooked, Lüroth (1876) continued Gauss’s analysis of the linear normal model by considering the joint distribution of the parameters, as pointed out by Pfanzagl and Sheynin (1996). Starting from p(β, h|y) ∝ hn exp[−h2 (y − Xβ)0 (y − Xβ)],
(1)
tacitly assuming that β and h are uniformly distributed, Lüroth derives the marginal distribution of β m . Using the Gaussian transformation (y − Xβ)0 (y − Xβ) = [ee] + v0 D−1 v, and noting that
Z
exp(−h2 z 2 )dz ∝ h−1 , 61
62 10.2. The derivation of the t distribution, 1876 and 1883 he finds p(β m , h|y) =
Z
2 p(β, h|y)dβ 1 . . . dβ m−1 ∝ hn−m+1 exp(−h2 ([ee] + u−1 mm vm )).
The coefficient of −h2 in the exponent may be written as ¶ µ ¶ µ t2 umm (β m − bm )2 = [ee] 1 + , [ee] 1 + [ee] (n − m + 1) where t2 =
umm (β m − bm )2 . [ee]/(n − m + 1)
Integration with respect to h then gives µ ¶(n−m+2)/2 t2 p(β m |y) ∝ 1 + (n − m + 1)
(2)
(3)
which is Lüroth’s generalization of (7.3.3). It will be seen that Lüroth’s result is the t distribution with n − m + 1 degrees of freedom. Lüroth states that the (inverse probability) interval for β m derived from (3) holds “regardless of which value h may have,” in contradistinction to (7.3.3) which supposes that h is known. He says that it is customary to replace σ in (7.3.3) by 1 s = {[ee]/(n − m)} 2 . He compares the length of the corresponding intervals for a covering probability of 50 per cent and concludes that there is no essential difference, so one can safely use the old and simpler method based on the normal distribution. He thus overlooks the large effect of the t distribution for small samples and for large covering probabilities. Edgeworth (1883), who did not know Lüroth’s paper, asks the fundamental question: How can one find limits for the mean θ of a normal distribution when σ is unknown? The same question was later asked by Gosset (Student, 1908a) in a frequentist setting. Edgeworth derives the marginal distribution of θ for a uniform distribution of h, which gives Z p(θ|x) = p(θ|h, x)dh ∝ {[ee] + n(¯ x − θ)2 }−(n+1)/2 . Hence,
√ p t = (θ − x¯) n/ [ee]/n
(4)
is distributed as Student’s t with n degrees of freedom. He remarks that the 50 per cent credibility interval for θ, depending on a knowledge of σ, should be replaced by the interval p (5) x¯ ± tn−1/2 [ee]/n, P (t) − P (−t) = 0.5, where P (t) denotes the distribution function for t. Returning to the problem (1908b) he makes the same mistake as Lüroth by concluding that the effect of using the t distribution instead of the normal is insignificant, because he considers only intervals with a credibility of 50 per cent.
63 10.3. Edgeworth’s genuine inverse method, 1908 and 1909 10.3. Edgeworth’s genuine inverse method, 1908 and 1909 For n observations from a normal distribution with unknown mean θ and known variance σ 2 Laplace had pointed out that the sampling distribution of x¯ and the posterior distribution of θ have the common density p n/2πσ −1 exp{−n(θ − ˆθ)2 /2σ2 }, ˆθ = x¯. Edgeworth (1908) extends this dual interpretation, which he calls the “reversibility of the inverse and direct point of view” to the nonnormal case. For the density f (x − θ) the posterior mode is determined from the equation ∂ ln p(θ|x) X ∂ ln f (xi − θ) = = 0 for θ = ˆθ. ∂θ ∂θ The large-sample distribution of θ is normal (ˆθ, 1/j(ˆθ)), where j(θ) = −
n X ∂ 2 ln f (xi |θ) i=1
∂θ2
.
(1)
This result explains the name given to j(θ), the information in the sample about θ equals the reciprocal of the variance in the distribution of θ. The corresponding expectation is Z 2 ∂ ln f (x|θ) f (x|θ)dx. (2) i(θ) = −n ∂θ2 Since θ − ˆθ = O(n−1/2 ), j(ˆθ) may be approximated by i(θ), so that for large samples 1 (j(ˆθ)/2π)1/2 exp{− (θ − ˆθ)2 j(ˆθ)} 2 1 (3) ' (i(θ)/2π)1/2 exp{− (θ − ˆθ)2 i(θ)}. 2 This formula represents the equivalence of inverse and direct probability in estimation theory. It is a generalization and an explicit formulation of Laplace’s asymptotic equivalence of the two modes of inference. From the right side of (3) Edgeworth concludes that the sampling distribution of ˆθ is asymptotically normal (θ, 1/i(θ)). Referring to Pearson and Filon (1898) he generalizes (3) to the multivariate case. In some examples for finite n he compares the posterior and the sampling distributions of estimates but does not reach a general result. Edgeworth points out that the posterior mode is noninvariant to parameter transformations. However, limiting himself to large-sample theory he remarks that this fact is of no importance, because ordinary transformations are nearly linear in a 1 neighbourhood of ˆθ of order n− 2 . For large n he introduces the “genuine inverse method”, which may be summarized as follows: 1. Use a uniform distribution for the parameters in the model regardless of the parameterization chosen.
64 10.3. Edgeworth’s genuine inverse method, 1908 and 1909 2. Maximize the joint posterior distribution to find the estimates. This rule combined with the one above obviously lead to the maximum likelihood estimates. 3. The distribution of the parameters is multivariate normal with the posterior mode as mean and the inverse of the observed information matrix as dispersion matrix. 4. Interchanging the roles of parameters and estimates, it follows that the sampling distribution of the estimates is multivariate normal with the parameters as means and the inverse of the expected information matrix as dispersion matrix. 5. The posterior mode minimizes the posterior expected squared error. Edgeworth’s imposing work thus completes the large-sample theory of statistical inference by inverse probability initiated by Laplace. Moreover, he establishes the equivalence of estimation theory based on posterior distributions and sampling distributions.
CHAPTER 11
Criticisms of inverse probability 11.1. Laplace Perhaps the strongest criticisms of inverse probability, although indirect, is implied by the fact that Laplace after 1811 and Gauss after 1816 based their theory of linear minimum variance estimation on direct probability. Nevertheless inverse probability continued to be used, only few of the critics went so far as to reject the theory completely. Some doubt about the principle of indifference can be found in the early work of Laplace. Poisson (1837) is critical, and the principle is rejected by Cournot (1843) as being arbitrary and subjective. Laplace distinguishes between constant and variable causes. For the urn model the constant cause is the ratio of white to black balls, and the variable causes are the numerous circumstances in connection with the drawing of a ball which determine the outcome. Hence, when Laplace speaks of the probability of causes he means constant causes. Poisson (1837, §§ 27 and 63) points out that this usage differs from the one ordinarily used when discussing causality; in probability theory, he says, we consider a cause, relative to an event, as being the thing which determines the chance for the occurrence of the event; the cause can be a physical or a moral thing. Likewise, de Morgan (1838, p. 53) writes: “By a cause, is to be understood simply a state of things antecedent to the happening of an event, without the introduction of any notion of agency, physical or moral.” We have followed de Morgan by using the term inverse probability for the topic which in French and German literature is called the probability of causes. Laplace states that the assessment of probability depends partly on our knowledge and partly on our ignorance. In case of perfect knowledge, which is unattainable for human beings, an event follows with certainty from its cause, an axiom known as the principle of sufficient reason. In case of complete ignorance Laplace asserts that equal probabilities must be assigned to each of the possible alternatives, an axiom later called the principle of insufficient reason or indifference. However, in most cases some knowledge of the subject matter exists but Laplace does not succeed in formulating a rule for utilizing this information. We shall discuss some of his examples. Assuming that the probability of heads is uniformly distributed on [(1−α)/2, (1+ α)/2], 0 < α ≤ 1, Laplace (1774, § 6) finds that the probability of getting n heads in succession equals 1 α
Z
(1+α)/2
(1−α)/2
1 θ dθ = α (n + 1) n
µ ¶n+1 1 [(1 + α)n+1 − (1 − α)n+1 ]. 2 65
66 11.1. Criticisms of inverse probability. Laplace Setting α = 1 he gets 1/(n + 1), and for α → 0 the classical result ( 12 )n is obtained. Laplace remarks that the probability of getting two heads equals 14 +α2 /12, which gives 14 +1/300 if we are sure that the bias of the coin is at most 0.1. In the same paper he also uses a two-point prior symmetric about θ = 1/2. Hence, in his first paper on inverse probability he tries out three different priors for the binomial parameter, two of them covering only a part of the complete parameter space. For an ordinary coin it is known that the probability of heads is near 12 , but it is difficult to give this knowledge a precise expression in the form of a prior distribution. Presumably for this reason, and also to avoid subjectivity and obtain mathematical simplicity Laplace uses only the uniform prior in his following papers, for example in his analyses of the sex ratio at birth and of the death rate for a given age interval. An example of the misuse of the urn model and inverse probability is the problem of the rising sun, whose history has been analysed by Zabell (1989a). Hume had written that it is ridiculous to say that it is only probable for the sun to rise tomorrow. In an attempt to refute Hume, Price uses Bayes’s theorem to derive the posterior probability 1 P (θ > |n) = (2n+1 − 1)/2n+1 , 2 where θ is the probability of a sunrise and n denotes the number of sunrises observed. Buffon misunderstands this result by taking the probability to mean the probability for a sunrise tomorrow and by giving the odds as 2n to 1. In the Essai (TAP, 1814, p. XIII) Laplace corrects Buffon’s errors and remarks that the conditional probability for a sunrise tomorrow after the occurrence of n risings equals (n + 1)/(n + 2). However, as an astronomer he adds that the problem really is one of celestial mechanics and that at present nothing can stop the sun’s course so far as one can see. Laplace’s remarks imply (1) that the problem is one of “Newtonian induction”, not of probabilistic induction, since the analogy with the urn model is false, and (2) if the problem nevertheless is treated probabilistically it should be treated correctly. Laplace does not in this connection refer to his generalization of the rule of succession, which says that the conditional probability of getting m further successes after having got n successes equals (n + 1)/(n + m + 1). Hence, if m is large relative to n this probability is small. In his theory of estimation Laplace emphasizes that a point estimate should always be accompanied by its standard error so that it can be turned into an interval estimate. Similarly, in his large-sample theory of prediction he supplements the point predictor with its standard error. However, for small samples he uses the rule of succession without discussing the prediction interval. For example, he states blandly that having observed one success the probability of success in the next trial equals P (S2 |S1 ) = E(θ|1) = 2/3.
Since the conditional density value √ of θ in this case equals 2θ the most probablen+1 of θ is unity, the median is 1/ 2, the average 2/3, and P (θ > α|1) = 1− α , so the prediction interval becomes 0.1 ≤ θ ≤ 1 for a credibility of 0.99. Similarly we have E(θ|n) = (n + 1)/(n + 2) and P (θ > α|n) = 1 − αn+1 , so for n = 10, say, the point predictor is 0.92 and the prediction interval is [0.66, 1].
67 11.2. Criticisms of inverse probability. Poisson The rule of succession is one of the most conspicuous and easily understandable results of Laplace’s theory of inverse probability and it therefore became a target for philosophers and frequentists in their attempt to discredit the theory. However, the critics did not take the uncertainty of the prediction into account and they did not contrast the rule of succession with an alternative frequentist rule. It was not until much later that a frequentist rule was formulated based on the hypergeometric distribution which means that n + m + 1 in the denominator is replaced by n + m showing that the information provided by the uniform prior counts for one further observation. Laplace’s (a + 1)/(n + 2) is thus replaced by (a + 1)/(n + 1). 11.2. Poisson Poisson (1837, § 32) extends Laplace’s rule to a discrete prior. Consider an urn with N balls, some white and some black, and let the number of white balls, k say, be distributed uniformly on the integers from 1 to N. Let Sn denote the occurrence of n white balls in succession by drawings without replacement from the urn, 1 ≤ n ≤ N. Noting that N X k=1
k(n) = (N + 1)(n+1) /(n + 1),
k (n) = k(k − 1) · · · (k − n + 1),
we get the probability of a white ball in the next drawing as X P (Wn+1 |k, Sn )p(k|Sn ) P (Wn+1 |Sn ) = X X k(n) = {(k − n)/(N − n)}k(n) / X X = (N − n)−1 k(n) k(n+1) / = (n + 1)/(n + 2).
Poisson carries out the proof only for n = 1, that is, he finds P (W2 |W1 ) = 2/3, but the generalization is straightforward. He remarks that the result is independent of N and thus equal to Laplace’s rule. Poisson does not mention that a general proof, although more cumbersome, had been provided by Prevost and Lhuilier (1799). Zabell (1989a) has given an explanation of this remarkable result by means of exchangeability. Expressing k n as a linear combination of k(n) , k (n−1) , . . . , k (1) , it follows that for drawings with replacement we have n+1 P (Wn+1 |Sn ) = {1 + O(N −1 )}. n+2 Poisson finds 1 2 P (W2 |W1 ) = (1 + ). 3 2N Having thus founds P (W2 |W1 ) for a uniform prior corresponding to complete ignorance, Poisson remarks that knowledge of the process by which the urn is filled should be taken into regard. Suppose that we have a superpopulation, an urn containing N white and N black balls, and that two balls are chosen at random without replacement and put into another urn. From this subpopulation a ball is
68 11.3. Criticisms of inverse probability. Cournot drawn, which turns out to be white. Poisson shows that the probability of the second ball being white equals P (W2 |W1 ) =
1 1 N +1 = (1 − ), 2N + 1 2 2N − 1
which shows that a two-stage process with objective probabilities gives an essential different result than the rule of succession. He presents several more complicated examples of this type. 11.3. Cournot Cournot (1843, § 240) writes: “Nothing is more important than to distinguish carefully between the double meaning of the term probability, sometimes taken in an objective sense and sometimes in a subjective sense, if one wants to avoid confusion and errors in the exposition of the theory as well as in the applications.” He lives up to this program by giving a clear exposition of the analysis of binomially distributed observations by direct and inverse probability, respectively, in his Chapter 8. He characterizes precisely the difference between the applications of Bayes’s theorem in case of an objective two-stage model and the subjective model based on the principle of indifference. He (§ 93) points out that the rule of succession leads to results disagreeing with ordinary betting behaviour. Tossing a new coin and getting heads, nobody will bet two to one on getting heads in the next toss. Knowing that a woman at her first birth has born a boy, nobody will bet two to one that the next birth will give a boy. He remarks that one should attempt to estimate the probability in question by observing the relative frequency of a male second birth among cases with a male first birth. Application of the rule of succession leads to a “futile and illusory conclusion”. Cournot also distances himself from the applications of inverse probability to judicial decisions and evaluation of testimonies. As shown by Laplace the large-sample confidence and credibility limits for θ are the same. Referring to this result and to the fact that the confidence limits are independent of any hypothesis on θ, Cournot (§ 95) points out that it is only through this interpretation that the credibility limits “acquire an objective value”. He thus rejects inverse probability and interprets credibility intervals as confidence intervals, but lacking an adequate terminology to distinguish between the two concepts he naturally speaks of the probability of θ even if he does not consider θ as a random variable. In the same section he mentions that the inverse probability results hold whether the prior is uniform or not if only it is nearly constant in the neighbourhood of the observed relative frequency. For small samples he (§ 240) remarks that the results derived by inverse probability are illusory because they depend on subjective probabilities; they may be used for betting purposes but do not apply to natural phenomena.
69 11.4. Criticisms of inverse probability. Ellis, Boole and Venn 11.4. Ellis, Boole and Venn The British empirical school of probability, beginning with R. L. Ellis (1849) and J. Venn (1866), proposes to define probability as the limit of the relative frequency of a certain attribute in an infinite series of independent trials or observations under the same essential circumstances, see Venn (1888, p. 163). Venn (p. 74) maintains that “Experience is our sole guide”. From such a system the uniform prior based on the principle of indifference is obviously excluded. As another consequence the classical definition of probability as the ratio of the number of favourable cases to the total number of possible cases is abolished. Ellis considers Bernoulli’s proof of the law of large numbers as superfluous, it seems to him to be true a priori. Ellis and Venn fail to appreciate that Bernoulli’s starting point is the same as their own, namely the empirical fact that “the more observations that are taken, the less the danger will be of deviating from the truth”, J. Bernoulli (1713, p. 225). Beginning with games of chance Bernoulli formulates the classical definition of probability which he then proceeds to use also in his discussion of problems where it is impossible to speak of equally possible cases, that is, he tacitly extends the definition to cover series with stable relative frequencies. To test the stability of a series of relative frequencies, for example the yearly proportion of male births or the conviction rates in criminal trials, Poisson and Cournot use the standard error for binomial relative frequencies, thus providing an objective criterion for the applicability of the binomial model. Venn, however, presents a lengthy discussion of the characteristics which a series should possess for falling under his theory but does not indicate any objective method for reaching a conclusion. By means of examples Ellis and Venn criticize Price’s formula and Laplace’s rule of succession and conclude that the results obtained by inverse probability are illusory. G. Boole (1854, p. 363) writes about inverse probability that “It is, however, to be observed, that in al those problems the probabilities of the causes involved are supposed to be known a priori. In the absence of this assumed element of knowledge, it seems probable that arbitrary constant would necessarily appear in the final solution”. Writing Bayes’s formula as P (C|E) =
P (C)P (E|C) P (C)P (E|C) + P (C)P (E|C),
where C denotes the complement of C, he (p.367) concludes that the formula does not give a definite value of P (C|E) unless there be means for determining the values of P (C) and P (E|C). “The equal distribution of our knowledge, or rather of our ignorance [. . . ] is an arbitrary method of procedure,” (p. 370). He points out that other constitutions of the system of balls in the urn than the one assumed by Laplace lead to results differing from the rule of succession and gives examples of such constitutions. Hence, “These results only illustrate the fact, that when the defect of data are supplied by hypothesis, the solution will, in general, vary with the nature of the hypotheses assumed”, (p. 375). This conclusion had previously been reached by the actuary Lubbock (1830), who points out that Laplace’s assumption of a uniform prior for the probability of dying within a given age interval is at variance
70 11.5. Criticisms of inverse probability, Bing and von Kries with experience. He derives a prediction formula with dθ replaced by w(θ)dθ and proposes to use a polynomial density for θ. The criticisms of inverse probability advanced by Ellis, Venn, and Boole did not add essential new points of view to that given by Cournot but it helped to disseminate the message. However, judging from the reaction of Jevons (1877, pp. 256-257) the arguments were not considered as decisive: “It must be allowed that the hypothesis adopted by Laplace is in some degree arbitrary, so that there was some opening for the doubt which Boole has cast upon it (Laws of Thought, pp. 368-375). But it may be replied, (1) that the supposition of an infinite number of balls treated in the manner of Laplace is less arbitrary and more comprehensive than any other that can be suggested. (2) The result does not differ much from that which would be obtained on the hypothesis of any large finite number of balls. (3) The supposition leads to a series of simple formulas which can be applied with ease in many cases, and which bear all the appearance of truth so far as it can be independently judged by a sound and practiced understanding.” 11.5. Bing and von Kries Two further arguments against inverse probability were provided by the Danish actuary Bing (1879). First, Bing points out that by drawing a random sample from an urn containing an unknown number of black and nonblack balls the posterior probability for the number of black balls depends, according to the indifference principle, on whether we consider the content of the urn as black and nonblack or as black, white, and yellow, say. Hence, the solution depends critically on whether or not the hypotheses considered can be subdivided into hypotheses of a similar nature. Next, he considers an example by Laplace (TAP, II, § 30) on the posterior distribution of survival probabilities p(θ1 , θ2 |S), S denoting the sample and (θ1 ,θ2 ) the survival probabilities, independently and uniformly distributed on the unit interval a priori. Introducing the probabilities of dying, λ1 = 1 − θ1 and λ2 = θ1 (1 − θ2 ), Bing derives the density of (λ1 , λ2 ) for given S by multiplying p(θ1 , θ2 |S) by the absolute value of the Jacobian of the transformation. He points out that if Laplace had started from the probabilities of dying and assumed a uniform distribution of (λ1 , λ2 ) on the parameter space, which is the triangle 0 ≤ λ1 ≤ 1, 0 ≤ λ2 ≤ 1, 0 ≤ λ1 + λ2 ≤ 1, then he would have found a different result. He derives both formulas. Hence, the posterior distribution obtained depends on the parameterization of the model, and he concludes that in cases where nothing can be said for preferring one set of parameters for another the indifference principle leads to contradictory results. With hindsight we can see that Cournot and Bing between them produced all the arguments against inverse probability that have been advanced. However, their works were not widely read, and therefore the same arguments were later presented independently by many authors. We shall only mention a few.
71 11.6. Criticisms of inverse probability, Edgeworth and Fisher The German logician von Kries (1886) rediscovered Bing’s two arguments. He presents the second in a much simpler form by noting that if θ > 0 is uniform on a finite interval then 1/θ is non-uniform on the corresponding interval. Since it is often arbitrary in which way a natural constant is measured, the principle of indifference leads to contradictory results; for example, should specific gravity or specific volume be considered as uniformly distributed. Like Cournot he observes that the shape of the prior distribution matters only in a small interval about the maximum of the likelihood function. 11.6. Edgeworth and Fisher √ Edgeworth (1908, pp. 392 and 396) notes that if h = 1/σ 2 is uniformly distributed then the distribution of c = 1/h is non-uniform, and that the same argument applies to the correlation coefficient and its square. He remarks: “There seems to be here an irreducible element of arbitrariness; comparable to the indeterminateness which baffles us when we try to define a “random line” on a plane, or a “random chord”of a circle.” Nevertheless, he continues to use inverse probability, mainly because the good asymptotic properties of the estimates. Fisher (1922a) considers the binomial case with a uniform distribution of θ so that p(θ|a, n) ∝ θa (1 − θ)n−a , 0 < θ < 1. (1) Making the transformation it follows that since
sinλ = 2θ − 1, −π/2 ≤ λ ≤ π/2, 1
1
p(λ|a, n) ∝ (1 + sin λ)a+ 2 (1 − sin λ)n−a+ 2 , 1
1
(2)
dλ = θ− 2 (1 − θ)− 2 dθ. However, if λ had been assumed to be uniformly distributed the posterior density of λ is obtained from (1) by substituting (1 + sin λ)/2 for θ, the result being inconsistent with (2). In principle there is nothing new in Fisher’s example but nevertheless it had a great effect, because it was included in his revolutionary 1922 paper where he introduced maximum likelihood estimation, which is invariant to parameter transformation. The peaceful coexistence of direct and inverse probability in Edgeworth’s work was replaced by Fisher’s maximum likelihood method and his aggressive ideological war against inverse probability. More details on the history of the topics treated in the present chapter are given by Keynes (1921), Zabell (1989a, b), Dale (1991) and Hald (1998).
Part 3
THE CENTRAL LIMIT THEOREM AND LINEAR MINIMUM VARIANCE ESTIMATION BY LAPLACE AND GAUSS
CHAPTER 12
Laplace’s central limit theorem and linear minimum variance estimation 12.1. The central limit theorem, 1810 and 1812 It is a remarkable fact that Laplace simultaneously worked on statistical inference by inverse probability, 1774-1786, and by direct probability, 1776-1781. In 1776 he derived the distribution of the arithmetic mean for continuous rectangularly distributed variables by repeated applications of the convolution formula. In his comprehensive 1781 paper he derived the distribution of the mean for independent variables having an arbitrary, piecewise continuous density. As a special case he found the distribution of the mean for variables with a polynomial density, thus covering the rectangular, triangular and parabolic cases. In principle he had solved the problem but his formula did not lead to manageable results because the densities then discussed resulted in complicated mathematical expressions and cumbersome numerical work even for small samples. He had thus reached a dead end and it was not until 1810 that he returned to the problem, this time looking for an approximative solution, which he found by means of the central limit theorem. Let xi , i = 1, 2, . . . , be a sequence of independent random variables with E(xi ) = µi and V (xi ) = σ 2i . According to the central limit theorem the distribution of the sum sn = x1 + · · · + xn converges to the normal distribution as n → ∞ under certain conditions. For the versions considered by Laplace and Poisson the conditions are that the distribution of xi has finite support and is nondegenerate. Hence, σ 2i is bounded away from zero and infinity, that is, there exist constants independent of i such that 0 < m < σ 2i < M < ∞ for all i. (1) It follows that V (sn ) is of order n and max
1≤i≤n
σ 2i
/
n X i=1
σ 2i → 0, as n → ∞.
(2)
In the first version of the theorem, proved by Laplace (1810, 1812), it is assumed that the variables are identically distributed with expectation µ and variance σ 2 . The distribution of sn is then asymptotically normal (nµ, nσ 2 ) so that √ (xn − µ) n sn − nµ √ = (3) un = σ n σ is asymptotically normal (0,1), where xn = sn /n. It follows that ¡ √ ¢ √ P (|xn − µ| ≤ ) ∼ = Φ(ε n/σ) − Φ −ε n/σ → 1, as n → ∞. 75
(4)
76 12.1. Laplace’s central limit theorem, 1810 and 1812 If xi is binomial (1, p), 0 < p < 1, then σ 2 = p(1 − p) and Bernoulli’s law of large numbers and de Moivre’s normal approximation to the binomial are obtained. Laplace remarks that the theorem holds also for distributions with infinite support since the bounds for xi enter the result through σ 2 only. As usual, his intuition was later proved right. It is, of course, a remarkable result that sn is asymptotically normal regardless of the distribution of the x0 s, if only σ 2 is bounded away from zero and infinity. Not only the theorem but also the tool for proving it, namely the characteristic function and its inversion, are epoch-making. Laplace (1810a, §§ 3 and 6; 1812, II, §§ 18 and 22) defines the characteristic function as ψ(t) = E(eixt ) = 1 + iµ01 t − µ02 t2 /2! + . . . , µ0r = E(xr ),
(5)
from which he gets ln ψ (t) = iµ01 t − σ 2 t2 /2! + . . . , σ 2 = µ02 − µ02 1.
(6)
Since the characteristic function for sn equals ψn (t) the expansion of its logarithm equals n ln ψ(t). The problem is to find the frequency function of sn from the characteristic function. P Laplace assumes that x takes on the integer value k with probability pk , pk = 1, so that X ψ(t) = pk exp(ikt). Using the fact that
1 2π
Z
π
exp(ikt)dt =
−π
½
0, k = 6 0, 1, k = 0,
he gets the inversion formula 1 2π
Z
π
exp(−ikt)ψ(t)dt = pk .
(7)
−π
It follows that
Z π 1 1 P (sn = + s) = exp( − ist − nσ 2 t2 + . . .)dt 2π −π 2 1 ∼√ exp(−s2 /(2nσ 2 )), 2πnσ nµ01
neglecting terms of smaller order of magnitude. Hence, sn −nµ01 is asymptotically normal (0, nσ 2 ), so the arithmetic mean x is asymptotically normal (µ01 , σ 2 /n). Since the characteristic function for wy, w being P an arbitrary real number, equals ψ(wt) Laplace finds that the linear combination wj xj with integers as coefficients P P is asymptotically normal with mean µ01 wj and variance σ 2 wj2 . To prove the corresponding result for the continuous case, Laplace approximates the continuous density function by a discrete function with equidistant arguments. However, the limit process is unsatisfactory, an improved version was provided by Poisson (1824).
77 12.2. Linear minimum variance estimation, 1811 and 1812 Let ε1 , . . . , εn be independently and identically distributed errors with zero mean and variance σ 2 and consider two linear combinations z1 = [w1 ε] and z2 = [w2 ε]. By means of the characteristic function ψ(t1 , t2 ) = E{exp(iz1 t1 + iz2 t2 )} and the same method of proof as above Laplace (1811a) shows that the asymptotic distribution of (z1 , z2 ) is bivariate normal with zero means and covariance matrix σ 2 W, W = {[wr ws ]}, r = 1, 2, so p(z) =
1 2πσ 2
|W |
1/2
exp(−z 0 W −1 z/2σ 2 ),
z 0 = (z1 , z2 ).
(8)
The generalization to the multivariate normal is obvious. Laplace also finds the characteristic functions for the normal and the Cauchy distributions. The central limit theorem and its use for constructing a large-sample theory of estimation for the parameters in the linear model is Laplace’s second revolutionary contribution to probability theory and statistical inference. It is remarkable that he in 1774, 25 years old, created the theory of inverse probability, and that he, 61 years old, created a frequentist theory of estimation which he preferred for the previous one. The central limit theorem has ever since been the foundation for the large-sample theory of statistical inference. 12.2. Linear minimum variance estimation, 1811 and 1812 Laplace found Gauss’s probabilistic justification of the method of least squares unsatisfactory because it assumes that the observations are normally distributed and uses the posterior mode as estimate because the method of least squares then follows. Laplace maintains that the best estimate of the location parameter is the one minimizing the expected estimating error E(|ˆθ − θ|) for all θ. This is the same criterion as used in 1774 but now in a frequentist setting. Moreover he considers only linear combinations of observations as estimates because it is impractical to use other functions when the number of observations and the number of parameters are large. Since linear estimates are asymptotically normal and the expected estimating error then is proportional to the standard error the best estimate is the one having minimum variance. For the simple linear model yi = βxi + εi ,
i = 1, . . . , n,
Laplace considers the linear combination [wy] = β[wx] + [we]. Setting ε1 = · · · = εn = 0 and solving for β he obtains the estimate β˜ = [wy]/[wx],
78 12.2. Linear minimum variance estimation, 1811 and 1812 which according to the central limit theorem is asymptotically normal with mean β and variance σ 2 [ww]/[wx]2 , so 1 µ ¶ 12 2 [ww] 2 . σ E(|β˜ − β|) = π [wx]
Setting the logarithmic derivative of this expression with respect to wi equal to zero Laplace finds that wi = cxi for all i. Hence, the best linear estimate is b = [xy]/[xx], which is asymptotically normal with mean β and variance σ2 /[xx]. As a corollary he remarks Pthat b may be obtained by minimizing the sum of the squared observational errors (yi −βxi )2 so that the method of least squares leads to the best large-sample estimate whatever be the error P distribution if only its moments are finite. He proposes to estimate σ 2 by s2 = (yi − bxi )2 /n so that the confidence 1 limits for β are b ± us[xx]− 2 . For x1 = · · · = xn = 1, the best estimate of β is the arithmetic mean. For the linear model with two parameters yi = β 1 xi1 + β 2 xi2 + εi ,
i = 1, . . . , n,
Laplace (1811a, § 8; 1812, II, § 21) introduces two linearly independent vectors of coefficients which give the estimating equations [w1 y] = [w1 x1 ]β 1 + [w1 x2 ]β 2 + [w1 ε],
(1)
[w2 y] = [w2 x1 ]β 1 + [w2 x2 ]β 2 + [w2 ε]. Setting ε1 = · · · = εn = 0 and solving for (β 1 ,β 2 ) Laplace obtains the class of linear estimates, (β˜ 1 ,β˜ 2 ) say, within which he seeks the one with minimum variance. It will be seen that he here without discussion, as in the one-parametric case, introduces the (obvious) restriction that the estimate should equal the true value if the observations are without error, a restriction that implies unbiasedness. Gauss uses the same restriction, and Sprott (1978) proposes to call it “error-consistency.” Let us denote the matrix of coefficients in (1) by A and the linear combinations of errors by z 0 = (z1 , z2 ). Eliminating [w1 y] and [w2 y] Laplace obtains the equation Aβ ˜ = p(z|A). From (8) Laplace finds by the substitution +z = Aβ˜ and proves that p(β) z = A(β˜ − β) that ˜ = p(β)
|A|
1 2
exp{−(β˜ − β)0 A0 W −1 A(β˜ − β)/2σ 2 },
2πσ 2 |W | from which he obtains the marginal distribution |A| p(β˜ 1 ) = exp{− |A|2 (β˜ 1 − β 1 )2 /2σ 2 H}, 2 1/2 (2πσ H) H = a212 w22 − 2a12 a22 w12 + a222 w11,
and
(2)
µ ¶ 12 √ H 2 E|β˜ 1 − β 1 | = σ . (3) π |A| To minimize the mean error of√estimation with respect to w1 and w2 , Laplace sets the logarithmic derivative of H/ |A| equal to zero from which he finds that
79 12.3. Asymptotic relative efficiency of estimates, 1818 the optimum values of w1 and w2 are proportional to x1 and x2 , respectively. Hence, W = A and the distribution of the best estimate equals 1
|A| 2 p(b) = exp(−(b − β)0 A(b − β)/2σ 2 ), A = X 0 X. (4) 2πσ 2 Replacing w1 and w2 by x1 and x2 the equations (1) become the normal equations, so the best estimate equals the least squares estimate. Laplace remarks that this analysis can be extended to any number of parameters. He is mainly interested in the marginal distributions and gives a recursion formula for finding the variances, presenting explicit expressions for three and four parameters. Lacking an adequate notation his formula is complicated; in matrix notation it may be written as V (br ) = σ 2 Arr / |A| , r = 1, . . . , m, where Arr denotes the cofactor of arr It is clear that Laplace’s asymptotic results hold for all n if the observations are normally distributed. However, Laplace does not discuss this case because he, when the distribution is known, would have used inverse probability, which would have led him to the solution given by Gauss (1809) although from another point of view. Under normality direct and inverse probability lead to the same limits for β. The method of least squares and the method of maximizing the posterior density are intuitively appealing. However, we owe to Laplace the fundamental observation that the justification of these methods depends on the properties of the estimates, that is, on the distribution of the error of estimation. 12.3. Asymptotic relative efficiency of estimates, 1818 Laplace discusses asymptotic efficiency in the last section of the Second Supplement (1818) to the TAP. For the linear model he remarks that whatever method is used for solving the equations leading to the class of linear estimates the result is that β˜ 1 , say, is expressed in the form (1) β˜ 1 = [k1 y] = [k1 x1 ]β 1 + . . . + [k1 xm ]β m + [k1 ε]. Choosing [k1 x1 ] = 1,
[k1 x2 ] = . . . = [k1 xm ] = 0,
(2)
he obtains β˜ 1 = β 1 + [k1 ε] and V (β˜ 1 ) = σ 2 [k1 k1 ], where k1 depends on the w’s and the x0 s, see (12.2.1). For m = 2 he finds V (β˜ 1 ) = σ 2 H/ |A|2 ,
which is a simple alternative proof of (12.2.2). The asymptotic efficiency of β˜ 1 relative to b, the least squares estimate, is thus equal to the ratio of the corresponding values of H/|A|2 . Laplace derives the efficiency for two special cases in which the coefficients k1 , . . . , km are chosen such that the estimates are simpler to calculate than the least squares estimates.
80 12.3. Asymptotic relative efficiency of estimates, 1818 Finally, Laplace compares his modification of Boscovich’s nonlinear estimate with the best linear estimate for the model yi = βxi + εi ,
xi > 0, i = 1, ..., n,
assuming that the equations have been ordered such that y1 y2 yn > ... > . x1 x2 xn ˜ say, is defined as the value of β minimizing The estimate β, X yi X xi | − β|, |yi − βxi | = xi so β˜ = yk /xk where k is determined by the inequalities k−1 X
xi
1
k
n X
xi .
k+1
Today this estimate is called the weighted median; the median is obtained for x1 = · · · = xn = 1. From the equation vk = βxk + εk it follows that the error of estimation equals v = εk /xk , which for convenience is supposed to be positive. Since εj /xj ≶ v for j ≶ k, Laplace finds the density of v as p(v) ∝
k−1 Y 1
[1 − F (xj v)]
n Y
F (xj v)f (xk v),
k+1
where f denotes the density and F the distribution function of the ε’s. Assuming that f is symmetric about zero and using Taylor-expansions of f, F , and ln p(v), Laplace proves that v is asymptotically normal with zero mean and variance equal to 1/(4f 2 (0)[xx]). Hence, the efficiency of the weighted median relative to the best linear estimate is 4f 2 (0)σ 2 . Laplace concludes that the “method of situation” is preferable to the method of least squares if [2f (0)]2 > σ −2 . He notes that for normally distributed observations the efficiency of the weighted median is 2/π. Next, Laplace takes the remarkable step of investigating the joint distribution of b and β˜ to find out whether a linear combination of the two will give a better estimate than b. Setting z=
k−1 X 1
xj εj + xk εk +
n X
xj εj ,
k+1
he finds the characteristic function for z and v, from which he derives p(z, v). Using that u = b − β = z/[xx] he proves that the joint distribution of (u, v) is asymptotically normal with zero mean and µ(1) σ2 1 σ2v = σ uv = . σ 2u = 2 [xx], 4[xx]f (0), 2[xx]f (0) He writes the quadratic form in the exponent of p(u, v) in the two ways that exhibit the two marginal and conditional distributions. Making the transformation
81 12.4. Generalizations of the central limit theorem t = (1 − c)u + cv, he proves that the minimum of V (t) is obtained for 2f (0)σ 2 (2f (0)σ 2 − µ(1) ) c= 2 , σ − µ2(1) + (2f (0)σ 2 − µ(1) )2
and that min V (t) = V (u) c
σ 2 − µ2(1)
σ 2 − µ2(1) + (2f (0)σ 2 − µ(1) )2
.
Laplace concludes that if f (ε) is known and if 2f (0)σ2 6= µ(1) then we can find ˜ will be better than b. He points out that 2f (0)σ2 = c and the estimate b − c(b − β) µ(1) for the normal distribution so in this case b cannot be improved. Stigler (1973) has compared Laplace’s paper with Fisher’s 1920 paper in which he introduces the concept of sufficiency. Fisher assumes that the observations are normally distributed and proves that s1 and s2 are asymptotically normal, that the efficiency of s1 relative to s2 is 1/(π − 2), and that s2 is the best estimate of σ 2 among the moment estimates. He did not know that Gauss (1816) had proved these results. Neither did he known that Laplace (1818) had observed that a full comparison of the properties of two competing estimates has to be based on their joint distribution. However, as pointed out by Stigler, Fisher took two essential steps more than Laplace. He investigated p(s1 , s2 ) for a finite value of n, in case n = 4, and showed that p(s1 |s2 ) is independent of σ 2 and that the same property holds also for s3 , s4 ,. . . . Fisher concludes that “The whole of the information respecting σ 2 , which a sample provides, is summed up in the value of σ 22 [s2 ]. This unique superiority of σ 22 is dependent on the form of the normal curve,. . . .” The term sufficiency was introduced in his 1922 paper. 12.4. Generalizations of the central limit theorem There are two lines of research on the central limit theorem. The one develops conditions, as weak as possible, for the theorem to hold, and the second extends the theorem by considering the normal distribution as the main term of a series expansion. As an example of the first method we shall state a theorem due to J. W. Lindeberg (1922). Let x1 , x2 , . . . be independent with distribution functions F1 (x), F2 (x), . . . , E(xi ) = 0 and V (xi ) = σ 2i . Setting γ 2n = σ 21 + · · · + σ 2n and assuming that n Z X −2 γn x2 dFi (x) → 1, for each t > 0, 1
|x| 0, he finds ∇j f (x) = f (x)Pj (x),
where
j = 0, 1, . . .
µ ¶ j X k j λ−k x(k) , (−1) Pj (x) = k k=0
(10)
x(k) = x(x − 1) · · · (x − k + 1), k ≥ 1, and x(0) = 1. Instead of the ordinary moments he introduces the binomial ¡ ¢ moments, which we shall denote by α and β, respectively. Multiplying (9) by xr and summing over x, he gets r X β rj cj , r = 0, 1,. . . (11) αr = j=0
where
X µx¶ αr = g(x) r x
and β rj
X µx¶ = ∇j f (x) = (−1)j λr−j /(r − j)!, j = 0, 1, . . . , r. r x
(12)
Hence, the matrix of coefficients in (11) is lower triangular, and solving for cr , Lipps gets r X (−1)j [(r − j)!]−1 λr−j αj . (13) cr = j=0
Looking at Lipp’s proof from the Thiele-Gram point of view, it will be seen that Lipp’s series may be written as ∞ X g(x) = f (x) cj Pj (x). j=0
106 15.2. Series expansions of frequency functions Ch. Jordan (1926) proves that the P 0 s are orthogonal, X Pj (x)Pk (x)f (x) = 0 for j 6= k, x
and
X
Pj2 (x)f (x) = r!λ−r .
x
Using the orthogonality, it follows that 1 X cr = λr Pr (x)g(x), r! x which by means of (10) immediately gives Lipp’s result (13). Steffensen looks at the problem of series expansion of frequency functions from a purely statistical point of view. He (1930) writes: “We are therefore of opinion that the labour that has been expended by several authors in examining the conditions under which the Aseries is ultimately convergent, interesting as it is from the point of view of mathematical analysis, has no bearing on the question of the statistical applications.” The statistical problem is, he says, to fit a frequency function, gm (x) say, containing m parameters to a sample of n observations, m < n, and therefore the series has to be finite. Moreover, gm (x) should be a probability distribution, that is, it should be non-negative and its sum or integral over the whole domain should be unity. As an expert in the calculus of finite differences he derives a formula for gm (x) as a linear combination of the differences of f (x) up to order m, the differences being defined as ∇α f (x) = [f (x) − f (x − α)]/α. The B series then follows for α = 1 and the A series for α → 0. Steffensen concludes: “There are, however, considerable drawbacks. We cannot, as with Pearson’s types, be sure beforehand that negative values will not occur; as a matter of fact they often do occur, and this can only be ascertained at the end of the calculation. We have not even very good reason to expect that by adding another term such negative value will be made to disappear. (. . . ) We are therefore inclined to think that the apparent generality of (28) [his general formula, containing the A and B series] is rather a disadvantage than otherwise, and that Pearson’s types are as a rule preferable.” Considering the normal A series based on the first four moments, Barton and Dennis (1952) have determined the region in which, as functions of the moments, the series in non-negative.
107 15.3. Biography of Karl Pearson 15.3. Biography of Karl Pearson The life of Karl Pearson (1857-1936) may be divided into three periods: before 1892, 1892-1922 and after 1922. He was born in London as the son of a barrister and studied mathematics in Cambridge 1875-1879. He got a fellowship of King’s College, which made him financially independent for a number of years and which he used for travelling and studying. In Germany he studied physics, metaphysics, Darwinism, Roman law, German folklore and German history, in particular the history of the Reformation. He also studied law in London and was called to the bar in 1881, but he practiced only for a short time. Pearson rebelled against the norms of Victorian society by being a freethinker, a socialist, a Darwinist and a supporter of eugenics and feminism. Besides lecturing and writing on these matters, he produced a large number of books and papers on pure and applied mathematics and physical science. In 1884 he became professor of applied mathematics and mechanics at University College London, and from 1891 to 1894 he also lectured at Gresham College, which resulted in The Grammar of Science (1892) in which he expounded his views on the fundamental concepts of science. This marks the end of the first period of his scientific life. Under the influence of Galton and Weldon, a drastic change in Pearson’s scientific interests took place about 1892. But how could an applied mathematician, who knew next to nothing on statistical methods, help Weldon with the analysis of zoological data with the purpose to elucidate Darwin’s theory of evolution? At the age of 35 Pearson began to educate himself in mathematical statistics, at the same time analysing Weldon’s data and developing new methods with an astounding energy and speed. He read a number of continental textbooks on social and demographic statistics, among them H. Westergaard’s Die Grundzüge der Theorie der Statistik (1890), which he considered the best on the relation between statistics and probability. Westergaard had parameterized the normal approximation to the √ binomial by means of npq, Pearson (1894, p. 80) did the same and introduced the term “standard deviation.” In his first statistical papers Pearson derives the moments of the binomial and dissects an asymmetrical frequency curve into two normal curves. However, the two models are too limited in scope and, like Chebyshev, Fechner, Thiele and Gram, Pearson felt the need for a collection of continuous distributions for describing the biological phenomena he was studying. He wanted a system embracing distributions with finite as well as infinite support and with skewness both to the right and the left. The breakthrough came with his famous paper Skew variation in homogeneous material (1895) in which he derived the four-parameter system of continuous densities, that we discuss in the next section. Another breakthrough is his (1900) derivation of the χ2 test for goodness of fit, which we shall discuss in § 5. He (1903) wrote a useful survey “On the Probable Errors of Frequency Constants”, which indicates his conversion from inverse probability, see Pearson and Filon (1898), to the frequentist theory.
108 15.3. Biography of Karl Pearson His lifelong studies on the theory of correlation and regression with applications to heredity, eugenics and biology begin with Regression, heredity and panmixia (1896), another important memoir in this series is On the general theory of skew correlation and non-linear regression (1905). In parallel he developed a theory of multiple contingency, beginning with On the theory of contingency and its relation to association and normal correlation (1904). It is characteristic for all his papers that the theory is illustrated by a wealth of applications to anthropological, biological and demographic data. However, in many cases the examples illustrate the application of the new statistical techniques rather than contributing to a deeper understanding of the subject matter in question. To further the applications of his methods, he published auxiliary tables of statistical functions in Biometrika. Important collections of such tables are Tables for Statisticians and Biometricians, Part I (1914) and Part II (1931), with introductions on their use. Further he edited Tables of the Incomplete Γ -Function (1922), Tables of the Incomplete Beta-Function (1934) and a series of Tracts for Computers, beginning in 1919. His burden of work was enormous. He founded and edited Biometrika, A Journal for the Statistical Study of Biological Problems (1901) together with Weldon and in consultation with Galton, he lectured on mathematical statistics and he founded a Biometric Laboratory. In 1906 he also took over Galton’s Eugenics Laboratory. Finally, in 1911 he was relieved of his duties as professor of applied mathematics by becoming the first Galton professor of eugenics and head of a Department of Applied Statistics to which his Biometric and Eugenics Laboratories were transferred. Between 1892 and 1911 he thus created his own kingdom of mathematical statistics and biometry in which he reigned supremely, defending its ever expanding frontiers against attacks. He retired in 1934, but about 1922 he was succeeded by Fisher as the leading British statistician. Among Pearson’s many contributions after 1922 are the completion of a biography of Galton and The History of Statistics in the 17 th and 18 th Centuries against the changing background of intellectual, scientific and religious thought, edited by E. S. Pearson (1978). It is a valuable companion to Todhunter’s History. In this period he also founded and edited the Annals of Eugenics from 1925. An annotated Bibliography of the Statistical and Other Writings of Karl Pearson (1939) is due to G. M. Morant with the assistance of B. L. Welsh. It contains 648 items, 406 are on the theory of statistics and its applications. Pearson was not a great mathematician but he effectively solved the problems head-on by elementary methods. His proofs are detailed and lengthy. He was a fighter who vigorously reacted against opinions that seemed to detract from his own theories. Instead of giving room for other methods and seeking cooperation his aggressive style led to controversy. The most comprehensive biography, Karl Pearson: An Appreciation of Some Aspects of his Life and Work is due to his son E. S. Pearson (1938), who later (1965, 1967, 1968) wrote on important aspects of the history of biometry and statistics in the period in question. A survey mainly of Pearson’s statistical work is due to Eisenhart (1974); MacKenzie (1981) discusses Pearson’s life and work in a social context.
109 15.4. Pearson’s system of continuous distributions, 1895 Pearson has been unduly criticized by the following generation, see Fisher (1956, pp. 2-4). A more balanced view is expressed at the end of E. S. Pearson’s biography: “but having himself provided a mathematical technique and a system of auxiliary tables, by ceaseless illustration in all manner of problems he at least convinced his contemporaries that the employment of this novel calculus [of mathematical statistics] was a practical proposition. From this has resulted a permanent change which will last, whatever formulae, whatever details of method, whatever new conceptions of probability may be employed by coming generations in the future.” 15.4. Pearson’s four-parameter system of continuous distributions, 1895 Pearson defines the moments as µ0r = E(xr ), and
r = 0, 1, . . . , µr = E[(x − µ01 )r ], r = 2, 3, . . .
β 1 = µ23 /µ32 , β 2 = µ4 /µ22 , β 3 = µ3 µ5 /µ42 . He derives the normal distribution from the symmetric binomial µ ¶ µ ¶n n 1 , p(x) = 2 x
by calculating the relative slope of the frequency curve S=
x + 12 − 12 n p(x + 1) − p(x) = − , 1 (n + 1)/4 [p(x + 1) + p(x)] 2
from which he concludes that the corresponding continuous distribution satisfies the differential equation x − 12 n d ln p(x) =− . dx n/4 The solution is the normal distribution with mean n/2 and variance n/4. A similar proof is due to Hagen (1837) and Westergaard (1890). Pearson then analyses the skew binomial and the hypergeometric distribution in the same way. For the latter he finds µ ¶ n (Np)(x) (Nq)n−x p(x) = , (1) x N (n) which gives
1 − µ), 2 where µ, β 1 , β 2 and β 3 are constants depending on the parameters of (1). Hence, the corresponding continuous density satisfies a differential equation of the form S = −y/(β 1 + β 2 y + β 3 y 2 ),
y = (x +
d ln p(x) x−α . =− dx β 1 + β 2 x + β 3 x2
(2)
The solution depends on the sign of β 22 −4β 1 β 3 , and Pearson discusses in great detail the resulting distributions which he classifies into several types.
110 15.4. Pearson’s system of continuous distributions, 1895 We shall give a summary of his results based on Elderton (1938), which is the standard text on this topic. Writing p for p(x), Pearson’s system is based on the differential equation x+a d ln p(x) = . dx b0 + b1 x + b2 x2
(3)
It follows that xr (b0 + b1 x + b2 x2 )p0 = xr (x + a)p, which after integration gives −b0 µ0r−1 − (r − 1)b1 µ0r − (r + 2)b2 µ0r+1 = µ0r+1 + aµ0r , r = 0, 1, . . .
(4)
b0 + b1 x + b2 x2 = 0,
(5)
r
2
under the assumption that x (b0 + b1 x + b2 x )p vanishes at the endpoints of the support for p. Hence, there is a one-to-one correspondence between a, b0 , b1 , b2 and the first four moments, so p is uniquely determined from the first four moments. The solution depends on the roots of the equation i.e. on
b21 /4b0 b2 ,
which expressed in terms of the moments gives the criterion
β 1 (β 2 + 3)2 . (6) 4(2β 2 − 3β 1 − 6)(4β 2 − 3β 1 ) Pearson distinguishes between three main types depending on whether κ < 0, 0 < κ < 1, or κ > 1. In the first case the roots of (5) are real and of different sign, in the second the roots are complex, and in the third they are real and of the same sign. The corresponding distributions are Pearson’s Types I, IV and VI. Besides the main types he derives a number of transition types for κ = 0 and κ = 1 among them the normal and the gamma distribution. The value of κ, i.e. of (β 1 ,β 2 ), thus determines the type. A survey of the resulting system is shown in the following table. κ=
Type Equation ³ I y = y0 1 +
Table of Pearson’s Type I to VII distributions Limits for x ´m ³ ´m Origin for x x Mode −a1 ≤ x ≤ a2 1 − ax2 a1
II
x2 a2
³ y = y0 1 −
´m
Criterion κ1
Mean(=mode)
κ=0
VII
−1
³ y = y0 1 +
x2 a2
x/a (1 + x2 )−m a2
´−m
−∞ < x < ∞,
Source: E. S. Pearson and H. O. Hartley (1954, p. 79), slightly modified.
111 15.5. Pearson’s χ2 test for goodness of fit, 1900 The empirical moments based on a sample of n observations are defined as n n 1X r 1X 0 xi , r = 0, 1, ..., and mr = (xi − m01 )r , r = 2, 3, . . . mr = n i=1 n i=1
They are unbiased estimates of the theoretical moments. Pearson estimates the parameters in his distributions by the method of moments, which consists in setting m0r = µ0r for r = 1, 2, 3, 4, and solving for the parameters. Pearson ends the paper by fitting his distributions to a variety of data ranging from meteorology, anthropometry, zoology, botany, economics, demography and to mortality statistics, a total of 15 examples. Hence, he not only provided a new collection of distributions, he also demonstrated their ability to fit actual data. It turned out, however, that the paper also raised many problems which were solved gradually during the next 30 years or so. We shall mention the most important. (1) How can the goodness of fit be measured objectively? Pearson (1900) solves this problem by deriving the χ2 goodness of fit test, to be discussed in the next section. (2) How does grouping affect the moments? Let λ2 , λ3 , . . . be moments about the mean for a grouped distribution with a grouping interval of length h. By means of a relation between integrals and sums, Sheppard (1898) proves that µr with good approximation may be obtained from λr by the following corrections: µ2 = λ2 − h2 /12, µ3 = λ3 − λ1 h2 /4, µ4 = λ4 − λ2 h2 /2 + 7h4 /240, where λ1 = µ01 , see Hald (2001) for the history of this topic. (3) Is the method of moments an efficient method of estimation? Fisher (1922a) shows that this is not so in general, and as an example he proves that for symmetric Pearson distributions the method of moments has an efficiency of 80 per cent. or more if β 2 lies between 2.65 and 3.42, whereas outside this interval the efficiency is lower. For the normal distribution β 2 = 3 and the efficiency is 100 per cent. (4) Steffensen (1923, 1930) points out that there is no probabilistic interpretation of Pearson’s differential equation because the restrictions on the parameters of the hypergeometric are not carried over to Pearson’s parameters. He gives a probabilistic interpretation of Pearson’s Type I based on a roulette experiment and shows that the other types, apart from Type IV, can be derived from Type I. (5) What is the purpose of fitting a Pearson distribution to empirical data? Pearson does not discuss this problem, he is content with the fact that a good graduation is obtained. However, the advantage of characterizing the data by a few estimated parameters becomes obvious when several sets of data of the same kind are to be compared. The standard error of the moments required for this purpose was provided by Sheppard (1899). 15.5. Pearson’s χ2 test for goodness of fit, 1900 In the first part of Pearson’s (1900) paper on the χ2 test, he assumes that the kdimensional random variable z is multivariate normal with mean zero and dispersion matrix D so that 1 p(z) ∝ exp ( − z 0 D−1 z). 2
112 15.5. Pearson’s χ2 test for goodness of fit, 1900 He remarks that χ2 = z 0 D−1 z represents a generalized ellipsoid in the sample space and that P (χ > χ0 ) may be found by integrating p(z) over the corresponding region. He notes that the ellipsoid by a linear transformation may be turned into a sphere so that R R 2 . . . e−χ /2 dt1 . . . dtk χ