statistical models for both the background and the anomalies [1, 2]. Statistical ..... IEEE Transcactions on Geoscience and Remore Sensing, vol. 36, no. 2, pp.
ANOMALY DETECTION IN THREE DIMENSIONAL DATA BASED ON GAUSS MARKOV RANDOM FIELD MODELING Amir Noiboar and Israel Cohen Technion - Israel Institute of Technology Department of Electrical Engineering Technion City, Haifa 32000, Israel ABSTRACT In this paper, we present an anomaly detection approach for three dimensional data. We pre-process the 3D data using the KarhunenLoeve transform (KLT), to remove correlation between data layers. Each layer is modeled as a Gauss Markov random field (GMRF). We present an efficient least squares method for model estimation. Anomaly detection is carried out in each data layer independently. We assume the anomalies lie in a known signal subspace. A different subspace is assumed for each data layer, such that a-priori knowledge about the sensors used to capture the data, or about the anomalies can be incorporated into the subspace. A parametric form of the model inverse covariance matrix is utilized to yield a computationally efficient detection. We demonstrate the performance of our approach by applying it to the detection of defects in wafer images and to detection of faults in 3D seismic data. 1. INTRODUCTION Anomaly detection in three dimensional data has many practical applications including automatic target detection in multispectral and hyperspectral images, defect detection, detecting of faults in seismic data, etc. Statistical methods in this field assume distinct statistical models for both the background and the anomalies [1, 2]. Statistical parameters for the background are estimated from the 3D data, while statistical parameters for the anomalies are estimated based on some training set. Other methods assume a known anomaly pattern in a random clutter background [3, 4], or assume the anomalies are those portions of the data, which have the worst fit to the background model [5, 6, 7]. Once statistical modeling is accomplished, hypothesis testing is used for deciding which pixels represent an anomaly and which represent the background. A major limitation of these methods is the inefficient statistical model for the anomalies. In real life the anomaly has an unknown pattern and one searches for different anomalies within a given data set. Estimating the statistical parameters for the anomalies from a given training data set yields poor detection results when the anomalies differ from the examples in the training set. Estimating these parameters based on the data itself renders the estimation unstable since the anomalies are sparse within the data and their location is unknown. Detecting anomalies based on worst fit to the background model does not allow utilization of a-priori information about the anomaly, if such information is available. An additional drawback of many of these methods is their high computational complexity. The computational cost comes from inefficient parameter estimation techniques and from the need to find inverse covariance matrices for the hypothesis testing stage.
In this paper, we present an anomaly detection approach for three dimensional data. In a pre-processing stage, we de-correlate the data layers using the Karhunen-Loeve transform (KLT). After de-correlating the data layers, each layer is modeled as a Gauss Markov random field (GMRF). The GMRF accounts for spatial correlation between neighboring image pixels. We present an efficient least squares model estimation, and present a parametric form of the model inverse covariance matrix. The inverse covariance matrix is later used in the anomaly detection stage, thus saving the computational burden of covariance matrix inversion. Anomaly detection is performed by utilizing a set of matched subspace detectors. Our matched subspace detector (MSD) detects anomalies in colored Gaussian noise, and interference subspace. We use a different MSD for each data layer. This approach allows us to incorporate into the anomaly subspace a-priori knowledge about the sensors used to capture the data, or a-priori information about the anomalies. Using such information would yield better detection rates, and lower false alarm rates. However, if such information is not available, detection is carried out based on a general subspace. The robustness of the proposed detection approach is demonstrated on real life data from two different applications: detection of defects in wafer images and detection of faults in 3D seismic data. The structure of the paper is as follows: In Section 2, we present the GMRF model and develop an efficient estimation method of its parameters. In Section 3, we propose our anomaly detection approach. Finally, in Section 4 we demonstrate the performance of our approach by applying it to the detection of defects in wafer images and to the detection of faults in 3D seismic data. 2. GAUSS MARKOV RANDOM FIELD In this section we first present our pre-processing layer de-correlation stage. We then model each transformed data layer as a GMRF, and introduce an efficient model estimation method based on least squares. 2.1. Clutter Modeling A 3D data set of size N × M × K can be regarded as K, 2D images stacked one on top of the other. We assume that the layers are uncorrelated. Since this assumption is generally incorrect, we use a KLT of the data in the depth direction to create the uncorrelated layers. Let Y represent a 3D data set, and let Y ij be a column vector (of size K × 1) representing all data layers at spatial location (i, j) in Y . Let B denote a matrix whose columns are the eigenvectors of the covariance matrix of Yi,j . The 3D data W whose
layers are independent is given by: Wij = B T Yij .
(1)
Each independent data layer is modeled as a zero mean, homogenous, first order, GMRF. The GMRF accounts for spatial correlation between neighboring image pixels. Let wij be an image pixel at location (i, j). Let βh and βv be the minimum mean square error (MMSE) estimation parameters of wij from its four nearest neighbors, and let εij be the estimation error. A first-order GMRF model is given by: ¢ ¡ wij = βh wi(j−1) + wi(j+1) + (2) ¡ ¢ +βv w(i−1)j + w(i+1)j + εij . We assume a first order GMRF with zero boundary conditions for simplicity. Discussion of higher order fields and different boundary conditions can be found in [8, 9]. We now turn to the parametric representation of the inverse covariance matrix of the GMRF model. All pixels within an image (data layer) of size N × M are row stacked into a column vector w. The estimation error pixels εij are arranged into a column vector ε in a similar manner. Using this vector notation we can write (2) as: Aw = ε .
where = =
−βh HM + IM −βv IM .
(5)
IN , IM are identity matrices of size N , M respectively. HN , HM have ones on the first upper and lower diagonals and zeros everywhere else. It is shown in [10] that the error vector ε is a colored Gaussian random vector with covariance matrix Σε = σ 2 A (where σ 2 is a positive constant). Using (3) the inverse covariance matrix of w is given by: Σ−1 w =
1 A. σ2
It is shown in [10] that the third GMRF model parameter σ 2 can be estimated using the two correlation coefficients, by: σ ˆ2 =
1 1 wT Aw = (Sw − 2βh χh − 2βv χv ) NM NM
(6)
The three parameters βh , βv , σ 2 fully represent the inverse covariance matrix of w. These parameters are to be estimated for each data layer, based on the data at hand as described in the following section. 2.2. Model Estimation We now address the problem of model estimation. Let us note that due to the sparse presence of anomalies in the data, the influence of anomalies on the parameter estimation is insignificant and therefore can be neglected. Much work has been done on the subject of GMRF model estimation (see for example [6, 8, 10]). Here we present an MMSE estimator, which is computationally and statistically efficient. Statistical efficiency is measured in Cramer Rao bound sense. In a first order GMRF model every pixel wij has four neighboring pixels. Arranging these pixels in a row vector: £ ¤ η ij = wi(j−1) + wi(j+1) w(i−1)j + w(i+1)j (7)
(10)
where Sw
=
N X M X
(wij )2
i=1 j=1
χh
=
−1 N M X X
wij wi(j+1)
i=1 j=1
(3)
The matrix A is structured and can be written in Kronecker notation: A = I N ⊗ B + HN ⊗ C (4)
B C
and lexicographically setting these vectors as rows in a matrix: £ ¤T X = η 11 η 12 · · · η IJ yields the following representation of (2): w = Xθ + ε (8) £ ¤T where θ = βh βv is a vector of the unknown GMRF parameters. Our goal is to find θ which minimizes the mean square error: εT ε. The MMSE estimation of θ is given by: ³ ´−1 θˆ = X T X XT w . (9)
χv
=
N −1 X M X
wij w(i+1)j .
(11)
i=1 j=1
Our parameter estimation experiments included Monte-Carlo simulations and have shown that our model estimation technique is superior to the least squares approach found in [10]. These results are not presented here to save space. 3. ANOMALY DETECTION In this section we present our anomaly detection method. We develope a MSD, operating in a colored noise environment. A separate MSD is used for each data layer. Our MSD uses a different signal subspace for each layer and utilizes the parametric form of the clutter inverse covariance matrix. Since we deal with 3D data, the anomalies are also three dimensional with a spatial size Nn ×Nm which is much smaller than N ×M but larger than the GMRF neighborhood. The anomaly has the same depth dimension as the data (K layers). We assume the anomalies lie within a known subspace spanned by G image chips hg , g = 1, 2, · · · , G, each of size (Nn × Nm × K). This 3D anomaly model allows us to represent a different pattern for the anomaly in every layer. Each 3D image chip is passed through the same KLT transform used for the 3D data. For each layer we create a matrix Hl , whose columns span the anomaly subspace in that layer. This is done by row stacking layer l of every image chip into a column vector and setting these vectors as columns in a matrix: Hl , l = 1, 2, · · · , K. We model the interference subspace in a similar manner. We use T image chips st , t = 1, 2, · · · , T each of size (Nn × Nm × K). These image chips are passed through the KLT transform and a matrix spanning the interference subspace of each layer Sl , l = 1, 2, · · · , K is created. In [11] a MSD is developed for the detection of subspace signals in subspace interference and white Gaussian noise. Here, we introduce a matched subspace detector for the detection of signals in subspace interference and colored Gaussian noise.
Let yl represent layer l, and let yl (s) represent a pixel at spatial location s in yl . For each pixel yl (s) we create a column vector nl (s) by row stacking an image chip of size Nn × Nm centered around s. Let v l (s) be a GMRF vector of size Nn × Nm , and let φl (s), ψ l (s) be the weight vectors for the interference and anomaly subspaces respectively. We define two hypothesis: (a) H0 : nl (s) H1 : nl (s)
= =
Sl φl (s) + v l (s) Hl ψ l (s) + Sl φl (s) + v l (s) .
(b)
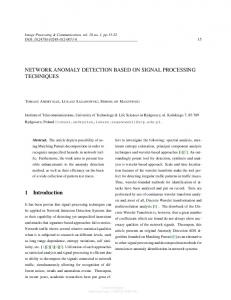
Fig1: (a) One of the layers of the original image; (b) Anomaly detection.
Under the two hypothesis nl is distributed as: H0 : nl (s) H1 : nl (s)
∼ ∼
N(Sl φl (s), Σv l ) N(Hl ψ l (s) + Sl φl (s), Σv l ) .
L(s) is a sum of squared independent normally distributed variables. Therefor L(s) is chi-square distributed with q = K·rank(H) degrees of freedom [12]:
GMRF parameter estimation (as described in Section 2) is performed for each layer. The inverse covariance matrix of v l is calculated using the estimated GMRF parameters. The vectors ψ l (s) and φl (s) are estimated from the data based on maximum likelihood (ML) and are given by (see appendix): H0
:
H1
:
−1/2
φl (s) = P0 Σv l T
nl (s)
(12) −1/2
T T
[φl (s) , ψ l (s) ] = P1 Σv l
nl (s)
λ
=
P1
= =
−1 T ([Sl , Hl ]T Σ−1 v l [Sl , Hl ]) [Sl , Hl ] Σv l
. (15)
Following the above notation we have: H0 : H1 :
(1) vˆl (s)
= =
(I − Sl P0 Σv l
)nl (s) −1/2
=
T
(0)
(I − [Sl , Hl ]P1 Σv l
)nl (s) .
(1)
−1/2
(Σv l
−Σv l
−1/2
(Σv l
−1/2
T
nl (s)) (Σv l
−1/2
Sl P0 )(Σv l
T
(1)
[Sl , Hl ]P1 −
nl (s)) = −1/2
nl (s))T (B1 − B0 )(Σv l
nl (s))
(18)
where B0 B1
= =
−1/2
S l P0
−1/2
[Sl , Hl ]P1
Σv l Σv l
(19)
are the projections into the subspaces spanned by the columns of −1/2 −1/2 Σv l Sl and Σv l [Sl , Hl ] respectively. Due to the fact that the layers are uncorrelated, the log GLR based on K image layers is: L(s)
=
K X l=1
Ll (s)
χ2q (λ)
−1/2
Hl ψ l )T (B1 − B0 )(Σv l
−1/2
Hl ψ l )T (I − B0 )(Σv l
(Σv l
−1/2
Hl ψ l ) =
K X
(Σv l
−1/2
Hl ψ l ) .
(21)
The decision at every spatial location is performed by thresholding L(s). The threshold γ is chosen such that it would satisfy the desired detection and false alarm probabilities: PF A
=
1 − P [χ2q (0) ≤ γ]
PD
=
1 − P [χ2q (λ) ≤ γ] .
(17)
−1 vˆl (s) Σ−1 v l vˆl (s) − vˆl (s) Σv l vˆl (s) =
−1/2
=
(0)
K X
(16)
Since v l is a Gaussian vector with zero mean and a known structured inverse covariance matrix Σ−1 v l , the log generalized likelihood ratio (GLR) (log GLR) is: · ¸ Pr (ˆ v l (s) |H0 ) Ll (s) = 2 ln = Pr (ˆ v l (s) |H1 ) =
∼
(14) −1/2
−1/2
H1 : L(s)
l=1
−1 T −1/2 (SlT Σ−1 v l Sl ) Sl Σv l
(0) vˆl (s)
χ2q (0)
l=1
=
P0
∼
where:
(13)
where
H0 : L(s)
(20)
4. EXPERIMENTAL RESULTS In this section we demonstrate the performance of our anomaly detection approach by applying it to the detection of of defects in wafer images, and to the detection of discontinuities in 3D seismic data. 4.1. Wafer Defects The wafer 3D data is composed of 3 layers. Each layer is taken from a different perspective (right angle, left angle, and top). The three layers are perfectly aligned. The 3D data is of size 128 × 128 × 3. The defect size is approximately 3 × 3 pixels. We use Nn = Nm = 3. The anomaly subspace is constructed from 3 image chips. We did not use real defects for the anomaly image chips, but rather simple bar shape structures in each layer. Figure 1 shows one of the layers of the wafer image, and the results of the anomaly detection algorithm (without thresholding). Correct detection is apparent from the image. To increase contrast in the detection image, we performed gamma correction on the displayed detection image. 4.2. Seismic We use real life seismic data (from the Gulf of Mexico). The data is a 3D lattice of size 201 × 201 × 226. We pre-process the data in
Setting the derivative to zero we have: T −1 T 2SlT Σ−1 v l Sl φl − 2(nl Σv l Sl ) = 0 .
Solving for φl yields: −1 T −1 φl = (SlT Σ−1 v l Sl ) Sl Σ v l nl .
(a)
(b)
Fig2: (a) Horizontal slice of the 3D seismic data; (b) Anomaly detection.
a similar manner to [13]: A small analysis cube of size 4 × 4 × 15 moves through every spatial location in every data layer. At each location, the analysis cube is partitioned into 4 sub-cubes each of size 2 × 2 × 15. The sub-cubes are arranged in a consistent fashion into 4 column vectors. A correlation matrix of the 4 vectors is calculated. The lower triangle coefficients of the correlation matrix are formed into a column vector of size 6 × 1. In this manner each data layer of size 201 × 201 × 1 is turned into a 201 × 201 × 6 lattice. Detection is performed independently on each such lattice. We first perform the KLT transform described in Section 2. The 6 layers are highly correlated, therefor after the KLT transform has been applied, we only use the layer corresponding to the largest eigenvector, and neglect all other layers (K = 1). We use the detection method described in Section 3 on the single layer data. The signal subspace is constructed from a single image chip of size 1 × 5, which describes a bar shape. Figure 2 shows a horizontal slice of the original data, and the results of the anomaly detection algorithm (without thresholding). 5. CONCLUSION In this paper, we have presented an anomaly detection approach for three dimensional data. We used the KLT, to remove correlation between data layers. We presented a MSD which works in a colored noise environment modeled as a GMRF. This MSD was utilized to perform anomaly detection in each layer independently. The MSD allows us to incorporate into the signal subspace a-prior information about the sensors used to capture the data, or about the anomalies. We used a different MSD for each data layer, thus allowing for maximal use of a-priory information. Incorporating such information potentially produces improved detection results. We demonstrated the proposed approach on two applications: detection of defects in wafer images, and detection of faults in real life seismic data. 6. APPENDIX We prove the ML estimation of φl under H0 . The ML solution of φl , ψ l under H1 is easily proved by analogy. Under H0 we have: i d d h {log [P (nl )]} = (nl − Sl φl )T Σ−1 (nl − Sl φl ) . v l dφl dφl Opening the parenthesis on the right side, recalling that nTl Σ−1 v l nl is independent of φl and rearranging terms yields: i d h T T −1 d {log [P (nl )]} = φl Sl Σv l Sl φl − 2nTl Σ−1 S φ . l v l l dφl dφl
7. REFERENCES [1] D. W. J. Stein, S. G. Beaven, L. E. Hoff, E. M. Winter, A. P. Schaum and A. D. Stocker, “Anomaly detection from hyperspectral imagery,” IEEE Signal Processing Magazine, vol. 19, no. 1, pp. 58–69, January 2002. [2] D. Manolakis and G. Shaw, “Detection algorithms for hyperspectral imaging applications,” IEEE Signal Processing Magazine, vol. 19, no. 1, pp. 29–43, January 2002. [3] I. S. Reed and X. Yu, “Adaptive multiple-band CFAR detection of an optical pattern with unknown spectral distribution,” IEEE Transaction on Acoustics Speech and Signal Processing, vol. 38, no. 10, pp. 1760–1770, October 1990. [4] R. N. Strickland and H. I. Hahn, “Wavelet transform methods for object detection and recovery,” IEEE transactions on Images Processing, vol. 6, no. 5, pp. 724–735, May 1997. [5] E. A. Ashton, “Detection of subpixel anomalies in multispectral infrared imagery using an adaptive bayesian classifier,” IEEE Transcactions on Geoscience and Remore Sensing, vol. 36, no. 2, pp. 506–517, March 1998. [6] S. M. Schweizer and J. M. F. Moura, “Efficient detection in hyperspectral imagery,” IEEE Transactions on Image Processing, vol. 10, no. 4, pp. 584–597, April 2001. [7] A. Goldman and I. Cohen, “Anomaly detection based on an iterative local statistics approach,” to appear in Signal Processing. [8] N. Balram and J. M. F. Moura, “Noncausal Gauss Markov random fields: Parameter stracture and estimation,” IEEE Transactions on Information Theory, vol. 39, no. 4, pp. 1333–1355, July 1993. [9] J. M. F. Moura and N. Balram, “Recursive structure of noncausal Gauss-Markov random fields,” IEEE Transactions on Information Theory, vol. 38, no. 2, pp. 334–354, March 1992. [10] S. M. Schweizer and J. M. F. Moura, “Hyperspectral imagery: Clutter adaptation in anomaly detection,” IEEE Transaction on Information Theory, vol. 46, no. 5, pp. 1855–1871, August 2000. [11] L. L. Scharf and B. Friedlander, “Matched subspace detectors,” IEEE Transactions on Signal Processing, vol. 42, no. 8, pp. 2146–2157, August 1994. [12] R. J. Muirhead, Aspects of Multivariate Statistical Theory, John Wiley and Sons, INC., 1982. [13] I. Cohen and R. R. Coifman, “Local discontinuity measures for 3-D seismic data,” Geophysics, vol. 67, no. 6, pp. 1933– 1945, Nov.-Dec. 2002.