Texture Bags: Anomaly Retrieval in Medical Images based on Local 3D-Texture Similarity Andreas Burner1,? , Rene Donner1 , Marius Mayerhoefer2 , Markus Holzer1 , Franz Kainberger2 , Georg Langs1,3 1
Computational Image Analysis and Radiology Lab, Department of Radiology, Medical University of Vienna, Austria 2 Department of Radiology, Medical University of Vienna, Vienna, Austria 3 CSAIL, Massachusetts Institute of Technology, Cambridge, MA, USA
[email protected] Abstract. Providing efficient access to the huge amounts of existing medical imaging data is a highly relevant but challenging problem. In this paper, we present an effective method for content-based image retrieval (CBIR) of anomalies in medical imaging data, based on similarity of local 3D texture. During learning, a texture vocabulary is obtained from training data in an unsupervised fashion by extracting the dominant structure of texture descriptors. It is based on a 3D extension of the Local Binary Pattern operator (LBP), and captures texture properties via descriptor histograms of supervoxels, or texture bags. For retrieval, our method computes a texture histogram of a query region marked by a physician, and searches for similar bags via diffusion distance. The retrieval result is a ranked list of cases based on the occurrence of regions with similar local texture structure. Experiments show that the proposed local texture retrieval approach outperforms analogous global similarity measures. Keywords: Content-based medical image retrieval (CBIR), feature extraction, texture analysis, unsupervised texture learning, Local Binary Pattern (LBP), localized features, high-resolution CT (HRCT), emphysema disease.
1
Introduction
In today’s hospital routine, thousands of medical images are processed on a daily basis. Individual radiology departments can produce hundreds of gigabytes of high quality imaging data per day. This data is typically inspected once during diagnosis and then remains unused in the imaging repository of the hospital. Since this data together with the corresponding reports holds rich information, it is desirable to access it during diagnosis of new cases. However, currently this ?
The research leading to these results has received funding from the European Union Seventh Framework Programme (FP7/2007-2013) under grant agreement n◦ 257528 (KHRESMOI) und from the Austrian Science Fund (FWF P22578-B19, PULMARCH).
2
accessibility is limited, due to the complexity and amount of visual data. In this paper we propose a method for searching medical imaging data based on a query region marked by a physician. State of the Art Today’s computer-aided detection (CAD) systems typically target one specific anatomic region. They consist of a classifier or scoring method that is trained to respond to a specific set of pathologies in a supervised fashion, using a priori knowledge regarding the characteristics of the disease and anatomical region. This approach does not scale well to cases that need large amounts of rich training data, or for which a priori knowledge regarding relevant features does not exist. In such scenarios we need methods that rely on at least partially unsupervised learning, to cope with the vast amount of data in an efficient and scalable manner. Various methods have been introduced to analyze texture in digital images. A comparison of the two traditional approaches (statistical and structural) with the Local Binary Pattern (LBP) operator [18, 19] is discussed by M¨aenp¨a¨a et al. [14, 15]. The work concludes that statistical approaches, such as histograms of gray-level pixel values and gray-level co-occurrence (GLC) [10] work best with stochastic microtextures. In contrast, structural approaches such as Textons [12, 16], wavelet transforms and Gabor filters [17] compute weighted means of pixel values by applying filter banks etc. over a small neighborhood. They therefore work well with macrotextures, partially eliminating fine-grained information. The LBP operator combines both approaches. Therefore it works for stochastic microtextures as well as deterministic macrotextures. Recent studies on lung tissue and soft tissue analysis show promising results [2–6, 20, 22, 23, 25]. However, the methods are based on supervised learning, and therefore are subject to the aforementioned limitations. Recently, unsupervised learning became a topic of interest in vision [7–9]. In contrast to supervised learning, unsupervised learning does not depend on annotated training sets, but learns domain specific structure from the data. Aim In this work we apply unsupervised learning to medical image retrieval. We learn a three-dimensional texture vocabulary that captures the imaged tissue properties specific to an anatomical domain and the associated anomalies. We do not use knowledge regarding the anomalies in the training cases, but instead learn the inherent structure in the visual data. Typically soft tissue is characterized by a set of textures instead of homogeneous texture regions. Therefore, a description by a bag of descriptors instead of single descriptors is necessary. Our concept is analogous to the visual word paradigm of Sivic et al. [21] that is based on the idea that objects are represented by sets of typical patches of local appearance, called visual words. Histograms of the occurrence of these visual words are expected to be similar for objects within a class and distinct for objects of other classes. Our approach differs in two aspects from [21]: (1) instead of image patches we use three-dimensional Local Binary Pattern (LBP) texture descriptors to capture tissue characteristics,
3 Training volumes
Compute generic texture descriptors Ds [0 0 1 [0 1 0 [1 0 0 [0 0 0 [0 1 1
01011 11111 11000 00000 11010
0101100000 0011101101 0010000000 0011100010 0110011110 ...
11110 10110 00000 00001 10101
Learn texture vocabulary: clustering Ds per scale
1 0 1] 1 1 1] 1 0 1] 0 1 1] 1 0 0]
0.017 0.829 0.627 0.539 0.651 ...
0.296 0.152 0.848 0.785 0.271 ...
[0 1 1 0 0 1 0 0 1 0 1 1 1 1 0 1 0 1 1 1 0 0 0 1 1 1] [1 0 1 1 0 1 0 0 1 0 1 1 1 1 1 1 0 0 1 0 0 0 1 1 1 0] [0 1 1 1 0 0 1 1 1 0 1 0 1 0 0 0 1 1 0 0 0 1 1 0 0 0] [1 1 0 0 1 0 0 1 0 1 1 1 0 1 1 0 1 0 0 0 1 1 0 1 0 1] [1 0 1 0 1 0 0 1 1 0 0 1 0 1 1 1 0 0 1 1 1 1 1 0 1 0] ...
0.727 0.094 0.878 0.014 0.294 ...
0.572 0.286 0.699 0.796 0.442 ...
[0 0 0 [1 0 0 [1 0 1 [1 1 0 [0 1 0
11110 10000 00011 11110 10101
1011100111 0100001011 1101011111 1011101001 1000000111 ...
11110 11001 00100 10110 01011
1 0 0] 0 1 1] 0 0 1] 0 0 0] 0 1 1]
0.694 0.212 0.543 0.703 0.956 ...
0.446 0.466 0.279 0.675 0.904 ...
[1 1 1 [1 1 1 [0 0 0 [0 1 1 [1 0 0
00011 10011 01100 11001 01011
0011101100 1011101101 1011110111 1111101101 1011000101 ...
01101 10101 11011 10100 11001
1 0 0] 0 0 1] 0 0 1] 0 0 0] 0 0 0]
0.445 0.085 0.057 0.629 0.796 ...
0.132 0.124 0.191 0.146 0.585 ...
DC
DI
DLBP3d
scale 1
scale 2
scale 3
scale 4
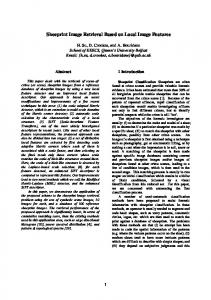
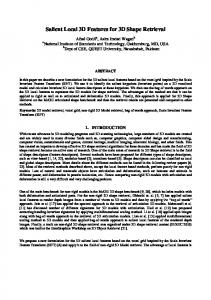
Fig. 1. Overview of the texture word learning pipeline: our descriptor Ds is a combination of a three-dimensional Local Binary Pattern (LBP) descriptor DLBP , a contrast measure DC , and an intensity measure DI . By applying k-means clustering for each scale s of Ds independently, we obtain generic texture words Wks .
and (2) instead of using histograms to match entire images, we search for regions that have similar local appearance. This is necessary to cope with the variability encountered in medical imaging data, and the comparably subtle effects of disease. Based on the similarity of the texture structure of local regions, images are being ranked during retrieval. The Scenario The proposed method aims to support physicians during their diagnosis. A physician can mark a region of an image at hand and run a retrieval query on an image repository, for example the hospital’s PACS system. Our method will return images with regions containing similar medical structures. This enables the physician to compare the current case to past cases and gain knowledge by comparing the diagnosis, treatment, and progress of the disease.
2
Method
The method consists of two phases. (1) During the learning phase (section 2.1) the algorithm computes descriptors and learns a three-dimensional texture vocabulary to capture the structure in the training data. (2) During the retrieval phase (section 2.2), the medical doctor marks a region of interest in the query image, the algorithm searches for similar regions in terms of texture, contrast, and intensity in the entire data set, and ranks images in the imaging repository accordingly. 2.1
Learning a Texture Vocabulary
This section describes how we train the texture vocabulary. Figure 1 shows the overview of the learning pipeline. The training set consists of medical images and a segmentation that marks the anatomical structure of interest.
4
0
2
20
21
23
22 24
20 23
29
217 2
1
218 210
21 24
2
2
219 211
219
211
22
22
25
25
222 213 225 216
25
26
27
26
27
28
8
2
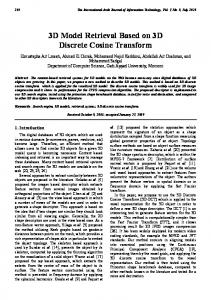
Fig. 2. Local Binary Patterns (LBP) weights: a. Two-dimensional LBP by Ojala et al. [18, 19], b. Three-dimensional LBP used by our texture descriptor D.
Computation of Texture Features The base feature extractor is a threedimensional adaptation of the Local Binary Pattern operator (LBP) described by Ojala et al. [18, 19]. We chose to implement an LBP-based descriptor because of its property to respond very well to microscopic structure [14], and its computational simplicity and high performance. Furthermore, it is invariant to the gray-scale range, which makes it applicable for both, CT-, and MR imaging [11]. The original LBP operator computes the local structure at a given pixel i by comparing the values of its eight neighborhood pixels with the value of i, applying weights (figure 2a), and summing up the values. This computation yields a value from 0 to 255 for each pixel that describes the neighborhood-relative gray-scale structure. Various extensions of the original operator have been published in recent years4 , however, none of them addresses our focus. A Three-dimensional, Multi-scale LBP Descriptor As the local contrast is an important property in the medical domain, our method is based on LBP/C [19], which combines the base LBP operator DLBP , with a local contrast measure DC . In some medical imaging modalities, such as CT, intensities of local regions are an important decision instrument for physicians. Since the LBP operator is by definition gray-scale invariant, we furthermore supplement a local average intensity measure DI of the 3x3x3 LBP cube to the feature vector if absolute intensity is relevant. We denote our LBP3d/CI descriptor D, defined as: D = [ DLBP 3d , cc DC , ci DI ]
(1)
In total the descriptor D has 28 dimensions: 26 LBP bits, one contrast dimension, and one intensity dimension. The factors cc and ci determine the impact of the two measures, contrast and intensity. In practice, all descriptors are scaled to the range [0, 1], cc and ci are chosen according to the imaging modality. Note that extending the LBP operator from 2D to 3D increases the dimensionality of the feature space substantially. In 2D the 3x3 pixel grid results in a descriptor of 8 bit size (32 -1) (figure 2a), whereas in 3D the 3x3x3 pixel grid results in a descriptor of 26 bit size (33 -1) (figure 2b). The increased dimensionality causes a large increase of possible texture units, from 256 to 67.1*106 . 4
An extensive list of LBP bibliography can be found http://www.cse.oulu.fi/MVG/LBP Bibliography (accessed June 2011)
at
5
3 W49 :
DC : 0.91, DI : 0.59
3 W70 :
DC : 1.69, DI : 0.62
3 W76 :
DC : 0.44, DI : 0.42
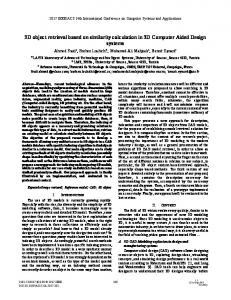
3 3 3 Fig. 3. Three example 3D texture words W49 , W70 , and W76 trained in an unsupervised manner on lung tissue on scale 3. The slices of the cube from top to bottom are depicted from left to right. Next to the cube are the measures for contrast (DC ) and intensity (DI ). Below each texture words are three examples of lung tissue belonging to this word. Note the similar structure of the example-tissues for each texture word.
Learning a Vocabulary of Local Patterns: Texture Words To obtain structure from the data and quantize this enormous feature space, we perform clustering on the feature descriptors D of a large set of voxels randomly sampled from the anatomical structure across the training set. After computing k-means, the centroids define the texture vocabulary for a specific anatomical region. We refer to the k clusters that formulate the texture vocabulary as texture words Wk . Note, that the centroid’s coefficients that correspond to the binary LBP features are now in the interval [0, 1]. We compute Euclidean distance as the metric for k-means clustering, as each bit of the LBP code represents one dimension with a binary value of either 0 or 1 and contrast and intensity are also in Euclidean space. In the medical domain, the scale in which a texture appears is of high relevance. The importance of scale can be seen in the approach of Andr´e et al. [1]. To be able to perceive the granularity of texture, the method incorporates a multi-resolution approach by computing the descriptor Ds on various scales of the volumes. By performing clustering on the descriptors of each scale s independently, the learned vocabulary Wks is specific for each scale. Analogous to Textons [12, 16], we represent each voxel with its closest texture word Wks , i.e., with the index of the closest cluster center. Figure 3 shows three examples of cluster centers, or texture words.
6
Interpretation of Texture Words Three texture words resulting from clustering the descriptors D, together with corresponding instances in the data are illustrated in figure 3. To evaluate the texture words, random examples of tissue patches have been visually inspected and compared. Note that the three examples describe very different characteristic local texture volumes of lung tissue a result of D being a combination of DLBP 3d , DC , and DI . The center voxel of the cube is gray, surrounded by darker or lighter voxels describing the relative 3 3 structure to the center. W49 represents a strong vertical edge, whereas W70 rep3 resents a diagonal edge, and W76 represents a horizontal structure on the top of the cube and a diagonal structure at the bottom. The low value of c furthermore describes only little, but strong structures. Properties of Texture Words and the Concept of Texture Bags We describe a region R by the histogram h(R) of texture words Wk it contains. This is analogous to the bag of visual word paradigm of Sivic et al. [21]. We call this k-bin histogram h(R) a texture bag. Similar to [21] describing local patches, our histogram describes a region in terms of its textural structure. We normalize the texture histogram to make comparison possible without considering the size of a region. A Distance between Texture Bags Comparing texture histograms is not trivial since similarity among texture words can make bin to bin comparison ambiguous. To take the similarity of texture words into account, when computing the distance between texture bags, we use the diffusion distance algorithm described by Ling et al. [13]. It takes the relationship among words into account in form of a weight matrix. Based on our definition of texture words, we can compute cross-word weights cij as the dimension-wise distance between two words W: q (2) cij = Wi 2 − Wj 2 , and create the matrix C = [cij ] by computing this distance for all word pairs. Diffusion distance has the added benefit of increasing the robustness of the method with regard to the choice of k during clustering. The distance between two texture bags Ri and Rj is computed by dij = d( h(Ri ), h(Rj ) )
2.2
(3)
Retrieval
For the scenario described in the introduction, the retrieval query consists of a medical image IQ and a marked query region RQ . Our method aims to retrieve images with regions most similar to RQ . To compare the texture of areas, the corresponding texture bags are compared by the diffusion distance. Figure 4 shows an overview of the retrieval pipeline.
7 Query by region – computed online Ranking by number of most similar regions Rjs
Texture word histogram h ( RQ )
Physican marks region RQ
Diffusion distance djs = d( h (RQ), h (Rjs) )
Precalculated – computed offline Images Ij in repository
Supervoxel oversegmentation Rjs
Texture word histograms h ( Rjs )
Fig. 4. Overview of the 3D-LBP/CI retrieval pipeline. Top left: the retrieval scenario, a physician marks a region in an image. Lower left: precomputation of the image set. Right side: comparison by diffusion distance [13] and ranking by the number of most similar regions
Precomputation of the Images in the Imaging Repository For the purpose of grouping similar areas and reducing the complexity of the threedimensional image, we perform a precomputing step for each image Ij of the repository. This precomputing step fragments each image into several texture bags. We chose to use a supervoxel algorithm for this purpose and apply the method of Wildenauer et al. [24]. The result for a lung volume Ij is a threedimensional oversegmentation Rjs for the image j and the supervoxel index s, shown in figure 5. For each region Rjs , we precompute a texture bag, a histogram h(Rjs ) of occurring texture words Wk .
Fig. 5. Supervoxel algorithm applied on lung volumes. This figure depicts the oversegmented regions Rjs in 2D on the left, and in 3D on the right.
8
Fig. 6. Retrieval ranking result of two distinct emphysemas with different tissue patterns (top: centrilobular emphysema, bottom: panlobular emphysema). The region highlighted in red on the left side shows the query region RQ marked during search by a physician. On the right side, the green regions depict the four most similar regions Rjs retrieved by our method.
Computing Similarities to the Retrieval Query To compare the marked regions RQ of the query image IQ to all regions Rjs , a normalized texture word histogram h(RQ ) is computed. The distance between the histogram of the query region RQ and the regions Rjs is computed by the diffusion distance. djs = d( h(RQ ), h(Rjs ) ) 2.3
(4)
Ranking of the Image Set
The final step of the retrieval pipeline computes a ranking of all images Ij based on the number of ”close” regions Rjs to the query region RQ . For this ranking, the number of regions RI,s are considered that are amongst the most similar regions Rjs to RQ , in terms of diffusion distance. The threshold t of regions taken into account is dependent on the average region size Rjs , therefore dependent on the number of superpixels s per image Ij . Figure 6 shows the result of two retrieval queries. The first example is a query to retrieve patterns that are typical for centrilobular emphysema: round black spots, with typically less tissue structure than healthy lung tissue. The second example query retrieves patterns that are characteristic for panlobular emphysema: large areas with very little tissue lung structure. The results on the right side show regions with small distance to the query region RQ , i.e., regions where the texture histograms h(RQ ) and h(Rjs ) are similar.
9
3
Data
The evaluation data contains 21 HRCT image series with a slice thickness of 3mm and an in-plane pixel spacing of 0.74mm. The cases of this study consist of 10 cases of lungs diagnosed as healthy and cases with two types of lung pathologies: emphysema (6 cases), lung metastasis (4 cases), and both (1 case). The diagnosis of each case was confirmed by two experienced radiologists of the contributing hospital. In this paper we focus on the retrieval of lungs suffering emphysema. To simulate the retrieval scenario, a radiologist marked a query region in the query case. Query cases were emphysema cases. The system retrieves most similar regions in the remaining data set and ranks them accordingly to the distance (Eq. 4). As a basis for our tests, the contributing radiologists manually marked query regions in each lung where they detected patterns of emphysema. These marked regions typically are small patches on three to five slices for each image series (see left images of figure 6). The segmentation of the lungs are performed semi-automatically, by a threshold algorithm, applying simple morphologic functions, and a manual validation and correction step. Lung segmentation is not in the scope of this paper. Instead we focus on the characterization of anomalies within the anatomical structure.
4 4.1
Experiments Set-up and Evaluation
To achieve clinically applicable performance, the code for the three-dimensional, LBP-based descriptor D is implemented in C++. Therefore, the processing time for a volume of 512x512x150 voxels is less than one second on a quad core computer. During our pilot experiments that are based on the lung anomaly retrieval scenario, we chose fixed parameters for all runs. We chose the number of clusters k = 300. Note that the diffusion distance results in some degree of robustness regarding increasing k. Our tests show that the performance of our method is to some extent dependent on the precomputed oversegmentation of the volumes. Therefore, the supervoxel algorithm is of importance: (1) where it computes the borders between regions, and (2) the number of supervoxels s per volume, which should be chosen dependent on the granularity of the anomaly to be retrieved. After initial experiments, we fixed s = 5000 for all cases. For the descriptor D we chose the weights cc and ci to be 10, and use scale 1 to 4 for the similarity calculation of regions. Furthermore, we set the ranking threshold to 800. We performed a 7-fold cross validation to evaluate the retrieval performance of the algorithm. In each run, a query region RQ ⊂ IQ was marked in one of the emphysema cases, and retrieval was performed on all other cases Ij , j 6= Q. We validate the ranking by evaluating the ratio of cases with corresponding anomaly (emphysema) among the top ranked retrieved cases. To validate the concept of texture bag ranking based on a local query region, the recognition rate of our method (table 2) was compared to a retrieval run
10 70% Texture Bag Histogram Full Histogram By Chance
60%
50%
40%
30%
20%
10%
0% 1
2
3
4
5
6
7
8
9
10
11
12
13
14
15
16
17
18
19
20
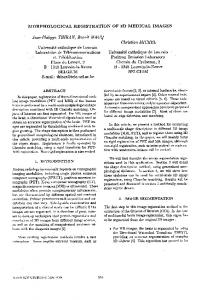
Fig. 7. Comparison of retrieval results: (yellow) ratio of randomly picked image series is 30%. Our method (blue) that is based on unsupervised learning outperforms full volume histogram retrieval (green).
based on the distance of texture word histograms of the entire query image h(IQ ) to texture word histograms of entire lung volumes of the data set h(Ij ), j 6= Q. 4.2
Results
Table 1 shows anomaly retrieval results for global image similarity, table 2 demonstrates the retrieval results by the proposed method. The ratio of correctly top ranked cases (i.e., cases with the correct query anomaly) for randomly picked image series is 30%. The full volume histogram retrieval’s performance is in the range of 24%-29%. The likely reason is that the anomaly regions that are relevant for retrieval often cover only a fraction of the overall volume. Therefore, Table 1. Full image ranking: the result of seven runs (r1 to r7): the table shows the number of correctly retrieved anomalies by full volume histogram retrieval of the top 3, 5, and 7 image series. ranking top 3 top 5 top 7
r1 1 2 2
r2 0 0 1
r3 0 1 1
r4 1 2 3
r5 1 2 2
r6 1 2 3
r7 1 1 1
average 24% 29% 27%
Table 2. Texture bag ranking: the result of seven runs (r1 to r7): the table shows the number of correctly retrieved anomalies by our retrieval method of the top 3, 5, and 7 image series. ranking top 3 top 5 top 7
r1 2 2 2
r2 2 3 3
r3 2 4 4
r4 2 3 4
r5 2 2 3
r6 1 2 3
r7 3 3 3
average 67% 54% 45%
11
the most frequent tissue types are typically not anomalies, and thus not helpful during retrieval. The average recognition rate of correctly retrieved anomalies of all runs for the proposed method is 67% for the top rated three, 54% for the top rated five, and 45% for the top rated seven image series. This shows that the retrieval performance of our method outperforms retrieval by chance and full volume histogram retrieval significantly. Figure 7 plots the percentage of correctly retrieved anomalies against the number of image series returned.
5
Conclusion
In this paper we present a fast method for content-based image retrieval (CBIR) based on unsupervised learning of a vocabulary of local texture. We describe the concept of texture bags, an efficient way to compare regions based on their texture content. The algorithm is suitable for anomaly retrieval in large image repositories, such as PACS systems. On an initial data set, our experiments indicate that the proposed retrieval method outperforms global similarity measures if the aim is to retrieve cases with the same anomaly. Future work will focus on the evaluation on data sets with clinically realistic size and a wide variety of anomalies.
References 1. Andr´e, B., Vercauteren, T., Perchant, A., Buchner, A.M., Wallace, M.B., Ayache, N.: Endomicroscopic image retrieval and classification using invariant visual features. In: Proceedings of the Sixth IEEE international conference on Symposium on Biomedical Imaging: From Nano to Macro. pp. 346–349. ISBI’09, IEEE Press, Piscataway, NJ, USA (2009) 2. Depeursinge, A., Iavindrasana, J., Hidki, A., Cohen, G., Geissb¨ uhler, A., Platon, A., Poletti, P., M¨ uller, H.: Comparative performance analysis of state-of-the-art classification algorithms applied to lung tissue categorization. J. Digital Imaging 23(1), 18–30 (2010) 3. Depeursinge, A., Vargas, A., Gaillard, F., Platon, A., Geissbuhler, A., Poletti, P., M¨ uller, H.: Content-based retrieval and analysis of HRCT images from patients with interstitial lung diseases: a comprehesive diagnostic aid framework. In: Computer Assited Radiology and Surgery (CARS) 2010 (Jun 2010) 4. Depeursinge, A., Vargas, A., Platon, A., Geissbuhler, A., Poletti, P., M¨ uller, H.: 3D case-based retrieval for interstitial lung diseases. In: MCBR-CDS 2009: Medical Content-based Retrieval for Clinical Decision Support. pp. 39–48. No. 5853 in Lecture Notes in Computer Science (LNCS), Springer (Feb 2010) 5. Depeursinge, A., Zrimec, T., Busayarat, S., M¨ uller, H.: 3D lung image retrieval using localized features. In: Medical Imaging 2011: Computer-Aided Diagnosis. vol. 7963, p. 79632E. SPIE (Feb 2011) 6. Fehr, J., Burkhardt, H.: 3D rotational invariant local binary patterns. In: Proceedings of the 19th International Conference on Pattern Recognition (ICPR 2008). pp. 1–4. Tampa, Florida, USA (2008) 7. Fergus, R., Perona, P., Zisserman, A.: Object class recognition by unsupervised scale-invariant learning. Computer Vision and Pattern Recognition, IEEE Computer Society Conference 2, 264 (2003)
12 8. Fritz, M., Schiele, B.: Towards unsupervised discovery of visual categories. In: Proceedings of 28th Annual Symposium of the German Association for Pattern Recognition DAGM06. Berlin, Germany (09/2006 2006) 9. Grauman, K., Darrell, T.: Unsupervised learning of categories from sets of partially matching image features. In: Proceedings of the 2006 IEEE Computer Society Conference on Computer Vision and Pattern Recognition - Volume 1. pp. 19–25. IEEE Computer Society (2006) 10. Haralick, R.M., Shanmugam, K., I., D.: Textural features for image classification. IEEE Transactions on Systems, Man, and Cybernetics SMC-3, 610–621 (Nov 1973) 11. Hou, Z.: A Review on MR Image Intensity Inhomogeneity Correction. International Journal of Biomedical Imaging pp. 1–12 (2006) 12. Leung, T., Malik, J.: Recognizing surfaces using three-dimensional textons. In: Proceedings of the International Conference on Computer Vision-Volume 2 - Volume 2. pp. 1010–. ICCV ’99, IEEE Computer Society, Washington, DC, USA (1999) 13. Ling, H., K., O.: Diffusion distance for histogram comparison. In: Proceedings of the 2006 IEEE Computer Society Conference on Computer Vision and Pattern Recognition - Volume 1. vol. 1, pp. 246–253 (2006) 14. M¨ aenp¨ aa ¨, T.: The Local Binary Pattern Approach To Texture Analysis Extensions And Applications (Academic Dissertation), pp. 20–. University of Oulu (Aug 2003) 15. M¨ aenp¨ aa ¨, T., Pietik¨ ainen, M.: Texture Analysis With Local Binary Patterns, pp. 197–216. World Scientific Publishing Co. (Jan 2005) 16. Malik, J., Belongie, S., Leung, T., Shi, J.: Contour and texture analysis for image segmentation. Int. J. Comput. Vision 43, 7–27 (June 2001) 17. Manjunath, B.S., Ma, W.Y.: Texture features for browsing and retrieval of image data. IEEE Trans. Pattern Anal. Mach. Intell. 18, 837–842 (August 1996) 18. Ojala, T., Pietikainen, M., Harwood, D.: Performance evaluation of texture measures with classification based on Kullback discrimination of distributions, vol. 1, p. 582585. IEEE (1994) 19. Ojala, T., Pietikainen, M., Harwood, D.: A comparative study of texture measures with classification based on featured distributions. Pattern Recognition 29(1), 51– 59 (1996) 20. van Rikxoort, E., Galperin-Aizenberg, M., Goldin, J., Kockelkorn, T., van Ginneken, B., Brown, M.: Multi-classifier semi-supervised classification of tuberculosis patterns on chest ct scans. In: The Third International Workshop on Pulmonary Image Analysis. pp. 41–48 (2010) 21. Sivic, J., Zisserman, A.: Video Google: A text retrieval approach to object matching in videos. In: Proceedings of the Ninth IEEE International Conference on Computer Vision - Volume 2. vol. 2, pp. 1470–1477. IEEE Computer Society (2003) 22. Sørensen, L., Shaker, S.B., Bruijne, M.: Texture classification in lung CT using local binary patterns. In: Proceedings of the 11th international conference on Medical Image Computing and Computer-Assisted Intervention - Part I. pp. 934–941. MICCAI ’08, Springer-Verlag, Berlin, Heidelberg (2008) 23. Tolouee, A., Abrishami-Moghaddam, H., Garnavi, R., Forouzanfar, M., Giti, M.: Texture analysis in lung HRCT images. Digital Image Computing: Techniques and Applications 0, 305–311 (2008) 24. Wildenauer, H., Micusk, B., Vincze, M.: Efficient texture representation using multi-scale regions. In: Proceedings of the 8th Asian conference on Computer vision - Volume Part I. pp. 65–74. Springer-Verlag (2007) 25. Zavaletta, V.A., Bartholmai, B.J., Robb, R.A.: High resolution multidetector CTaided tissue analysis and quantification of lung fibrosis. Academic Radiology 14(7), 772–787 (2007)