Fax: 34-6-3862576. E-mail: juan.camarena. @uv.es. 1128 ..... Dominguez, M. A., H. de Lencastre, J. Linares, and A. Tomasz. 1994. Spread and maintenance of ...
JOURNAL OF CLINICAL MICROBIOLOGY, Apr. 1998, p. 1128–1134 0095-1137/98/$04.0010 Copyright © 1998, American Society for Microbiology
Vol. 36, No. 4
Application of an Optimized and Highly Discriminatory Method Based on Arbitrarily Primed PCR for Epidemiologic Analysis of Methicillin-Resistant Staphylococcus aureus Nosocomial Infections ´ M. NOGUEIRA, JUAN C. NAVARRO, ANTONIO OLMOS, JUAN J. CAMARENA,* JOSE ´ NCHEZ JULIA RISEN, AND ROBERTO SA Department of Microbiology, Hospital “Dr. Peset,” E-46017 Valencia, Spain Received 11 August 1997/Returned for modification 29 September 1997/Accepted 9 January 1998
The optimization of an arbitrarily primed PCR method for typing 96 methicillin-resistant Staphylococcus aureus (MRSA) isolates was compared with pulsed-field gel electrophoresis. Identical results in the differentiation of MRSA clones and identification of the main cluster that included 82 strains (88% of patients) were obtained by both techniques. ing to standard MICs (#4 mg/liter) (6) and E-Test-oxacillin (AB Biodisk, Solna, Sweden). The mecA gene was confirmed by PCR with the RSM2647 and RSM2648 primers (8). The PFGE method of Pre´vost et al. (12) was used, with minor modifications according to the instructions of a different manufacturer (Bio-Rad, Richmond, Calif.). Electrophoresis was performed with the CHEF DRIII electrophoresis system (Bio-Rad) with a 5-s initial pulse, 60-s final pulse, voltage of 6 V/cm, angle of 120°, time of 23 h, and temperature of 13°C (9). Gels were stained with ethidium bromide and photographed. Banding patterns were interpreted according to the method of Bannerman et al. (1), considering as isolates of the same strain (modal pattern) those that appeared identical in size and number of bands and considering as subtypes those with three or fewer band differences. For the AP-PCR protocol, the method of DNA extraction described by Pitcher et al. (10) was used, except that the suspension time of S. aureus colonies in enzymatic solutions was reduced to 15 min, the incubation time was reduced to 15 min, and protein precipitation was reduced to 5 min. The DNA concentration was measured with a GeneQuant II RNA/DNA calculator (Pharmacia Biotech, Uppsala, Sweden). To determine the optimal conditions for the reliability and reproducibility of AP-PCR, the effects of different DNA template concentrations (5, 25, 50, 75, and 100 ng), DNA polymerases (RedHot, an enzyme from Thermus “Icelandicus,” a new strain [Advanced Biotechnologies, Surrey, United Kingdom]; GIBCO-BRL Taq polymerase [Life Technologies, Gaithersburg, Md.]; Boehringer Mannheim Taq polymerase [Boehringer Mannheim, Mannheim, Germany]; and Promega Taq polymerase [Promega, Madison, Wis.], at concentrations of 0.5, 1, 3, 5, 7, and 10 U), arbitrary primers (a total of 20 included in the kit from Operon Technologies, Alameda, Calif., at concentrations of 0.1 to 1 mM), MgCl2 concentrations (0.5, 1, 1.5, 2, 2.5, 3, 3.5, and 4 mM), annealing temperatures (25 to 45°C), and multiplication factors per degree centigrade in ramps of the thermocycling conditions (1, 2, 3, and 4) were tested in triplicate for 11 MRSA strains previously characterized by PFGE. The optimization of the technique was as follows. The PCR mixture consisted of 5 U of RedHot DNA polymerase (Advanced Biotechnologies); 15 mM Tris-HCl (pH 8.8 at 25°C); 2.5 mM MgCl2; 50 mM KCl; 250 mM (each) dATP, dGTP,
Outbreaks of infections caused by methicillin-resistant Staphylococcus aureus (MRSA) continue to be a major problem for patients admitted to intensive care units. Since 1993, there has been an increase in the incidence of nosocomial outbreaks of MRSA strains in different geographic areas in Spain (4, 17), with an incidence of close to 50% at our institution for the period 1994 to 1995, which is covered in the present study. Pulsed-field gel electrophoresis (PFGE) is a highly discriminatory method for typing MRSA isolates because it can distinguish among several concurrent epidemic strains (12). However, it is a time-consuming and expensive typing method not well suited for screening a large number of isolates by a diagnostic laboratory (5). By arbitrarily amplifying variable regions in the bacterial genome (arbitrarily primed PCR [AP-PCR]), an isolate-specific DNA fingerprint can be obtained in a rapid and reproducible manner (11). Although AP-PCR is a cost-effective procedure as well, its discriminatory ability for typing MRSA isolates is lower than that of PFGE (6, 14, 16). Amplification of fragments of the 16S to 23S rRNA intergenic spacer region by ribosome spacer PCR (RS-PCR) (5) or with the nested-PCR-amplified ribosomal DNA spacer region (13) have been proposed recently as being highly reproducible and almost as discriminatory as PFGE for the local investigation of MRSA outbreaks. We describe here the optimization of AP-PCR for typing isolates of MRSA and compared the effectiveness of this rapid assay with that of PFGE. Ninety-six MRSA isolates from 51 patients (31 men and 20 women between 22 and 90 years of age) with nosocomial infection collected from 1994 to 1995 at our institution were included (Table 1), as well as other Staphylococcus isolates from 29 men and 17 women between 27 and 89 years of age (26 methicillin-susceptible S. aureus [MSSA] strains, 17 coagulasenegative strains, and 3 unrelated [community-acquired] MRSA strains), which served as controls (Table 2). Reference strains were S. aureus CECT435 and CECT4630. Methicillin resistance was assessed with 1-mg methicillin disks at 35°C for 24 h on Mueller-Hinton agar supplemented with 4% NaCl, accord* Corresponding author. Mailing address: Department of Microbiology, Hospital “Dr. Peset,” Gaspar Aguilar 90, E-46017 Valencia, Spain. Phone: 34-6-3987515. Fax: 34-6-3862576. E-mail: juan.camarena @uv.es. 1128
VOL. 36, 1998
NOTES
1129
TABLE 1. Clinical features of 51 patients with nosocomial infection and results obtained with isolates analyzed by PFGE and AP-PCR Infection typea
Patient
1 2 3 4
IC NP SWI IC 1 NP
5
SWI 1 NP
6d
SWI
7 8 9e 10
NP PR SWI SWI
11
SI 1 NP
12 13 14 15 16 17 18 19 20
PN SWI NP NP SWI SWI SWI SWI IC 1 SWI 1 NP
21 22 23
B NP SWI
24 25 26 27 28 29 30 31 32 33
NP NP NP NP NP SWI SWI NP B B
34 35 36
B B B
37
B
Wardb
Date (wk/yr)
Isolate
Sitec
NEPH (SUR) ICU NER (SUR) ICU ICU ICU ICU ICU ICU ICU ICU PNE PNE ICU ICU ICU ICU ICU ICU TRA TRA TRA TRA TRA ICU ICU SUR TRA TRA TRA ICU ICU ICU ICU IM (ICU) ORL (SUR) URO (ICU) SUR SUR SUR CIV NEPH NEPH IM PNE (ICU) ORL (SUR) ORL ICU ICU ICU ICU ICU URO (SUR) SUR NEPH (ICU) ICU ICU ICU ICU ICU ICU ICU SUR SUR IM IM
1/94 1/94 2/94 2/94 3/94 3/94 3/94 4/94 4/94 5/94 5/94 6/94 7/94 2/94 2/94 2/94 3/94 3/94 5/94 2/94 3/94 5/94 6/94 7/94 3/94 3/94 4/94 4/94 34/94 35/94 4/94 4/94 4/94 5/94 6/94 8/94 8/94 9/94 12/94 12/94 12/94 15/94 15/94 15/94 16/94 16/94 23/94 16/94 16/94 17/94 18/94 19/94 21/94 24/94 31/94 48/94 49/94 49/94 50/94 51/94 51/94 52/94 3/95 4/95 4/95 4/95
1.1 2.1 3.1 4.1 4.2 4.3 4.4 4.5 4.6 4.7 4.8 4.9 4.10 5.1 5.2 5.3 5.4 5.5 5.6 6.1 6.2 6.3 6.4 6.5 7.1 8.1 9.1 10.1 10.2 10.3 11.1 11.2 12.1 13.1 14.1 15.1 16.1 17.1 18.1 19.1 20.1 20.2 20.3 21.1 22.1 23.1 23.2 24.1 25.1 26.1 27.1 28.1 29.1 30.1 31.1 32.1 33.1 33.2 33.3 33.4 34.1 35.1 36.1 36.2 37.1 37.2
VC BC WE BS S S S VC VC S S S P VC P S PF S S SF WE WE WE WE S PE P WE WE WE BA S S VC S WE WE VC WE WE S WE VC BC S WE WE S BF BF BF S WE WE S BC BC BC BC WE BC BC VC BC BC WE
Typing pattern by: PFGE
AP-PCR
A1 A1 A2 A2 A2 A2 A2 A2 A2 A2 A1 A1 B A2 A2 A2 A2 A2 A2 C C C C C A2 A2 D A2 A2 A2 A2 A2 A2 A1 A1 A1 A2 A2 A2 A2 A1 A1 A1 A1 A3 A1 A1 A1 A3 A1 A1 A1 A2 A1 A1 A1 A1 A1 A1 A1 A1 A1 A1 A1 A1 A1
A A A A A A A A A A A A B A A A A A A C C C C C A A D A A A A A A A A A A A A A A A A A A A A A A A A A A A A A A A A A A A A A A A
Continued on following page
1130
NOTES
J. CLIN. MICROBIOL. TABLE 1—Continued Infection typea
Patient
38
SWI 1 NP
39 40 41
NP NP SWI
42
B
43
SWI 1 NP
44 45 46 47 48 49 50
IC 1 NP UTI UTI SWI SWI SWI SWI
51
B
Wardb
IM IM IM ICU ICU ICU ICU ICU TRA TRA TRA TRA TRA PNE (ICU) ICU ICU ICU ICU ICU NER (ICU) PNE (ICU) IM (ICU) CIV CIV CIV TRA TRA TRA TRA ICU
Date (wk/yr)
Isolate
Sitec
4/95 4/95 4/95 6/95 6/95 6/95 11/95 13/95 13/95 14/95 15/95 16/95 17/95 15/95 16/95 20/95 20/95 21/95 22/95 37/95 42/95 48/95 49/95 49/95 50/95 50/95 50/95 50/95 51/95 51/95
37.3 37.4 37.5 38.1 38.2 38.3 39.1 40.1 41.1 41.2 41.3 41.4 41.5 42.1 42.2 42.3 43.1 43.2 43.3 44.1 45.1 46.1 47.1 48.1 49.1 50.1 50.2 50.3 50.4 51.1
WE WE WE TS VC AF TS S WE WE WE WE WE BC TS BC S PHE VC TS WE WE WE WE WE WE WE WE WE BC
Typing pattern by: PFGE
AP-PCR
A1 A1 A1 A1 A1 A1 A1 A1 A1 A1 A1 A1 A1 A1 A1 A1 A1 A1 A1 A1 A2 A1 E E E F F F F A1
A A A A A A A A A A A A A A A A A A A A A A E E E F F F F A
a
B, bacteremia; PR, peritonitis; IC, infection by catheter; NP, nosocomial pneumonia; SWI, surgery wound infection; SI, skin infection; UTI, urinary tract infection. NEPH, nephrology; SUR, general surgery; NER, neurology; ICU, intensive care unit; PNE, pneumology; TRA, traumatology; IM, internal medicine; ORL, otorhinolaryngology; URO, urology; CIV, vein surgery. If there was a previous department to which patients had been admitted (1 to 5 days before), it is given in parentheses. c VC, venous catheter; BC, blood culture; WE, wound exudate; BS, bronchial secretion; S, sputum; P, pus; TS, tracheal secretion; PF, pleural fluid; SF, sinovial fluid; PE, peritoneal exudate; AF, ascitic fluid; PHE, pharyngeal exudate. d Patient transferred from another district hospital (La Fe). e Patient transferred from another district hospital (Arnau de Vilanova). b
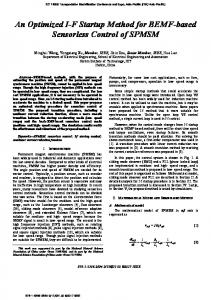
dCTP, and dTTP; 1 mM primer OPA11 (59-CAATCGTCCG T-39); and 50 ng of template DNA for a final volume of 25 ml. Cycling was performed in a Perkin-Elmer PCR machine (model Gene Amp 9600) and consisted of the following steps: denaturation at 94°C for 5 min, followed by 44 cycles of 94°C for 1 min and a ramp of 3 min 52 s to 36°C for 1 min, a ramp of 2 min 24 s to 72°C for 1 min, and a ramp of 1 min 18 s to 94°C, followed by 10 min of extension at 72°C. Five strains were used as internal controls in each AP-PCR assay. For the analysis of reproducibility and similarity, each new PFGE and AP-PCR pattern was included in subsequent tests for comparison. The similarity between PFGE and AP-PCR patterns was assessed by using the Dice coefficient for each pair of isolates. The GelPrinter and Lane Manager 2.0 software (TDI, S.A., Madrid, Spain) were used for the analysis. A coefficient of similarity higher than 95% was required to establish a same-clone origin. PFGE after restriction with SmaI resolved the chromosomal DNA of the 96 MRSA isolates into six main distinct PFGE patterns (A to F). PFGE type A contained 82 strains (88% of patients), which could be further classified into three subtypes (A.1 to A.3) (Fig. 1), of which subtype A.1 represented the majority (48 strains [50%]), followed by A.2 (32 strains [33.3%] and A.3 (2 strains [2.1%]). The remaining PFGE patterns had no subtypes. PFGE types B, C, D, E, and F contained one, five, one, three, and four isolates, respectively (Table 1). The Dice
coefficient of similarity among major patterns had an average value of 67%. The subtype variants showed similarity values higher than 95%. Control isolates showed different PFGE patterns (Table 2), with average similarity values ranging between
FIG. 1. The principal PFGE pattern (type A). Lanes: 1, PFGE marker I, l ladder (Boehringer Mannheim); 2, 5, 6, 9, 13, and 15, SmaI macrorestriction pattern A1; 3, 4, 7, 10, 11, 12, and 14, SmaI macrorestriction pattern A2; 8, SmaI macrorestriction pattern A3.
VOL. 36, 1998
NOTES
1131
TABLE 2. Features of the control isolates tested and results of the characterization by PFGE and AP-PCR Isolate
Warda
Date (wk/yr)
Siteb
A B C D E F G H I J H A K L M N O P Q R S T U V N W
MSSA1 MSSA2 MSSA3 MSSA4 MSSA5 MSSA6 MSSA7 MSSA8 MSSA9 MSSA10 MSSA11 MSSA12 MSSA13 MSSA14 MSSA15 MSSA16 MSSA17 MSSA18 MSSA19 MSSA20 MSSA21 MSSA22 MSSA23 MSSA24 MSSA25 MSSA26
ICU NER CIR ICU ICU TRA ICU ICU CIR NEPH ICU ICU CIR MI ICU ICU NEU CIV TRA NEU ICU ICU ICU ICU ICU ICU
1/94 2/94 4/94 4/94 5/94 5/94 12/94 20/94 24/94 31/94 20/94 1/94 3/95 4/95 6/95 16/95 42/95 49/95 50/95 12/94 24/94 31/95 18/95 14/95 16/95 51/95
I II III I II VI VII VIII IX X XI XII XIII XIV XV XVI XVII
CNS1 CNS2 CNS3 CNS4 CNS5 CNS6 CNS7 CNS8 CNS9 CNS10 CNS11 CNS12 CNS13 CNS14 CNS15 CNS16 CNS17
CIR CIR URO CIR CIR ICU ORL NEU ICU MI CIV ICU ICU CIR ICU TRA ICU
C1 C2 C3
COM1 COM2 COM3
E E E
Patient
Identification by: PFGE
AP-PCR
BC P WE BC PHE WE VC BC P P S BC WE TS BC BC TS VC WE WE VC P BC BC BC BC
CO1a CO2 CO3 CO4 CO5 CO6 CO7 CO8a CO9 CO10 CO8b CO1b CO11 CO12 CO13 CO14a CO15 CO16 CO17 CO18 CO19 CO20 CO21 CO22 CO14b CO23
CO1 CO2 CO3 CO4 CO5 CO6 CO7 CO8 CO9 CO10 CO8 CO1 CO11 CO12 CO13 CO14 CO15 CO16 CO17 CO18 CO19 CO20 CO21 CO22 CO14 CO23
4/94 12/94 21/94 4/94 12/94 21/95 8/94 16/94 17/94 6/94 12/94 18/94 19/94 24/94 51/94 15/95 20/95
WE WE WE WE WE BC P BF WE PHE VC BC BC S S WE BC
CO24a CO25a CO26 CO24b CO25b CO27 CO28 CO29 CO30 CO31 CO32 CO33 CO34 CO35 CO36 CO37 CO38
CO24a CO25 CO26 CO24b CO25 CO27 CO28 CO29 CO30 CO31 CO32 CO33 CO34 CO35 CO36 CO37 CO38
14/94 21/94 34/95
PHE PHE WE
CO39 CO40 CO41
CO39 CO40 CO41
a NEPH, nephrology; SUR, general surgery; NER, neurology; ICU, intensive care unit; PNE, pneumology; TRA, traumatology; IM, internal medicine; ORL, otorhinolaryngology; URO, urology; CIV, vein surgery; E, communitary. b VC, venous catheter; BC, blood culture; WE, wound exudate; BS, bronchial secretion; S, sputum; P, pus; TS, tracheal secretion; PHE, pharyngeal exudate.
43 and 84%. Figure 2A shows the epidemiologic clustering according to all PFGE banding patterns of all S. aureus strains included in the study. AP-PCR analysis generated between 8 and 17 DNA products from 0.4 to 3.2 kb (Fig. 3) and also characterized the 96 MRSA isolates into six main distinct clusters (A to F). Eightytwo MRSA isolates (88% of patients) were grouped into main cluster A. The remaining AP-PCR clusters, B, C, D, E, and F, contained one, five, one, three, and four isolates, respectively (Table 1). The Dice coefficient of similarity among major patterns had an average value of 50%. Control isolates showed different AP-PCR patterns (Table 2), with an average similarity value lower than 50%, except for two MSSA strains and one
unrelated MRSA strain. Figure 2B shows the epidemiologic clustering according to all AP-PCR banding patterns of all S. aureus strains included in the study. Complete coincidence between PFGE and AP-PCR in differentiation of MRSA clones and in identification of the main cluster that included 82 MRSA strains was obtained. During the past few years, MRSA has become an increasing source of nosocomial infections causing therapeutic and control problems in hospitals in many parts of the world (3, 7). Accurate epidemiological typing by reproducible and rapid methods is a major step in determining MRSA clones and sources of transmission. Although PFGE was developed as an epidemiological marker for typing S. aureus strains (10), dif-
FIG. 2. Unweighted pair group method with arithmetic mean Tree. (A) PFGE. (B) AP-PCR. Results are from analysis of similarity by Dice’s coefficient, corresponding to all strains included in the study.
1132
VOL. 36, 1998
NOTES
FIG. 2—Continued.
1133
1134
NOTES
J. CLIN. MICROBIOL. “Instituto Valenciano de Investigaciones Agrarias” for providing the CHEF DRIII electrophoresis system, and Marta Pulido for editing the manuscript and editorial assistance. REFERENCES
FIG. 3. OPA11-PCR patterns belonging to different clonal groups. Lanes: 1, 100-bp DNA ladder (GIBCO BRL); 2 to 10, different PCR fingerprinting profiles (2, 8, 9, and 10, pattern A; 3, pattern CNS2; 4, pattern C; 5, pattern MSSA9; 6, pattern D; 7, pattern MSSA18).
ferent PCR-based methods have been introduced to overcome the complexity of this technique. Among these relatively novel techniques, AP-PCR has been one of the most used because of its simplicity and rapidity (a few hours versus about 3 days for PFGE). Recently, RS-PCR (5) and the nested-PCR-amplified ribosomal DNA spacer region (13) have been proposed as alternatives to PFGE for typing MRSA isolates in local investigations of MRSA outbreaks (5, 13). However, PFGE detects minor variations among the isolates and could identify variants that are not discriminated by RS-PCR (5). Moreover, the nested-PCR-amplified ribosomal DNA spacer region increases the time-consuming aspects of detection and enhances the risks of contamination. Based on our previous experience of AP-PCR with commercially available primers (2), we selected this simple fast technique as an epidemiological molecular marker. In contrast to the study of Saulnier et al. (14), in which PFGE was superior to the randomly amplified polymorphic DNA assay for typing MRSA strains, we obtained a complete correlation between PFGE and the optimization of AP-PCR. This included 1 mM OPA11 primer, 50 ng of DNA template, 5 U of RedHot DNA polymerase, 2.5 mM MgCl2, a 36°C annealing temperature, and ramps in the thermocycling conditions. The optimized AP-PCR technique was a useful tool for the discrimination and surveillance of MRSA strains associated with an outbreak localized in the intensive care and surgery wards that spread to other departments. Reproducible patterns for different MRSA, MSSA, and coagulase-negative S. aureus clones confirmed the validity of this method. The comparative typing of the 136 strains (40 as controls) by SmaI macrorestriction patterns and OPA11-PCR resulted in the same clustering by similarity in dendrograms and disclosed the most persistent local MRSA clone in the hospital. In conclusion, together with a simple method of template DNA extraction, OPA11-PCR seems to be a very rapid, inexpensive, and useful technique for epidemiological typing of S. aureus strains in routine surveillance. We thank the staff of the Department of Microbiology of Hospital “Dr. Peset” for useful comments, M. Cambra and M. J. Asins from the
1. Bannerman, T. L., G. A. Hancock, F. C. Tenover, and J. M. Miller. 1995. Pulsed-field electrophoresis as a replacement for bacteriophage typing of Staphylococcus aureus. J. Clin. Microbiol. 33:551–555. 2. Camarena, J. J., J. M. Nogueira, M. A. Dası´, F. Moreno, R. Garcı´a, E. Ledesma, J. Llorca, and J. Herna ´ndez. 1995. DNA amplification fingerprinting for subtyping Neisseria gonorrhoeae strains. Sex. Transm. Dis. 22:128–135. 3. Cotter, L., M. Lynch, B. Cryan, P. Greer, and S. Fanning. 1997. Investigation of a methicillin-resistant Staphylococcus aureus (MRSA) outbreak in an Irish hospital: triplex PCR and DNA amplification fingerprinting. J. Hosp. Infect. 36:37–47. 4. Dominguez, M. A., H. de Lencastre, J. Linares, and A. Tomasz. 1994. Spread and maintenance of a dominant methicillin-resistant Staphylococcus aureus (MRSA) clone during an outbreak of MRSA disease in a Spanish hospital. J. Clin. Microbiol. 32:2081–2087. 5. Kumari, D. N. P., V. Keer, P. M. Hawkey, P. Parnell, N. Joseph, J. F. Richardson, and B. Cookson. 1997. Comparison and application of ribosome spacer DNA amplicon polymorphisms and pulsed-field gel electrophoresis for differentiation of methicillin-resistant Staphylococcus aureus strains. J. Clin. Microbiol. 35:881–885. 6. Leitch, C., and S. Boonlayangoor. 1992. Tests to detect oxacillin (methicillin)-resistant staphylococci with an oxacillin screen plate, p. 5.5.1–5.5.7. In H. D. Isenberg (ed.), Clinical microbiology procedures handbook, vol. 1. American Society for Microbiology, Washington, D.C. 7. Mulligan, M. E., K. A. Murray-Leisure, B. S. Ribner, H. C. Standiford, J. F. John, J. A. Korvick, C. A. Kauffman, and V. L. Yu. 1993. Methicillin-resistant Staphylococcus aureus: a consensus review of the microbiology, pathogenesis, and epidemiology with implications for prevention and management. Am. J. Med. 94:313–328. 8. Murakami, K., W. Minamide, K. Wada, E. Nakamura, H. Teraoka, and S. Watanabe. 1991. Identification of methicillin-resistant staphylococci by polymerase chain reaction. J. Clin. Microbiol. 29:2240–2244. 9. Pfaller, M. A., R. J. Hollis, and H. S. Sader. 1992. PFGE analysis of chromosomal restriction fragment, p. 10.5.c.1–10.5.c.12. In H. D. Isenberg (ed.), Clinical microbiology procedures handbook, vol. 2. American Society for Microbiology, Washington, D.C. 10. Pitcher, D. G., N. A. Saunders, and R. J. Owen. 1989. Rapid extraction of bacterial genomic DNA with guanidium thiocyanate. Lett. Appl. Microbiol. 8:151–156. 11. Power, E. G. M. 1996. RAPD typing in microbiology—a technical review. J. Hosp. Infect. 34:247–265. 12. Pre´vost, G., B. Pottecher, M. Dahlet, M. Bientz, J. M. Mantz, and Y. Piemont. 1991. Pulsed field electrophoresis as a new epidemiological tool for monitoring methicillin-resistant Staphylococcus aureus in an intensive care unit. J. Hosp. Infect. 17:255–269. 13. Saruta, K., T. Matsunaga, M. Kono, S. Hoshina, S. Ikawa, O. Sakai, and K. Machida. 1997. Rapid identification and typing of Staphylococcus aureus by nested PCR amplified ribosomal DNA spacer region. FEMS Microbiol. Lett. 146:271–278. 14. Saulnier, P., C. Bourneix, G. Pre´vost, and A. Andremont. 1993. Random amplified polymorphic DNA assay is less discriminant than pulsed-field gel electrophoresis for typing strains of methicillin-resistant Staphylococcus aureus. J. Clin. Microbiol. 31:982–985. 15. Tyler, K. D., G. Wang, S. D. Tyler, and W. M. Johnson. 1997. Factors affecting reliability and reproducibility of amplification-based DNA fingerprinting of representative bacterial pathogens. J. Clin. Microbiol. 35:339– 346. 16. Van Belkum, A., J. Kluytmans, W. van Leeuwen, W. Bax, W. Quint, E. Peters, A. Fluit, C. Vandenbroucke-Grauls, A. van den Brule, H. Koeleman, W. Melchers, J. Meis, A. Elaichouni, M. Vaneechoutte, F. Moonens, N. Maes, M. Struelens, F. Tenover, and H. Verbrugh. 1995. Multicenter evaluation of arbitrarily primed PCR for typing of Staphylococcus aureus strains. J. Clin. Microbiol. 33:1537–1547. 17. Vindel, A., and J. A. Saez-Nieto. 1992. Caracterizacio ´n de cepas de Staphylococcus aureus resistentes a meticilina causantes de brotes mediante fagotipicacio ´n. Enferm. Infecc. Microbiol. Clin. 10(Suppl. 3):36–38.