Application of Classification Models on Credit Card Fraud Detection Aihua Shen1, Rencheng Tong1, Yaochen Deng2 1
School of Management, Graduate University of the Chinese Academy of Sciences, Beijing, 100084, China 2 School of Foreign Languages, Dalian Maritime University, Dalian, 116026, China
[email protected] [email protected] [email protected] ABSTRACT
Along with the great increase in credit card transactions, credit card fraud has become increasingly rampant in recent years. This study investigates the efficacy of applying classification models to credit card fraud detection problems. Three different classification methods, i.e. decision tree, neural networks and logistic regression are tested for their applicability in fraud detections. This paper provides a useful framework to choose the best model to recognize the credit card fraud risk. Keywords: Credit card fraud detection, Classification models 1. INTRODUCTION Fraud is a serious problem faced by credit card issuers. Credit card transactions had a total loss of 800 million dollars of fraud in U.S.A. in 2004. In U.K,in the same year, the loss caused by the credit card fraud amounts to 425 million pounds (750 million U.S. dollars). Much of the fraud was organized by criminals, and intelligent fraud models are the most important weapons (Chen, 2006). In china, the lag of risk management becomes one of the biggest obstacles to business growth and profitability. The credit card risk management has become one of the most important topics for researchers in the private financial business sector in some banks in china. Credit card fraud can be divided into 2 types: inner card fraud and external card fraud. Inner card fraud intends to defraud the cash. Usually it is the collusion between merchants and cardholders, using false transactions to defraud banks cash. External card fraud is mainly embodied at using the stolen, fake or counterfeit credit card to consume, or using cards to get cash in disguised forms, such as buying the expensive, small volume commodities or the commodities that can easily be changed into cash. This paper is mainly devoted to the investigation of the external card fraud, which accounts for the majority of credit card frauds. In this study, three classification methods are tested for their applicability in fraud detection, i.e. decision tree, neural networks and logistic regression. The three methods are compared in terms of their predictive accuracy. The remainder of this paper is organized as follows. Section 2 reviews relevant studies. Section 3 provides a brief description of the research methods used. Section 4 describes the research data and experiments. Section 5
1-4244-0885-7/07/$20.00 ©2007 IEEE.
summarizes and analyzes empirical results. Section 6 concerns the conclusions. 2. A REVIEW Detecting credit card fraud is a difficult task when using normal procedures, so the development of the credit card fraud detection model has become of significance, whether in the academic or business community recently. These models are mostly statistics-driven or artificial intelligent-based, which have the theoretical advantages in not imposing arbitrary assumptions on the input variables. Ghosh, Reilly (1994) used a neural network based fraud detection system to train on a large sample of credit card account transactions which come from a credit card issuer. The network detected significantly more fraud accounts with significantly fewer false positives over rule-based fraud detection procedures. Hanagandi, Dhar and Buescher (1996) used historical information on credit card transactions to generate a fraud score model. The report described a fraud-nonfraud classification methodology using a radial basis function network with a density based clustering approach. The methodology tested on a fraud detection problem and the preliminary results obtained were satisfactory. Hansen, McDonald, Messier, and Bell (1996) used a powerful generalized qualitative response model to predict management fraud based on a set of data developed by an international public accounting firm. The model included the probit and logit techniques. The results indicated a good predictive capability for both symmetric and asymmetric cost assumptions. Dorronsoro, Ginel, Sgnchez and Cruz (1997) built an online system for fraud detection of credit card operations based on a neural classifier. To ensure proper model construction, a nonlinear version of Fisher's
transactions of this card within five days
discriminant analysis has been used. The system is fully operational and currently handles more than 12 million operations per year with very satisfactory results. 3. RESEARCH METHODOLOGY
3.2 Methods 3.2.1 Decision Tree
3.1 Data Set The forecast data used for the fraud models were mainly come from the real-time transaction authorized information and the history database. Transaction posting information, Non Monetary Info and Inquiry information sometimes were used in a certain extent. A transaction database including more than 40 fields was got. Under the terms of our nondisclosure agreement, we can not reveal all the details of the database schema, nor the contents of the data. So in this paper we only list few variables which are common data schema used by most of banks. The data used were already labeled by the bank as fraud or non-fraud. Of all the records, 0.07% are fraud transactions. We used all fraud data and some non-fraud ones which were sampled from all the non-fraud records as the training set. Some variables for this research are shown in Table 1. Data were pre-processed as follows. Missing values were omitted. On the basis of the original variables, various transformations were conducted to the data in accordance with distribution, such as log transformation, data discretization or standardization to create more derivatives variables. Then feature selection and extraction were conducted in the derived variables. Consequently we got the final data set for modeling. Table 1 Variable POS_no account_no trans_date trans_time trans_amt
type char char date time float
MCC card_type exp_date C1
int int date float
C2
int
C3
int
C4
float
C5
float
C6
int
C7
int
C8
float
Definition of variables Definition POS terminal number Account number Transaction date Transaction time The amount of a credit card transaction Merchant Category Code Card type Expiration Date
The total amount of transactions of this card in the same day The number of transactions of this card in the same day The failure number of transactions of this card in the same day The average transaction amount of this card in the same day The total amount of transactions of this card within five days The number of transactions of this card within five days. The failure number of transactions of this card within five days The average amount of
Coming of the concept learning system, decision tree method has developed ID3 method (Quinlan, 1986) and C4.5 (Quinlan, 1993) that can deal with continuous data. With the strategy of separating and resolving, decision tree usually separates the complex problem into many simple ones and resolves the sub-problems through repeatedly using, which is a data mining method to discover training several kinds of classifying knowledge via constructing decision tree. The core of decision tree model is how to construct a decision tree with high precision and small scale. The decision tree is a table of tree shape with connecting lines. Each node is either a ramification node followed with more nodes or only one leaf node signed by classification. Decision tree method has many advantages. The first is the high flexibility that it is a non-parameter method without any assumption for the data distribution, and the second is the good haleness. Besides, it is explainable, which is also the reason of its wide utilization. 3.2.2 Neural Networks Neural networks topologies, or architectures, formed by organizing nodes into layers and linking these layers of neurons with modifiable weighted interconnections (Rumelhart, 1986). In recent years, neural network researchers have incorporated methods from statistics and numerical analysis into their networks. Being a nonlinear mapping relation from the input space to output space, neural networks can learn from the given cases and summarize the internal principles of data even without knowing the potential data principles ahead. And it can adapt its own behavior to the new environment with the results of formation of general capability of evolution from present situation to the new environment. From the aspect of the pure theory, the nonlinear neural networks method is superior to the statistical methods in the application for credit card fraud detection. It is sometime unusual in the practice research even though the common advantages of the neural networks as a possible result of usage of improper network structure and learning computing method. On the other hand there are still many disadvantages for the neural networks, such as the difficulty to confirm the structure, the efficiency of training, excessive training, and so on. 3.2.3 Logistic Regression More and more statistical models were applied at data mining tasks include regression analysis, multiple discriminant analysis, logistic regression, and Probit
method, etc (Altman, Marco 1994; Flitman, 1997). Logistic regression is useful for situations in which we want to be able to predict the presence or absence of a characteristic or outcome based on values of a set of predictor variables. It is similar to a linear regression model but is suited to models where the dependent variable is dichotomous. Logistic regression coefficients can be used to estimate odds ratios for each of the independent variables in the model and it is applicable to a broader range of research situations than discriminant analysis. Linear probability and multivariate conditional probability models (Logit and Probit) were introduced to the business failure prediction literature and the contribution of these methods was in estimating the odds of a firm’s failure with probability (Ohlson, 1980; Martin, 1997).
Lift Value by Decile
Cumulative Lift by Decile
ANN
Logit
Tree
ANN
Logit
Tree
Base line
0.1
5.88
5.84
3.89
5.88
5.84
3.89
1
0.2
1.33
1.02
1.95
3.61
3.43
2.92
1
0.3
0.66
0.66
0.97
2.63
2.51
2.27
1
0.4
0.66
0.53
0.93
2.13
2.01
1.94
1
0.5
0.44
0.58
0.27
1.80
1.73
1.60
1
0.6
0.49
0.62
0.58
1.58
1.54
1.43
1
0.7
0.22
0.18
0.71
1.38
1.35
1.33
1
0.8
0.31
0.49
0.71
1.25
1.24
1.25
1
0.9
0.00
0.09
0.00
1.11
1.11
1.11
1
1.0
0.00
0.00
0.00
1.00
1.00
1.00
1
Decile
4. EXPERIMENT RESULTS AND ANALYSIS
7
Neural Network Logistic Regression Decision Tree baseline
6
In our research, three alternative models based on logistic regression, neural networks and decision tree were built. To evaluate these models, we used transactions from 2005 for training, 2006 for validating and testing.
lift
5 4 3 2
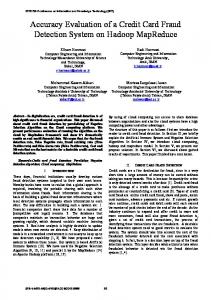
Lift table and lift chart were used to describe the usefulness of the model to create the scored data set. "Lift" is probably the most commonly used metric to measure the performance of targeting models in classification applications. In a lift chart for binary target, the scored data set is sorted by the posterior probabilities of the event level in descending order. Then we quantified by dividing the records into deciles - ten even groups - into which transactions are placed, based on their predicted probability of response. The performance among the predictive models is presented in Table 2. The left column shows deciles and the highest responders are put into decile 1, etc. Compared to the average response rate of 0.07 percent, this gives a lift of 5.88 in the top decile for neural networks, 5.84 for logistic regression and 3.89 for decision tree respectively. At the same time each successive decile has a lower response rate. The cumulative response lift values on the right part of the table show the average performance of the three models. The result of Table 2 is simultaneously shown in Fig.1 in order to evaluate the relative performance of three methods more distinctively. From Figure 1, it is clear that neural networks model provides higher lift than a logistic regression and decision tree on the same data, while neural networks slightly better than logistic regression. This provides a key factor in choosing the models and we choose the neural networks as the final method to build the prediction model. Table 2. The lift value by decile
1 0 0.1
0.2 0.3
0.4
0.5
0.6
0.7
0.8 0.9
1
deciles
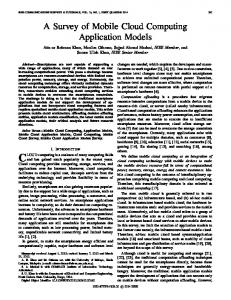
Figure 1. The cumulative lift chart We also used the capture chart to compare the cumulative percent of responses captured as each decile is added to the target. Table 3 shows that the top decile captures about 59% of the responders using neural networks or logistic regression while only 38.94% of the responders using decision tree. Figure 2 compares three models to a random baseline where two deciles (10% of the population) would capture 10% of the responders. This result is much better than not targeting. The greater the area between the model and the baseline, the more the method is able to concentrate responders in the top deciles. Table 3.
The captured response by decile
Captured Rate by Decile
Cumu-captured Rate by Decile
ANN
Logit
Tree
ANN
Logit
Tree
0.1
59%
58%
39%
59%
58%
39%
0.1
0.2
13%
10%
19%
72%
68%
58%
0.2
0.3
7%
7%
10%
79%
75%
68%
0.3
0.4
7%
5%
9%
86%
80%
77%
0.4
0.5
4%
6%
3%
90%
86%
80%
0.5
Decile
Base line
0.6
5%
6%
5%
95%
92%
85%
0.6
0.7
2%
2%
8%
97%
94%
93%
0.7
0.8
3%
5%
7%
100%
99%
100%
0.8
0.9
0%
1%
0%
100%
100%
100%
0.9
1.0
0%
0.00%
0%
100%
100%
100%
1.0
% captured response
120% 100% 80% 60% 40%
Neural Network Logistic Regression Decision Tree baseline
20% 0%
0.1 0.2 0.3 0.4 0.5 0.6 0.7 0.8 0.9
1
deciles
Figure 2. The cumulative percent captured response 5. CONCLUSIONS Credit card fraud has become more and more rampant in recent years. To improve merchants’ risk management level in an automatic, scientific and effective way, building an accurate, efficient and easy-handling credit card risk monitoring system is one of the key tasks for the merchant banks. In this study, three classification methods were used to a deep analysis of the credit cards history business information and have built the fraud detecting models. We present our work and demonstrate the advantages of the data mining techniques including neural networks, logistic regression and decision tree to the credit card fraud detection, for the purpose of reducing the bank’s risk. The results show that the proposed classifier of neural networks and logistic regression approaches outperform decision tree in solving the problem under investigation. Under this framework, credit card issuers can utilize fraud models to compare the transaction information with the historical trading patterns to predict the probability of a current transaction, and provide a scientific basis for the intelligent authorized anti-fraud
strategy, or refuse to authorize and launch investigations to suspicious transactions. REFERENCES [1] Altman, E. I., Marco, G., & Varetto, F. Corporate distress diagnosis comparisons using linear discriminant analysis and neural networks. Journal of Banking and Finance, 18(3), 505–529, 1994. [2] Chen J. Development and Application of Intelligent Transaction Scoring Model of the fraud risk. Credit card in China. 2006. [3] Dorronsoro, Ginel, Sgnchez and Cruz. Neural fraud detection in credit card operations. Neural Networks, IEEE Transactions. Volume: 8, Issue: 4: 827-834, 1997. [4] Flitman A.M. Towards analysing student failures: neural networks compared with regression analysis and multiple discriminant analysis. Computers & Operations Research, Volume 24, Issue 4, 367-377, 1997. [5] Ghosh, S. Reilly, D.L. Credit card fraud detection with a neural-network. Decision Support and Knowledge-Based Systems, Proceedings of the Twenty-Seventh Hawaii International Conference. Volume 3: 621-630, 1994. [6] Hanagandi, V. Dhar, A. Buescher, K. Density-based clustering and radial basis function modeling to generate credit card fraud scores. Computational Intelligence for Financial Engineering, 1996. [7] Hansen, J. V., McDonald, J. B., Messier, W. F., & Bell, T. B. A generalized qualitative - response model and the analysis of management fraud. Management Science, 42(7), 1022-1032, 1996. [8] Martin, D. Early warning of bank failure: A logit regression approach. Journal of Banking and Finance, 1, 249–276, 1997. [9] Ohlson, J.A. Financial ratios and probabilistic prediction of bankruptcy. Journal of Accounting Research, 18(1), 109–131, 1980. [10]Quinlan J.R. C4.5 Programs for Machine Learning, Morgan Kaufmann, San Mateo, CA. 1993. [11]Quinlan J.R. Introduction to decision trees. Mach Learning;1(1):81–106, 1986. [12]Rumelhart D.E. McClelland J.L. Parallel Distributed Processing. Experiments in the Microstructure of Cognition, MIT Press, Cambridge, MA, 1986.