develop software tools that monitor HVAC equipment and ... tools that rely on trend data are hampered by the fact that most ... central location for trending.
KC-03-8-1
Application of Control Charts for Detecting Faults in Variable-Air-Volume Boxes Jeffrey Schein
John M. House, Ph.D.
Associate Member ASHRAE
Member ASHRAE
ABSTRACT This paper describes a fault detection method developed for application to variable-air-volume (VAV) boxes. VPACC (VAV Box Performance Assessment Control Charts) is a fault detection tool that uses a small number of control charts to assess the performance of VAV boxes. The underlying approach, while developed for a specific type of equipment and control sequence, is general in nature and can be adapted to other types of VAV boxes. VPACC has been tested using emulation, laboratory, and field data sets. The results are encouraging. VPACC successfully detected each of the faults introduced in the emulation and laboratory testing and also detected two faults that were not intentionally implemented. In addition, no false alarms were identified in the emulation and laboratory testing. The assessment of VPACC with field data was not as straightforward, however, VPACC alarms for the field data do seem to point to several design and operational issues. INTRODUCTION The primary purpose of heating, ventilating, and airconditioning (HVAC) equipment in commercial buildings is to provide a comfortable and healthy environment for occupants. Variable-air-volume (VAV) air-handling systems are commonly used for conditioning and delivering the air to occupied zones. VAV boxes are an integral part of such systems and are the final piece of equipment that air passes through prior to reaching the occupants. As such, it is important to ensure that these devices operate correctly. There has been considerable effort in the recent past to develop software tools that monitor HVAC equipment and controls. The International Energy Agency Annex 25 source
book (IEA 1996) describes the work of an international collaboration in which data sets from simulation and laboratory test rigs were used to develop various methods for detecting and diagnosing HVAC equipment and control faults. Subsequent to this, the methods were tested and further developed using data from field sites (IEA 2001). Many other studies on the topic of fault detection and diagnosis (FDD) of HVAC equipment and controls appear in the literature; however, only two were identified that focused on applying FDD techniques to VAV boxes. Seem et al. (1997) describe a set of indices for assessing the performance of control loops and show how these indices can be used to detect faults in VAV boxes and airhandling units (AHUs). The performance indices are embedded in commercial VAV box controllers and, by comparing the performance indices of a number of boxes, can be used to quickly identify boxes that are not operating correctly. Dodier et al. (1998) describe an FDD scheme for HVAC equipment and present results from the application of the scheme to a fanpowered VAV box with two stages of electric reheat. The FDD scheme produced few false alarms when tested with laboratory data; however, misdiagnoses of failure states were more common. The study provided some evidence of the difficulty of diagnosing faults in HVAC equipment. The challenges presented in detecting and diagnosing faults in VAV boxes are similar to those encountered with other pieces of HVAC equipment. Generally there are very few sensors, making it difficult to ascertain what is happening in the device. Limitations associated with controller memory and communication capabilities further complicate the task. FDD tools that rely on trend data are hampered by the fact that most VAV box controllers do not have onboard trending capabilities and communication networks are easily overwhelmed when the data necessary for fault detection are transferred to a
Jeffrey Schein is a mechanical engineer in the Building Environment Division, Building and Fire Research Laboratory, National Institute of Standards and Technology, Gaithersburg, Md. John M. House is a research engineer with the Iowa Energy Center, Ankeny, IA.
2003 ASHRAE. THIS PREPRINT MAY NOT BE DISTRIBUTED IN PAPER OR DIGITAL FORM IN WHOLE OR IN PART. IT IS FOR DISCUSSION PURPOSES ONLY AT THE 2003 ASHRAE ANNUAL MEETING. The archival version of this paper along with comments and author responses will be published in ASHRAE Transactions, Volume 109, Part 2. ASHRAE must receive written questions or comments regarding this paper by July 11, 2003, if they are to be included in Transactions.
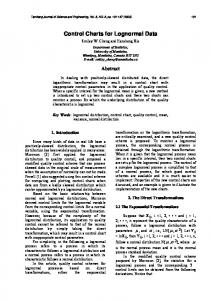
Figure 2 Typical control sequence for a pressureindependent VAV box with hydronic reheat.
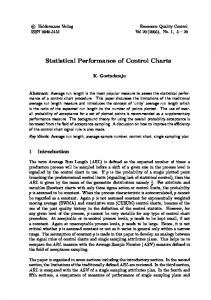
Figure 1 Schematic diagram of a single-duct pressureindependent VAV box with hydronic reheat. central location for trending. The number of different types of VAV boxes and lack of standardized control sequences add a final level of complexity to the challenge. This set of constraints is counterbalanced by the fact that VAV boxes are much more numerous than other pieces of HVAC equipment. For instance, buildings may have 10 to 15 times more VAV boxes than AHUs. Hence, maintenance staffs would clearly benefit from a tool that assisted them in monitoring VAV box operation. The needs and constraints described above have led to the development of VAV Box Performance Assessment Control Charts (VPACC), a fault detection tool that uses a small number of control charts to assess the performance of VAV boxes. The underlying approach, while developed for a specific type of VAV box and control sequence, is general in nature and can be adapted to other types of VAV boxes. Because VPACC is relatively simple and requires only a small number of values to be stored in memory, it can be (and has been) embedded directly in VAV box controllers. The objective of this paper is to describe the fault detection tool VPACC and to present results of testing with emulation, laboratory, and field data sets. The paper begins with a description of a typical VAV box and control sequence. Control charts are then introduced and their application to VAV boxes described. Next, various data sources used to produce data for testing VPACC are described and the faults that are implemented in the emulation and laboratory environments are presented. Results are then presented, followed by conclusions and recommendations. SYSTEM DESCRIPTION Figure 1 is a diagram of a typical single-duct pressureindependent VAV box with hydronic reheat. The diagram depicts a damper that is used to modulate airflow to the zone 2
and a control valve that modulates hot water flow to the reheat coil. Several sensors are also shown in Figure 1. The thermostat measures the air temperature in the zone. The flow sensor measures the flow rate of air into the zone. Finally, the discharge air temperature sensor measures the temperature of the airstream entering the zone. This sensor is used to provide information for diagnostic rather than control purposes. The VAV box controller reads the sensor information, computes control outputs for the damper and reheat valve, and transmits these signals to the appropriate actuators. Control systems for pressure-independent VAV boxes commonly use a cascaded control strategy to maintain the zone temperature at the setpoint value. A typical control sequence is shown graphically in Figure 2. A heating setpoint and a cooling setpoint are specified. As the zone temperature increases above the cooling setpoint, the airflow rate to the zone increases proportionally. This is accomplished by resetting the setpoint value of the airflow rate upward and modulating the damper to achieve this flow rate. As the zone temperature decreases toward the cooling setpoint, the airflow rate setpoint is decreased and the damper gradually closes until it is providing the minimum flow rate necessary for ventilation. At this point the zone temperature is equal to the cooling setpoint. If the zone temperature continues to decrease and reaches the heating setpoint, the reheat valve will begin to open. The airflow rate can also be varied in the heating mode, with the airflow increasing as the temperature decreases. Alternatively, a higher fixed airflow rate may be specified for heating operation to improve the distribution of the warm air. In Figure 2, it is assumed that a fixed airflow rate associated with the ventilation requirement of the zone is provided in the heating mode. The relative simplicity of the control strategy described above would appear to make fault detection fairly straightforward. The challenge comes from the fact that there are many types of VAV boxes (e.g., parallel and series fan-powered boxes, dual-duct boxes) and many different control strategies. The development of a fault detection tool that can be applied KC-03-8-1
lated error indicate an out of control process. The normalized process error is defined as xi – x z i = -----------σˆ
(1)
where xi = process error at sampling time i, = estimate of the mean value of the process error, x σˆ = estimate of the standard deviation of the process error. The normalized process error is used to compute two cumulative sums defined as follows (Ryan 2000): Figure 3a Example of data from an “out of control” process.
Figure 3b CUSUM control chart for the data in Figure 3a with k = 0.5 and h = 5. with limited changes to these different scenarios is described in the following section. METHODOLOGY VPACC uses a small number of control charts to monitor the performance of VAV boxes. Control charts are common tools for monitoring control processes wherein a measured quantity is compared to upper and lower limits that define allowable (or fault free) operation. If the measured quantity falls outside these limits, the process is said to be “out of control.” The limits are typically defined using statistical parameters and, therefore, control charts are often referred to as statistical quality control charts. CUSUM Charts There are many different types of control charts. VPACC implements an algorithm known as a CUSUM (cumulative sum) chart. The basic concept behind CUSUM charts is to accumulate the error between a process variable and the expected value of the variable. Large values of the accumuKC-03-8-1
S i = max [ 0, z i – k + S i – 1 ]
(2a)
T i = min [ 0, z i + k + T i – 1 ]
(2b)
where = cumulative sum for positive errors at sampling time i, Si Ti = cumulative sum for negative errors at sampling time i, k = slack parameter. Positive values of z greater than k cause the sum S to move away from zero and the sum T to approach or remain at zero. Negative values of z less than –k cause the sum T to move away from zero and the sum S to approach or remain at zero. A process is said to be out of control when either S exceeds a threshold value defined by the parameter h or T falls below –h. Figure 3 (Ryan 2000) presents normalized data and the S and T cumulative sums for k = 0.5 and h = 5. The first 20 data points come from a random normal distribution with a mean value of zero and a standard deviation of unity. The mean value is then increased to 0.25, 0.5, 0.75, and 1.0 for subsequent sets of 20 data points. Note that S exceeds the threshold value of h after about 68 data points. Because the mean value increases above 0, the cumulative sum T remains above its threshold of –5. CUSUM charts are generally considered to be effective for detecting gradual shifts in the process mean (Ryan 2000). The most commonly used control charts are Shewhart and Shewhart-type charts. Shewhart charts are effective for detecting large, sudden changes in the process mean. Generally Shewhart chart limits are set at values of x ± 3σˆ . In terms of the normalized parameter z, the chart limits are z = ± 3 . Shewhart charts were not investigated as part of this study; however, it is interesting to note that the basic CUSUM and Shewhart charts are equivalent if the CUSUM parameters k and h are selected as k = 3 and h = 0. Errors A typical VAV box control strategy was described in the “System Description” section. However, a wide variety of control strategies are employed by controller manufacturers, most of which use a cascaded control loop to maintain the zone 3
temperature and zone airflow rate at setpoint values. In order to make VPACC independent of the control strategy used in a particular controller/VAV box application, four generic errors were identified: the airflow rate error, the absolute value of the airflow rate error, the temperature error, and the reheat coil differential temperature error. As long as the VAV box controller has an airflow setpoint, as well as heating and cooling temperature setpoints, VPACC will function independently of the control strategy used. Each fault considered in this study (discussed in the subsection “Fault Implementation and Impact”) will result in a deviation of one or more of these errors from its value during normal operation, which can be detected by a CUSUM chart. The airflow rate error, Qerror, is defined as Qerror = Qactual – Qsetpoint
(3)
where Qactual = measured airflow rate, Qsetpoint = airflow rate setpoint. The CUSUMs of this error, SQ and TQ, are effective for detecting damper faults and differential pressure sensor faults associated with airflow measurement. The absolute value of the airflow rate error, |Qerror|, is defined as |Qerror| = |Qactual – Qsetpoint|.
(4)
Only one CUSUM value, S|Q|, is defined for this error since the error is never negative. S|Q| is effective for detecting unstable damper control faults. The temperature error, Terror, is defined as Terror = Tzone – CSP if Tzone > CSP,
(5a)
Terror = 0 if HSP < Tzone < CSP,
(5b)
Terror = Tzone – HSP if Tzone < HSP,
(5c)
where Tzone = zone temperature, CSP = cooling setpoint, HSP = heating setpoint. The CUSUMs of the temperature error, ST and TT, are effective for detecting damper faults, valve faults, and temperature sensor faults. The specific definition of temperature error used in this report is based on the control sequence described above. Various other commonly used control sequences may require changes to the definitions of heating setpoint, cooling setpoint, and temperature error. The reheat coil differential temperature error, ∆Terror, is defined as
where 4
∆Terror = Tdischarge – Tentering if uhc = 0,
(6a)
∆Terror = 0 if uhc ≠ 0,
(6b)
Tdischarge= discharge air temperature (the temperature of the air leaving the reheat coil), Tentering= entering air temperature (the temperature of the air entering the reheat coil), uhc
= control signal to the reheat coil valve, where a value of 0 indicates the valve is closed.
The positive CUSUM of the reheat coil differential temperature error, S∆T, is effective for detecting a leaking reheat coil valve fault. The negative CUSUM, T∆T, is effective for detecting temperature sensor faults. The leaking valve fault highlights the advantages of automated FDD. Without VPACC, the local controller may be capable of masking this fault by increasing the airflow rate into the space. In this scenario there will be no “too hot” or “too cold” complaints, so a significant energy penalty may be accrued. The errors and CUSUMs are only calculated during occupied periods. During unoccupied periods, the errors are not computed and the CUSUMs are reset to zero. The first hour of the occupied period is treated the same as the unoccupied period, to allow steady-state conditions to develop. Parameters For each process error to which CUSUM analysis is to be applied, there is a set of parameters that must be known and/ or specified. These are the process error mean ( x ), the process error standard deviation ( σˆ ), the slack parameter (k), and the alarm limits for the S and T CUSUMs (hS and hT). For the purposes of this study, the mean and standard deviation were determined by analysis of a short period of fault-free operation from a particular data source. CUSUM analysis was performed for each error using a mean and standard deviation common to all the VAV boxes from that data source. These parameters will be referred to as the VPACC statistical parameters throughout the remainder of this paper. The slack parameter k = 3 and alarm limits hS = hT = 900 are the same for all data sources. To exceed the alarm limit value using 1 min data, an error that is five standard deviations from the mean would have to persist for 7.5 h. When a CUSUM does exceed the alarm limit, it is reset to zero and the calculations resume. Thus, the severity of a fault can be established from the number of alarms over a period of time. Point Requirements VPACC uses existing points in the building automation system to perform all calculations. The industrial grade sensors that are already installed for control purposes have sufficient accuracy so laboratory grade instruments are not required. Most of the points required by VPACC are already available in the local VAV box controller: zone temperature, cooling setpoint, heating setpoint, airflow rate setpoint, actual airflow rate, discharge air temperature, and occupancy status. Entering air temperature is typically not available, so supply KC-03-8-1
air temperature (available over the control network from the air-handling unit controller) could be used. Special Cases No Discharge Air Temperature Sensor. Many VAV boxes are equipped with a discharge air temperature sensor, which VPACC needs to calculate the reheat coil differential temperature error. If a discharge air temperature sensor is not available, a simplified version of VPACC could be used, implementing the airflow rate error, the absolute value of the airflow rate error, and the temperature error only. In this case, a leaking reheat coil valve (or, in the case of electric reheat, staged reheat enabled “on” in the cooling mode) would not be detected unless it was so extreme that the VAV box was unable to maintain the zone temperature at the setpoint, thereby causing alarms due to excessive values of ST. Pressure Dependent. In some VAV boxes, the damper is controlled directly in response to zone temperature without an intermediate determination of an airflow setpoint. Qerror and |Qerror| do not exist for a pressure-dependent VAV box. In this case, a stuck damper may go undetected. In the case where the zone is overcooled, the reheat coil valve will open (or staged reheat will be enabled “on” if electric reheat is employed) and compensate for the fault, masking its existence. In the case where the zone is undercooled, the rising zone temperature may create alarms due to excessive values of ST. No Reheat. Some VAV boxes do not have reheat capabilities. Others do not have reheat available part of the year because a two-pipe hydronic system is being used for chilled water at that time. Since the VAV box cannot take any control action to increase zone temperature, a negative temperature error does not necessarily indicate a fault. In this situation, only the ST CUSUM will be calculated for Terror. Dual Duct. In a dual-duct VAV box, there is no reheat coil (and no electric reheat). Instead there are two air inlets, namely, a cold deck and a hot deck. Each air inlet has a damper and differential pressure sensor. For this arrangement, two airflow errors (Qerror,hot and Qerror,cold) and two absolute value airflow errors (|Qerror, hot| and |Qerror, cold|) will be calculated. No ∆Terror will be calculated as there is no reheat capability. TESTING Data Sources Several data sets have been used to test VPACC. Initial testing was performed using the Virtual Cybernetic Building Testbed (VCBT), an emulator that combines simulations of a building and its HVAC systems with actual commercial controllers. Emulation provides a test environment that is closer to a real building than simulation because it uses real building controllers. Like pure computer simulation, it also provides carefully controlled and reproducible conditions. Because emulation is done in real time it takes much longer than pure computer simulation, making it more difficult to test KC-03-8-1
a broad range of faults and conditions. Bushby et al. (2001) provides details of the VCBT design and operation. The VCBT was used to test and refine VPACC. The emulation consisted of a model of a commercial office building with a VAV AHU and three VAV boxes for each of three floors. On two of the floors, commercially available AHU and VAV box controllers were used, one of which implemented a pressure-dependent control strategy and the other a pressureindependent control strategy similar to the one in “System Description.” On the other floor, the control system was included in the computer model. Only the results for the pressure-independent VAV boxes will be presented. The maximum airflow rates of the VAV boxes range from 0.28 m3/s (590 CFM) to 1.20 m3/s (2550 CFM). Laboratory testing was performed at a test facility in the Midwest. The facility has two test VAV air-handling systems, each serving four test zones. The HVAC equipment and controllers are typical of those found in commercial buildings. The VAV boxes are single-duct throttling units having both hydronic and electric reheat capabilities. They were operated with hydronic reheat to produce the data sets in this study. The maximum airflow rates of the boxes range from 0.19 m3/s (400 CFM) to 0.47 m3/s (1000 CFM). The VAV boxes are well instrumented; many more points are monitored than would commonly be available in a commercial building. Details of the facility are provided by Price and Smith (2000). Two types of data sets were obtained at the test facility. The data sets are referred to as LAB-1 and LAB-2. The manufacturers of the controllers are different for the two data sets, although both manufacture control systems for commercial buildings. VPACC was embedded in the controllers for the LAB-2 data sets, but not for the LAB-1 data sets. The control sequences employed in the controllers for the two data sets are essentially the same as that depicted in Figure 2. Subtle differences exist; however, they do not impact the performance of VPACC. Data sets were also collected at a field site to examine the robustness of VPACC. Nine VAV boxes were monitored for a 20-week period from April 22, 2002, through September 8, 2002. The VAV boxes are single-duct throttling units with hydronic reheat and are on two separate AHUs (five are served by one AHU and four by a second AHU). The maximum airflow rates of the boxes range from 0.28 m3/s (600 CFM) to 1.43 m3/s (3040 CFM). The building has a two-pipe system, meaning that chilled water for cooling and hot water for reheat are not available at the same time. During the period of data collection, reheat was not available. The control sequence is similar to that shown in Figure 2, although the cooling and heating setpoints are the same and a ±0.56°C (1°F) deadband around the setpoint is used to control switching between the two modes of operation. The other main difference from Figure 2 is that the minimum airflow rates for heating and cooling are not necessarily the same for each VAV box. However, the airflow rate is fixed in the heating mode. 5
TABLE 1 Data Sources for Fault Data Sets Data Source Fault Damper
Stuck Open Stuck at Minimum
VCBT
LAB-1
H, S 1 C
Stuck Partially Open Reheat Coil Valve
Stuck Open Stuck Closed Stuck Partially Open
LAB-2
C C, S H C, H
C
Failed Flow Sensor
C, H
C
Unstable Flow
C, H
C
1
H denotes heating season; S denotes swing season; C denotes cooling season. A blank cell indicates data do not exist for that fault/data source combination.
Fault Implementation and Impact To test VPACC, data sets for normal operation and several types of faults were produced. Descriptions of the fault implementations and impacts are provided below. Table 1 shows the data sources for each of the faults. The fault descriptions correspond to the data source for each particular fault (e.g., the description of the stuck open damper corresponds to its implementation in the VCBT). Table 1 also shows the season (heating, cooling, or swing) corresponding to the weather conditions used in the emulation testing or, in the case of the laboratory testing, the weather conditions that determined the external loads on the test facility. Damper Stuck Open. This fault is introduced by overriding the VAV box damper actuator position to the full open position. The zone airflow will go to the maximum, whereas the control signal to the damper will tend to saturate at the fully closed position. The response of the zone temperature will depend on the loads. For low zone cooling loads, the zone temperature will drop below the heating setpoint, causing the hydronic reheat valve to open in an attempt to maintain zone temperature at the setpoint. Damper Stuck at Minimum Position. This fault is introduced by overriding the VAV box damper actuator to the minimum position. The zone airflow will go to the minimum value, and the zone temperature will tend to increase for cooling conditions. The impact of the fault will not be seen when the VAV box operates in the heating mode because the reheat coil valve will still modulate to heat the air supplied to the zone, thereby controlling the zone temperature. Damper Stuck Partially Open. This fault is introduced by overriding the VAV box damper actuator to a fixed position that produces a flow rate between the minimum and maximum specified for that box. In this case, two different severities of the fault were implemented, producing fixed flow rates approximately equal to 40% and 60% of maximum flow. If the zone airflow is lower than necessary, the zone temperature will drift above the cooling setpoint. If the zone airflow is higher 6
than necessary, the controller will transition to the heating mode and the reheat coil valve will modulate to maintain the zone temperature at the setpoint. Hydronic Reheat Coil Valve Stuck Open. This fault is introduced by overriding the VAV box hydronic reheat coil valve actuator position to full open. The zone temperature is expected to rise above the cooling setpoint, causing the damper actuator to open, and airflow to increase, in an attempt to maintain zone temperature at the setpoint. Hydronic Reheat Coil Valve Stuck Closed. This fault is introduced by overriding the VAV box hydronic reheat coil valve actuator position to zero. If there is a heating load, the fault is expected to cause the zone temperature to decrease. Under cooling conditions, this fault has no impact on system operation. Hydronic Reheat Coil Valve Stuck Partially Open. This fault is introduced by overriding the VAV box hydronic reheat coil valve actuator position to allow a flow rate equivalent to approximately 2% to 10% of the maximum flow through the coil. Depending on the zone conditions and the severity of the fault, the stuck reheat valve either creates an additional cooling load that the AHU must try to remove, or it prevents the valve from modulating to provide additional heating energy to the zone. In the first case, the controller increases the airflow rate to the zone in an attempt to compensate for the fault. If the fault is severe, the zone temperature will gradually increase beyond the zone cooling setpoint. In the second case, the zone temperature will tend to gradually decrease below the zone heating setpoint. Failed Differential Pressure Sensor. This fault is introduced by disconnecting both tubing leads to the differential pressure sensor. The fault causes the VAV box damper to go to the full open position because the flow sensor indicates an airflow rate of zero and the control loop will attempt to correct for this condition. Unstable Control Loop. The fault is implemented by changing the integral coefficient of the controller used for KC-03-8-1
TABLE 2 VPACC Statistical Parameters for all Data Sources Data Source VCBT
LAB-1
LAB-2
Error
Mean
Standard Deviation
Qerror
0 m /s (0 CFM)
1.89 × 10⁻² m3/s (40 CFM)
Terror
0.11°C (0.2°F)
0.11°C (0.2°F)
∆Terror
0.0°C (0.0°F)
1.11°C (2.0°F)
3
Qerror
0 m /s (0 CFM)
2.36 × 10⁻³ m3/s (5 CFM)
Terror
0.056°C (0.1°F)
0.056°C (0.1°F)
∆Terror
0.44°C (0.8°F)
0.39°C (0.7°F)
3
3.30 × 10
–3
Qerror Terror ∆Terror
Field
Qerror
1.32 × 10⁻² m3/s (28 CFM)
3
m /s (7 CFM)
0.59°C (1.07°F)
0.36°C (0.65°F)
1.11°C (2.0°F)
0.34°C (0.62°F)
–0.62%
3.22%
1
Terror 0.22°C (0.39°F) 1 The airflow and airflow setpoint range from 0% to 100% where 0% indicates no flow and 100% indicates maximum allowable flow.
0.12°C (0.21°F)
TABLE 3 VPACC Results for the Emulation Data Sets Number of Alarms Number of Days
SQ
TQ
ST
TT
S∆T
T∆T
Normal
23
0
0
0
0
0
0
Damper stuck open
4
12
0
0
0
0
0
Damper stuck closed
2
0
3
0
0
0
0
Reheat coil valve stuck open
2
0
0
23
0
6
0
Reheat coil valve stuck closed
1
0
0
0
4
0
0
Operation
airflow control in the case of the LAB-1 tests and by changing an output filter that limits the rate of increase and decrease of the airflow control output in the case of the LAB-2 tests. The fault causes the VAV box damper to oscillate, thereby producing airflow rates that oscillate about the setpoint airflow rate. RESULTS Emulation Normal operation data were collected from three VAV box controllers once per minute during an eight-day emulation with July (cooling season) weather data, an eight-day emulation with February (heating season) weather data, and a sevenday emulation with October (swing season) weather data. The airflow rate error, temperature error, and reheat coil differential temperature error were calculated at each 1 min sampling point and the VPACC statistical parameters in Table 2 were calculated for these errors. Since unstable airflow faults are not represented in the set of faults implemented in the VCBT, the absolute value of the airflow rate error was not calculated. The entering air temperature used in the calculation of the reheat coil differential temperature error was the supply air KC-03-8-1
temperature setpoint of the air-handling unit supplying the VAV boxes, obtained from the control network. Although normal operation data from all three VAV boxes were used to generate the statistical parameters in Table 2, faults were introduced in only one of the VAV boxes. VPACC results obtained by processing the emulation data sets from that VAV box controller are presented in Table 3 and include normal operation and the four faults identified in Table 1. The normal operation data, consisting of 23 days of data from the three seasonal conditions considered, produced zero false alarms. The remaining nine days of testing involved the various faults that were implemented. At least one alarm was produced each day. As shown in Table 3, a stuck open damper produces a large number of alarms of SQ. TQ is the primary signature for the damper stuck closed fault. S∆T is the most reliable mechanism for detecting a stuck open reheat coil valve. The stuck closed reheat coil valve can be detected by TT. Process variables for a stuck open VAV box damper fault implemented during October weather conditions are shown in Figure 4a. Data are shown from one hour after the beginning of the occupied period (to allow steady-state conditions to develop) until the end of the occupied period. The damper is stuck at the full open position, so the measured airflow rate 7
Figure 4a Emulation data showing the effect of a stuck open damper fault implemented in the swing season.
Figure 4b VPACC output corresponding to the conditions in Figure 4a.
(indicated as a dot-dashed line at 0.28 m3/s or 590 CFM) is substantially greater than the airflow rate setpoint (indicated as a dashed line at 0.08 m3/s or 170 CFM), which is a function of zone temperature as described in “System Description.” As a result of the discrepancy between the airflow rate and the airflow rate setpoint, the damper control signal (indicated as a solid line) decreases and saturates at 0% (fully closed) as it attempts to decrease the airflow rate to the zone. The airflow rate into the zone is far greater than that needed to meet the cooling load, so the zone is overcooled. In response, the VAV box controller commands the reheat coil valve (indicated as a dotted line at 6%) open. VPACC output is shown in Figure 4b. The difference between the airflow rate and the airflow rate setpoint creates a large enough airflow rate error (relatively constant throughout most of the day at 0.20 m3/s or 420 CFM) to cause SQ to exceed the alarm limit (hS = 900) three times.
the morning and are caused by low temperatures in the test zones during winter testing. The remaining 22 days of testing involved faults that were implemented or occurred naturally. At least one alarm was produced each day. Process variables for a reheat coil valve fault with the valve stuck partially open are shown in Figure 5a for winter (heating season) weather conditions. During the first three hours of the test, the zone temperature is well below the heating setpoint (indicated as a solid line at 21.1°C or 70.0°F) and the reheat coil valve control signal is commanded to 0%, indicating the valve should be fully open. The zone temperature gradually increases and eventually exceeds the cooling setpoint (indicated as a solid line at 22.2°C or 72.0°F). This causes the reheat coil valve control signal to increase gradually and eventually saturate at 100%, indicating the valve should be closed. The figure also shows the entering and discharge air temperatures to the VAV box. VPACC output is shown in Figure 5b. The low zone temperature in the morning causes TT to alarm seven times, while the warmer zone temperature in the afternoon causes ST to alarm once. On this day, TT accumulates errors considerably faster than ST because the temperature errors in the morning are more extreme than those in the afternoon. Once the control signal to the reheat coil valve saturates at the closed position, the entering and discharge air temperature are expected to be nearly the same. The fault produces a temperature difference of approximately 6°C (10.8°F) and this causes S∆T to alarm six times. This example shows how the zone load conditions influence the output of VPACC. The results in Table 4 reveal that a failed differential pressure sensor produces a large number of alarms of TQ and S|Q|. S|Q| is also the primary signature for the unstable airflow fault. SQ and TQ are not effective for this fault because the positive and negative errors cancel one another. LAB-2. One of the goals of the testing that produced the LAB-2 data sets was to examine the performance of VPACC when it is embedded in the VAV box controllers. The supply
Laboratory LAB-1. Normal operation data were collected from four VAV box controllers once per minute during occupied periods during the cooling season. The airflow rate error, temperature error, and reheat coil differential temperature error were calculated at each 1 min sampling point and used to compute the VPACC statistical parameters in Table 2. The entering air temperature used in the calculation of the reheat coil differential temperature error was located just upstream of the VAV box. VPACC results obtained by processing the LAB-1 data sets from eight VAV box controllers are presented in Table 4. In addition to normal operation and the three faults identified in Table 1, the results include a leaking reheat coil valve fault that was identified while processing the data sets. Thirty-five days of normal operation data were processed, producing 11 alarms due to TT exceeding the threshold of 900. These are not false alarms. Inspection of the data reveals that the alarms are occurring during the first hours of occupancy in 8
KC-03-8-1
TABLE 4 VPACC Results for the LAB-1 Data Sets Number of Alarms
Number of Days
SQ
TQ
ST
TT
S∆T
T∆T
S|Q|
Normal 1
35
0
0
0
11
0
0
0
Reheat Coil Valve Stuck Partially Open
8
0
0
2
46
13
0
0
Failed Differential Pressure Sensor
4
0
151
0
0
0
0
151
Unstable Airflow
5
0
0
0
2
0
0
57
Leaking Reheat Coil Valve 2
5
0
0
0
0
26
0
0
Operation
1
Alarms occur in the first hours of occupation on six days. The cause is likely short-circuiting of warm supply air to the return grille. 2 Leaking reheat coil valve was not introduced intentionally.
TABLE 5 VPACC Results for the LAB-2 Data Sets Number of Alarms
Number of Days
SQ
TQ
ST
TT
S∆T
T∆T
S|Q|
Normal
27
0
0
0
0
0
0
0
Reheat Coil Valve Stuck Partially Open
4
0
0
0
0
17
0
0
Failed Differential Pressure Sensor
3
0
9
0
0
0
0
9
Unstable Airflow
4
0
0
0
0
0
0
6
Damper Stuck Open
2
4
7
0
0
0
0
11
Operation
Figure 5a LAB-1 data showing the effect of a reheat coil valve stuck partially open during the heating season.
Figure 5b VPACC output corresponding to the conditions in Figure 5a.
air temperature from the AHU controller was obtained by each of the VAV box controllers over the control network and used as the entering air temperature in the reheat coil differential temperature error. To establish the VPACC statistical parameters, three days of normal operation data were collected at 1 min sampling intervals from four VAV box controllers during the cooling season. The data were processed off-line and yielded the parameters in Table 2. During testing of various fault conditions, on-line inspection of the output from VPACC
showed the output to be consistent with what was expected. That is, the dominant CUSUM value (or values) for each data set was appropriate for the implemented fault.
KC-03-8-1
Results obtained for this data set are shown in Table 5. Twenty-seven days of normal operation data were processed with VPACC with no alarms. The reheat coil valve stuck partially open fault was implemented for four days with different severities. Significant differences between the entering and discharge air temperatures produced 17 alarms of S∆T. The 9
TABLE 6 VPACC Results for the Field Data Sets Number of Alarms
Figure 6a LAB-2 data showing the effect of an unstable airflow fault. 1
VAV Box
SQ
TQ
ST
TT
S|Q|
Total 1
100E
0
29
36
0
29
65
100W
0
125
62
0
125
187
101N
0
38
42
0
38
80
101W
0
104
52
0
105
157
107
0
70
1406
0
72
1478
109
0
1
0
0
1
1
111
0
0
1
0
0
1
113
0
10
3
0
10
13
114
0
674
3
0
674
677
Total = ST + TT + S|Q| because SQ and TQ are subsets of S|Q|.
Field
Figure 6b VPACC corresponding to the conditions in Figure 6a.
failed differential pressure sensor produced large negative airflow errors, leading to nine alarms of TQ and S|Q|. Similarly, the stuck open damper fault produced large airflow errors, the signs of which were determined by the loads on the zone. The unstable airflow fault was implemented for four days with different severities and produced six alarms of S|Q|. There was one day of testing that did not produce any alarms because the fault was not severe enough. Figure 6a shows the airflow error for one day of testing when the fault was more severe. On this particular day, the standard deviation of Qerror was 0.11 m3/s (233 CFM), which is more than eight times the standard deviation of the data for normal operation. VPACC output is shown in Figure 6b. The fault is apparent from S|Q|, but not from SQ or TQ. 10
To determine the VPACC statistical parameters for the field data, four weeks of data (one week from each of four VAV boxes, identified as boxes 109, 111, 113, and 114) were collected and processed at 1 min sampling intervals. Data from the other five VAV boxes were not used to determine the parameters because the entering air temperature that was monitored for those boxes was incorrect. Hence, the reheat coil differential temperature error for these VAV boxes was meaningless. However, since a two-pipe system is employed on the campus where these data were collected, hydronic reheat was not available during the cooling season. In the absence of hydronic reheat, there is no real need to monitor the temperature difference across the reheat coil and identifying statistical parameters under these conditions could be misleading. Thus, data from all nine of the VAV boxes could have been used to determine the statistical parameters and the reheat coil differential temperature error simply ignored. On the other hand, using only four of the nine VAV boxes to determine the statistical parameters provides a better test of the robustness of the diagnostic tool. Statistical parameters for the field data are listed in Table 2. In this case the airflow error statistical parameters are reported as a percentage of the maximum airflow rate rather than as fixed volumetric airflow values. Thus, the magnitude of the airflow error necessary to cause SQ, TQ, and S|Q| to move away from zero will depend on the capacity of the VAV box. As was the case for the laboratory data sets, the statistical parameters for the airflow rate error were also used for S|Q|. Because there was no hydronic reheat available, the reheat coil differential temperature error was not computed and statistical parameters for this error are not reported. Results from 20 weeks of field testing for each of the nine VAV boxes are summarized in Table 6. The number reported in a cell represents the total number of alarms over the 20week period of a particular CUSUM and a particular VAV box. KC-03-8-1
Figure 7a Field data for VAV box 101W during the week of July 8, 2002.
Figure 7b VPACC output corresponding to the conditions in Figure 7a.
The total number of alarms for each box are also reported in the last column of Table 6. Note that the total excludes SQ and TQ because they are in essence a subset of S|Q|. That is, an alarm of SQ or TQ will always produce an alarm of S|Q|, although S|Q| may alarm first if, for instance, the airflow errors are predominantly positive but include some large negative errors as well. Because reheat was not available, VPACC did not monitor the zone temperature error in the heating mode. The VPACC results in Table 6 indicate that VAV boxes 107 and 114 are performing poorly and VAV boxes 109, 111, and 113 are performing well. The other VAV boxes are performing somewhere between these two extremes. Closer inspection of the trended data for VAV box 107 reveals that the zone temperature routinely exceeds the cooling setpoint of 22.2°C (72°F) by 2.2°C (4°F) to 3.3°C (6°F). This produces 70 alarms of ST per week on average and nine weeks with 100 to 115 alarms of ST. It is common for the discharge air temperature to this zone to be 15.6°C (60°F) to 21.1°C (70°F), indicating that the capacity problems are due at least in part to the manner in which the AHU is being controlled and/or to the design of the system. Another VAV box (101N) on the same AHU routinely operates in the heating mode 1.1°C (2°F) to 1.7°C (3°F) below the heating setpoint of 22.2°C (72°F). The lack of reheat makes it impossible for the AHU to satisfy the two zones when one requires cooling and the other heating. Operational changes to reduce the minimum airflow rates for the heating mode may help alleviate the problem of overcooling certain zones. The VPACC results in Table 6 indicate that box 114 has severe airflow control problems. The minimum number of alarms of TQ in a week is 7, while the average is close to 34. This indicates that the flow rate to the zone is consistently less than the setpoint airflow rate. This is true whether the VAV box operates in the heating or cooling mode. This seems to indicate that the static pressure is not sufficient to deliver the amount of air needed in the zone. Due to the nature of the flow error, S|Q| alarms at the same times as TQ. VAV boxes 109 and 111 alarm only one time each over the 20 weeks of testing. Thus, further discussion of these boxes is
not merited except to mention that inspection of the process variables supported the findings of VPACC, namely, that the control was quite good. VAV box 113 also performed well, with 11 of the 13 alarms occurring during the week of June 1016, 2002. For much of the first part of that week, the AHU supply air temperature ranged from 18.3°C (65°F) to 21.1°C (70°F), causing the zone temperature to exceed its cooling setpoint of 22.2°C (72°F) by nearly 1.1°C (2°F). Hence, the problem does not appear to be with the control of the VAV box. The controller operated in the heating mode during most of the testing and this contributed to the low number of alarms because only flow control was monitored in the heating mode. The performance of the remaining four VAV boxes (100E, 100W, 101N, and 101W) is a little more difficult to assess. A significant number of the alarms for each occur during five weeks of the testing, namely, May 20-26, 2002; May 27 to June 2, 2002; June 10-16, 2002; July 8-14, 2002; and July 2228, 2002. Specifically, 55 of 65 alarms for 100E, 111 of 187 alarms for 100W, 75 of 80 alarms for 101N, and 101 of 156 alarms for 101W occur during those five weeks. The problem in the weeks of May 20-26, 2002, and May 27 to June 2, 2002, is associated with the AHU temperature control. All four boxes (as well as 107, which is served by the same AHU) have a significant number of ST alarms during these two weeks. Closer inspection of the trended data indicates the discharge air temperatures to the zones exceeded 23.9°C (75°F) for nearly 20 hours over the latter part of the first week and the beginning of the second week. Since this time period encompasses a holiday weekend, it is likely that there was a scheduling inconsistency that had the AHU and VAV boxes operating in an occupied mode while the chiller was not running. The problem in the other three weeks is a sudden drop in the airflow through the four boxes. Figure 7a shows the temperature error (Terror) and airflow error (Qerror) for box 101W during a portion of the week of July 8-14, 2002. The sudden drop in the airflow rate produced large negative airflow errors and positive temperature errors. As shown in Figure 7b, this results in numerous airflow alarms (TQ) and one temper-
KC-03-8-1
11
ature alarm (ST). This particular problem occurs at six distinct times in the three weeks. The problem occurs at the same time in each of the boxes and also occurs in box 107. The fact that the alarms occur at the same time in each of the boxes points to the AHU as the likely source of the problem. Considering the remaining 16 weeks of data, the results from VPACC indicate that boxes 100E and 101N are performing fairly well (averaging about one alarm per week), while boxes 100W and 101W are not doing as well. In general boxes 100W and 101W lack capacity in the cooling mode, as indicated by actual airflow rates that are considerably less than the setpoint values. In the case of box 100W, the resultant temperature errors can be significant, sometimes exceeding 1.1ºC (2ºF). Despite the capacity problems, temperature control in zone 101W is not a significant problem. CONCLUSIONS AND RECOMMENDATIONS The objective of this paper was to describe the VAV box fault detection tool VPACC and to present results of testing with emulation, laboratory, and field data sets. The results are encouraging. VPACC successfully detected each of the faults introduced in the emulation and laboratory testing and also detected two faults that were not intentionally implemented. In addition, no false alarms were identified in the emulation and laboratory testing. In all cases, alarms were readily traced to real conditions. The assessment of VPACC with field data was not as straightforward. One difficulty is that the “actual” operational status of the equipment is essentially unknown. A second difficulty is that individuals can disagree whether or not an existing condition represents a fault. Nonetheless, the VPACC alarms for the field data do seem to point to several design and operational issues. Consistent results across these diverse testing environments coupled with the simplicity of the approach bolster the belief that VPACC could be developed into a commercial tool; however, additional work is needed in three main areas. First, it is impractical to expect trend data to be evaluated to determine statistical parameters for each proposed application of VPACC, as was done in this study. Ideally, a set of robust statistical parameters that are effective for a wide range of VAV boxes would be available. Additional field data from other buildings with a variety of VAV box types must be collected in order to determine these robust statistical parameters. Also, the current embedded versions of VPACC are written using generic mathematical functions available in the languages in which the controllers are programmed. Although this approach is suitable for a technology demonstration, a built-in VPACC function would greatly simplify the task of embedding VPACC in the control program for a VAV box. Finally, more work is needed to develop alternative ways to interpret VPACC results and deliver this information to the building operator. The most direct approach is to generate an alarm that the operator must acknowledge whenever a cumulative sum exceeds the alarm limit. Refinements to the basic scheme are possible. For example, rather than automatically sending the alarm to the operator, the building control system could highlight, on demand, those devices having experienced 12
the greatest number of alarms in a given period of time. Or, if an automated maintenance management system is used, an alarm could automatically generate an appropriate work order. However, as the field data show, many faults are the result of design or commissioning issues that are beyond the scope of the building maintenance staff. Furthermore, a fault in another piece of equipment, such as an air-handling unit, boiler, or chiller, could result in this approach generating a large number of alarms, perhaps overwhelming the operator. A mechanism is needed to resolve multiple conflicting fault reports before reporting them to the operator. ACKNOWLEDGMENTS This work was supported in part by the California Energy Commission Public Interest Energy Research (PIER) Program. The authors would like to thank Steven Bushby, Natascha Castro, Michael Galler, and Cheol Park of the National Institute of Standards and Technology for their assistance with the emulation aspect of this work. The authors would also like to thank Curtis Klaassen, David Perry, Xiaohui Zhou, and Emir Kadic of the Iowa Energy Center and Mike Macklin of the Des Moines Area Community College for their assistance with the laboratory and field testing aspects of this work. REFERENCES Bushby, S.T., N. Castro, M.A. Galler, C. Park, and J.M. House. 2001. Using the virtual cybernetic building testbed and FDD test shell for FDD tool development. NISTIR 6818. Washington, D.C.: U.S. Department of Commerce. Dodier, R.H., P.S. Curtiss, and J.F. Kreider. 1998. Smallscale on-line diagnostics for an HVAC system. ASHRAE Transactions 104(1a): 530-539. IEA. 1996. IEA Annex 25, Building optimization and fault diagnosis source book. Eds. J. Hyvärinen and S. Kärki. Espoo, Finland: Technical Research Centre of Finland. IEA. 2001. IEA Annex 34, Demonstrating automated fault detection and diagnosis methods in real buildings. Ed. L. Ukskoski. Espoo, Finland: Technical Research Centre of Finland. Price, B.A., and T.F. Smith. 2000. Description of the Iowa Energy Center Energy Resource Station: Facility Update III. Technical Report: ME-TFS-00-001. Department of Mechanical Engineering, The University of Iowa, Iowa City. Ryan, T.P. 2000. Statistical methods for quality improvement, 2nd edition. New York: Wiley and Sons. Seem, J.E., J.M. House, and R.H. Monroe. 1997. On-line monitoring and fault detection of control system performance. Proceedings of CLIMA 2000. Brussels. KC-03-8-1