Sep 24, 2006 - A short review of the Van der Pol, Wilson-Cowan and Terman-Wang relaxation oscillators .... The Wilson-Cowan oscillator model was used by a.
Int. J. Appl. Math. Comput. Sci., 2006, Vol. 16, No. 4, 513–523
APPLICATION OF COUPLED NEURAL OSCILLATORS FOR IMAGE TEXTURE SEGMENTATION AND MODELING OF BIOLOGICAL RHYTHMS PAWEŁ STRUMIŁŁO, M ICHAŁ STRZELECKI Institute of Electronics, Technical University of Łód´z ul. Wólcza´nska 211/215, 90–924 Łód´z, Poland e-mail: {pstrumil, mstrzel}@p.lodz.pl
The role of relaxation oscillator models in application fields such as modeling dynamic systems and image analysis is discussed. A short review of the Van der Pol, Wilson-Cowan and Terman-Wang relaxation oscillators is given. The key property of such nonlinear oscillators, i.e., the oscillator phase shift (called the Phase Response Curve) as a result of external pulse stimuli is indicated as a fundamental mechanism to achieve and sustain synchrony in networks of coupled oscillators. It is noted that networks of such oscillators resemble a variety of naturally occurring phenomena (e.g., in electrophysiology) and dynamics arising in engineering systems. Two types of oscillator networks exhibiting synchronous behaviors are discussed. The network of oscillators connected in series for modeling a cardiac conduction system is used to explain causes of important cardiac abnormal rhythms. Finally, it is shown that a 2D network of coupled oscillators is an effective tool for segmenting image textures in biomedical images. Keywords: biological rhythms, nonlinear oscillations, networks of synchronised oscillators, texture segmentation, cardiac pacemakers
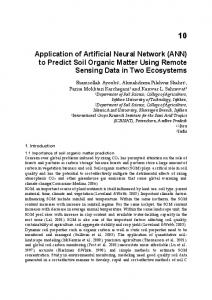
1. Introduction In the recent two decades, increased research interest in computational systems that mimic nature for solving complex modeling and data processing tasks has been observed. Paradigms such as supervised and unsupervised artificial neural networks (Tadeusiewicz, 1993), evolutionary computations (Michalewicz, 1996) or neuro-fuzzy systems (Rutkowski, 2004) are notable examples. Due to their capabilities of solving complex multi-dimensional data processing tasks, these paradigms have won a significant role in applications such as data classification (Jain, 2000), signal processing (Hu and Hwang, 2001), diagnosis support systems (Korbicz et al., 2004), prediction and control (Narenda and Parthasarathy, 1990). There is also a less exposed line of research in the computational intelligence field that mimics a specific aspect of biological systems, i.e., their rhythmic nature, and exploits this feature for solving a wide class of problems encountered in biomedical and technical sciences. Rhythmic behavior is common for most living organisms (Glass and Mackey, 1990). It occurs in human electrocardiographic (ECG) and electroencephalographic (EEG) signals, gait patterns, breathing cycles and circadian rhythms. Figure 1 illustrates samples of ECG and EEG signals which reveal various modes of cyclic patterns. An interesting aspect of these phenomena is that these patterns reflect complex interactions between popu-
(a)
(b) Fig. 1. Examples of biological rhythms observed in human ECG (a) and EEG signals (b).
lations of excitatory cells themselves and interactions with the environment. As a result, rich dynamic behavior of such cell populations can occur that range from a quies-
514 cent state to a synchronised oscillating action or irregular spatiotemporal chaotic dynamics. Coherent oscillations were discovered in an olfactory system by Freeman (1978) and a decade later in visual cortex neural cells (Eckhorn et al., 1988). Synchronised neuronal oscillations within a frequency range of 35–85 Hz were reported. These observations are in accord with the theory of temporal correlation proposed by Von der Malsburg and Schneider (1986). This theory states that synchronised oscillations of neuron groups arise once attention is focused on a coherent stimulus. For more than one perceived stimulus, these synchronised patterns switch in time between different neuron groups thus forming temporal maps coding several features of the analysed scene. Figure 2 illustrates the concept of the temporal correlation theory.
P. Strumiłło and M. Strzelecki In this paper, we intend to define principal types of nonlinear oscillators and explain their fundamental property of phase locking, which is the basic mechanism underlying emergent global dynamics in populations of excitatory cells. We also show how models of coupled oscillating neurons can serve different modeling and computational tasks in biomedical research. Firstly, models of coupled neural oscillators are used for explaining heartbeat dynamics. Secondly, the application of a 2D-network of coupled oscillators to an image texture segmentation task is shown and example results are given.
2. Nonlinear Oscillators Consider the following dynamic system of two coupled differential equations: ⎧ dx ⎪ ⎪ = f1 (x, y) , ⎨ dt (1) ⎪ dy ⎪ ⎩ = f2 (x, y) , dt where x, y ∈ R are system states and f 1 , f2 are transfer functions that define this two-state system dynamics. Note that the harmonic oscillator given by
Fig. 2. Illustration of the concept of temporal correlation theory.
Apart from time coherence, also spatial ordering of oscillations plays an important role in the overall dynamics of biological rhythms. The so-called spatial oscillations are associated with propagating waves either in onedimensional structures, e.g., electrical excitation of the heart conduction network or two- and three-dimensional excitable tissues, e.g., heart or brain tissues (Strumiłło and Durrani, 1996). In fact, spatial disorder in these propagating waves has been found to be the cause of critical health breakdowns, such as a heart attack or an epileptic attack, that were termed dynamical diseases by Glass and Mackey (1990). Figure 3 illustrates a characteristic pattern of multiple spiral waves of the type believed to persist in the cardiac tissue during the critical state of fibrillation.
Fig. 3. Multiple spiral wave fronts coexisting in the state analogous to cardiac fibrillation (Strumiłło, 1993).
d2 x +x=0 dt2
(2)
can be defined in terms of (1) with f 1 = y, f2 = −x after introducing the new variable y=
dx . dt
Thus, the harmonic oscillator is a linear oscillator. It leads to a circular limit cycle (center singularity) in the (x, y) phase plane. Linear oscillators having different free running frequencies cannot mutually synchronise (Terman and Wang, 1995). This fundamental shortcoming makes them useless in modeling phenomena exhibiting synchronous oscillations existing in many biological or technical systems. Historically, the first important model of a nonlinear oscillator was proposed by Van der Pol and Van der Mark (1928) while studying electronic triode circuits. In temrs of the first-order difference equations (1), their oscillator can be defined by the set of equations � � ⎧ x3 dx ⎪ ⎪ =μ y+x− , ⎨ dt 3 (3) ⎪ x dy ⎪ ⎩ =− , dt μ where μ > 0. Plots of the x and y nullclines for (3), i.e., the points of the (x, y) phase plane satisfying dx/dt = 0 and dy/dt = 0 are shown in Fig. 4(a). The x-nullcline is
Application of coupled neural oscillators for image texture segmentation and modeling of biological rhythms � the cubic function y = −x 1 + x2 /3 and the y-nullcline given by x = 0 is simply the y-axis. The intersection of these nullclines is at the origin of the (x, y) phase plane, giving rise to an unstable equilibrium point. The limit cycle of this oscillator shown in arrows reveals the so-called two-time scales (in contrast to linear oscillators). At the a and c branches there is a slow advancement of oscillator dynamics (relaxation), whereas for the b and d branches there is an abrupt jump in the oscillator’s operation point. These timings are clearly visible in Fig. 4(b) in the time plot of the oscillator activity for the state variable x.
x and an inhibitory node y, is given by ⎧ dx ⎪ ⎪ = −x + Sx (wxx x + wxy y + I) , ⎨ τx dt (4) ⎪ dy ⎪ ⎩ τy = −y + Sy (wyy y + wyx x) , dt where τx < τy are decay time constants of excitatory and inhibitory neurons, respectively, w xx , wyx > 0 and wyy , wxy < 0 are local excitatory and inhibitory connection weights, respectively, I denotes nonlocal interactions from other cells in the network or external global inputs to the network (for I = 0 the oscillator is said to be in the “free-running” mode), and S is a sigmoidal nonlinear function characterized by the respective threshold θ and the gain factor β: S (x) =
(a)
515
1 . 1 + exp [− (x − θ) /β]
(5)
A scheme of the Wilson-Cowan oscillator is shown in Fig. 5. Its nullclines, as defined for the Van der Pol oscillator, admit sigmoidal shapes and, for a proper choice of parameters, they intersect at a single unstable singular point giving rise to a stable limit cycle. An example of firing patterns of the excitatory and inhibitory nodes of this oscillator is displayed in Fig. 6.
(b) Fig. 4. Nullclines of the Van der Pol oscillator and its limit cycle (a) and the x-variable plotted in time (b).
The property of slow and fast advancements of oscillator dynamics resembles closely a variety of periodic phenomena arising in biological systems and engineering. Another key property of nonlinear oscillator networks, which is not displayed by linear oscillators, is that locally coupled nonlinear oscillators can rapidly synchronise (Somers and Kopell, 1993). This fundamental observation has led to widespread applications of this type of networks to various modeling and computational tasks.
3. Wilson-Cowan and Terman-Wang Oscillators Wilson and Cowan (1972) studied the properties of a nervous tissue modeled by populations of oscillating cells composed of two types of interacting neurons: excitatory and inhibitory ones. A simplified model of such an oscillating cell, comprising an interconnected excitatory node
Fig. 5. Two-node Wilson-Cowan oscillator model.
The Wilson-Cowan oscillator model was used by a number of researches (Konig and Schillen, 1991; Strumiłło and Durrani, 1991; Wang, 1995) to demonstrate synchronous activity in locally coupled networks of such oscillators. Applications range from excitatory tissue modeling (cardiac and nerve tissues) to associative memory models. Another important nonlinear oscillator model was proposed by Terman and Wang (1995): ⎧ dx 3 ⎪ ⎪ ⎨ dt = 3x − x + 2 − y + I,
�
(6) � x dy ⎪ ⎪ ⎩ = ε γ 1 + tanh −y , dt β
P. Strumiłło and M. Strzelecki
516
4. Phase Analysis of a Series of Coupled Nonlinear Oscillators Here we concentrate on a key property of the discussed oscillator models, i.e., their capability of achieving synchronous actions in populations of interconnected oscillators. This capability is demonstrated for a chain of pulse coupled relaxation oscillators. Consider a chain of N coupled oscillators locally connected through excitatory nodes. The coupling via the external input I for the j-th oscillator in a chain is given by (7) Ij = Vj,j−1 xj−1 + Vj,j+1 xj+1 , Fig. 6. Firing pattern of the Wilson-Cowan oscillator (solid line – excitatory variable, dashed line – inhibitory variable).
where, similarly to the Wilson-Cowan oscillator, x is referred to as an excitatory variable while y is an inhibitory variable. I represents external stimulation of an oscillator and ε, γ, β are parameters. The x-nullcline is a cubic curve while the y-nullcline is a sigmoid function as shown in Fig. 7. If IT > 0, then (6) has a periodic solution represented by a thick solid line in Fig. 7. The operating point moves along this line, from the left branch (LB, the socalled silent phase), then jumps from the left knee (LK) to the right branch (RB, the so-called active phase), next reaches the right knee (RK) and jumps again to the left branch. If I T ≤ 0, the oscillator is inactive (no oscillations occur). A 2D grid of coupled Terman-Wang oscillators was used for solving complex image segmentation tasks (Strzelecki, 2004a; Terman-Wang, 1995).
where Vj,j−1 > 0 and Vj,j+1 > 0 are the coupling strengths of the connections of the j-th oscillator with its two neighbors. Note that for the relaxation oscillators, Ij influences the j-th oscillator dynamics at the time instances at which neighbor oscillators fire. Thus, the analysis of interactions between oscillators can be simplified to a phase analysis, as proposed first by Winfree (1967). Phases of N coupled oscillators evolve according to the following formulas: dϕ1 = ω1 + V1,2 Δ (ϕ1 − ϕ2 ) , dt dϕ2 = ω2 + V2,1 Δ (ϕ2 − ϕ1 ) + V2,3 Δ (ϕ2 − ϕ3 ) , dt .. . (8) dϕj = ωj + Vj,j−1 Δ (ϕj − ϕj−1 ) dt +Vj,j+1 Δ (ϕj − ϕj+1 ) , dϕN = ωN + VN,N −1 Δ (ϕN − ϕN −1 ) , dt where ωj is the uncoupled frequency, Δ(ϕ j − ϕk ) is the phase shift of the j-th oscillator resulting from stimulation received from the k-th oscillator. If the variables representing phase differences φ j = ϕj − ϕj+1 and the variables denoting uncoupled frequency differences Ωj = ωj − ωj+1 are introduced, and then the consecutive equations (8) are subtracted pairwise, the following equations are obtained in a vector form: dΦ = Ω + V Δ, dt where
Fig. 7. Nullclines and the limit cycle trajectory of the Terman-Wang oscillator.
⎡
Vf + Vb
⎢ ⎢ −V f ⎢ ⎢ ⎢ V =⎢ 0 ⎢ .. ⎢ ⎣ . 0
(9)
−Vb
0
Vf + Vb
−Vb
−Vf .. .
Vf + Vb .. .
··· .. . .. . .. .
···
0
−Vf
0 .. . 0 −Vb Vf + Vb
⎤ ⎥ ⎥ ⎥ ⎥ ⎥, ⎥ ⎥ ⎥ ⎦ (10)
Application of coupled neural oscillators for image texture segmentation and modeling of biological rhythms while making the simplifying assumption that the forward Vf and backward V b coupling strengths along the chain of oscillators are invariant, i.e., V f = Vj,j−1 and Vb = Vj,j+1 . For 1:1 phase-locked entrainment of the oscillators, i.e., dφj /dt = 0, Eqn. (9) becomes 0 = Ω + V Δ.
(11)
Since V is nonsingular (it is a positive definite tridiagonal matrix), we get (12) Δ = −V −1 Ω. Thus a phase locked-solution occurs if the following is satisfied: � −1 � �V Ω� < max |Δ| , (13) and we conclude that the larger the uncoupled frequency differences Ωj between the oscillators, the stronger the coupling connections need to be used to keep up the synchrony of this system of oscillators. It remains to determine that the obtained solution is stable under small perturbations to system parameters. If constant phase-locked phases are assumed, i.e., φ j = ϕ0 , the solution of the linearized equation (11) is given by � (14) ε(t) = ε0 exp V × Δ� (φ)t |φ=φ0 , where ε (t) denotes a small perturbation vector to the system. If the connection strengths are V f ∼ = Vb , the matrix V is positive definite with real and positive eigenvalues. Thus, the solution (14) is stable for the phase values for which Δ (φ) is a monotonously decreasing function, i.e., Δ� (φ) < 0. The stability of this solution plays an important role in sustaining synchrony in biological oscillator populations, and Δ (φ) is known as the Phase Response Curve (PRC). The PRC represents the amount of oscillator phase shift as a response to external pulse stimulation. In their electrophysiologic experiments, Guevara et al. (1990) measured the PRC for cardiac pacemaker cells. They obtained shapes of PRCs resembling the plot shown in Fig. 8. Note that this is a monotonously decreasing
Fig. 8. Shape of the phase response curve.
517
function except for φ = π. We can interpret this function in the following way: For φ ∈ (0, π), the oscillator’s phase range, an external stimulus delays oscillator phase (slows it down) whereas for φ ∈ (π, 2π) the stimulus advances the phase (speeds up the oscillator). Hence, the phase shift in both cases results in the reduction in the phase difference φ = ϕ j − ϕk between the phase of the kth stimulating oscillator (at the firing instant ϕ k = 0 ) and the phase of the j-th stimulated oscillator. This manner of phase shift is the mechanism underlying the phenomenon of synchronisation in populations of coupled oscillators, as confirmed by electrophysiologic studies (Guevara et al., 1990) In another approach at explaining the synchronous behavior of coupled oscillators, Somers and Kopell (1993) used the so-called fast threshold modulation mechanism. They proved a theorem saying that, for pulse coupled relaxation oscillators, a phase locked solution is achieved at an exponential rate.
5. Wilson-Cowan Oscillators for Modeling Synchronisation in Cardiac Pacemaker Cells The main concept behind this approach is the striking similarity observed between heart rhythm dynamics and nonlinear oscillators. This analogy has inspired Van der Pol and Van der Mark (1928) who first built an electrical model of the heartbeat by using three coupled relaxation oscillators. Strumiłło and Durrani (1991) observed that serially connected Wilson-Cowan oscillators coupled via excitatory nodes can serve as a viable model of the heart conduction system. In such a network, dynamic interactions between cardiac rhythm generating elements (pacemakers) can be demonstrated and the genesis of important cardiac arrhythmias explained. A more comprehensive discussion of this concept is given in (Strumiłło, 1993). Here we show selected examples and results obtained for serially coupled Wilson-Cowan oscillators. The parameters of the Wilson-Cowan model were chosen to achieve autonomous oscillations and identify its PRC. The parameters of the oscillator, as defined in (4), which were used in the demonstrated simulation results are the following: τ x = 0.2, τx = 0.24, wxx = 9.8, wxy = −9.5 wyy = −1.0, wyx = 6.5, and the parameters of the sigmoidal functions defined in (5) were θ x = 0.4, βx = 0.09, θy = 0.6, βy = 0.09 for the excitatory xnode and the inhibitory y-node. In each simulation run, the oscillator was perturbed using a single pulse with the amplitude I = 0.2 at a different phase of the oscillator cycle. In each subsequent test, the pulse administration phase was shifted by a fixed small amount to obtain 50 samples of the oscillator’s PRC. The simplest numerical
P. Strumiłło and M. Strzelecki
518 integration method based on the Euler integration with time step Δt = 0.05 was used for simulating the oscillator dynamics. The plot of the PRC obtained from computer simulations shown in Fig. 9 resembles the shape of the PRC
Fig. 11. Chain of oscillators coupled bidirectionally through excitatory nodes.
Fig. 9. Phase response curve obtained for the Wilson-Cowan oscillator model.
shown in Fig. 8, which retains the stability of synchronised oscillations. The results of this simulated perturbation analysis closely match the relevant behavior displayed by cardiac pacemaker cells (Guevara et al., 1990). In much the same way as for the biological counterpart, stable entrainment zones of this oscillator model were obtained. Figure 10 shows that the Wilson-Cowan oscillator is capable of 1:1 synchronisation to an external stimulus of considerable different firing rates from the oscillator free-running frequency.
Fig. 10. Zones of stable entrainment of the Wilson-Cowan oscillator to the periodic stimulus of a varying frequency.
In order to model the synchronization mode of the pacemaker cells, different free-running frequencies ω j were associated with each j-th oscillator in a chain-like
network as illustrated in Fig. 11. As for the cardiac conduction system, there is a leading pacemaker with the highest free-running frequency and there is a decrease in the uncoupled frequency of the serially connected pacemakers, i.e., ω 1 > ω2 > · · · > ωj > · · · > ωN . Similarly as for the real cardiac natural pacemaker structure, the frequency ratio between the leading and the terminal pacemaker is ω 1 /ωN = 3. The number of bidirectionally coupled oscillators used in simulations was in the range from N = 20 to N = 60. This number was sufficient to demonstrate different synchronisation scenarios between the oscillators in the given chain-like structure. The coupling strengths between the adjacent oscillators for which stable 1:1 entrainment is sustained was V = Vf = Vb ≥ 2.0 (see Eqns. (7)–(10)). Note from Fig. 12(b) that, in the so coupled oscillators (which is in agreement with the theoretical analysis provided in Section 4), there is a small phase delay between each subsequent oscillator in a chain. Two main types of arrhythmic conditions were simulated within the chain model of oscillators, i.e., those due to an abnormal function of the pacemaker and those due to conduction abnormalities. Numerically simulated arrhythmias of both types show arrhythmic patterns that match different abnormal heart functions (Strumiłło, 1993). Figure 12 provides an example of a conduction system abnormality known as the 2:1 conduction block, i.e., the condition in which every second pulse transmitted along the oscillator chain is blocked. By varying coupling strengths between the oscillators (V = V f = Vb < 2.0), different entrainment patterns of higher orders, e.g., 3:2, 4:3 or 3:1, 4:1 were obtained. These results have important clinical relevance since clinical observations show that even small disturbances in the conduction system can lead to life-threatening arrhythmias.
6. Image Segmentation by Means of a 2D Network of Terman-Wang Oscillators The segmentation method presented in this chapter implements a network of synchronized oscillators of the Terman-Wang type. This recently developed tool, which is based on temporal correlation theory, attempts to ex-
Application of coupled neural oscillators for image texture segmentation and modeling of biological rhythms
x
time [sec]
(a) time [sec]
519
The oscillators defined by (6) are connected to form a two-dimensional network. In the simplest case, each oscillator is connected only to its four nearest neighbors (larger neighborhood sizes are also possible). Such a network is shown in Fig. 13. Network dimensions are equal to the dimensions of the analyzed image and each oscillator represents a single image pixel. Each oscillator in the network is connected to the so-called global inhibitor (GI in Fig. 13). It receives signals from oscillators and, in turn, can eventually inhibit the whole network. Generally, the total oscillator stimulation I is given by � Wik H(xk − θx ) − Wz z, (15) I = Iin + k∈N (i)
Oscillator no.
(b) Fig. 12. Illustration of 2:1 oscillators entrainment: (a) transition from 1:1 synchronisation to 2:1 entrainment of the oscillator activity plotted as a solid line to the oscillator plotted as a dashed line, (b) spatio-temporal plots of the oscillator chain activity with 2:1 entrainment shown in the upper-right part of the plot.
plain scene recognition as it would be performed by a human brain. This theory assumes that different groups of neural cells encode different properties of homogeneous image regions (e.g., shape, color, texture). Monitoring the temporal activity of cell groups allows detecting such image regions and, consequently, leads to scene segmentation. Oscillator networks were successfully used for segmentation of Brodatz textures (Çesmeli and Wang, 2001), MR brain images (Sharef et al., 1999), MR foot crosssections textures (Strzelecki, 2002), heart tumor echocardiograms (Strzelecki et al., 2006). The advantage of this network is its adaptation to local image changes (related both to image intensity and texture), which in turn ensures correct segmentation of noisy and blurred image fragments. Another advantage is that synchronized oscillators do not require any training process, unlike artificial neural networks. An oscillator network is also able to detect texture boundaries (Strzelecki, 2004b). Finally, such a network can be manufactured as a VLSI chip for very fast image segmentation (Kowalski and Strzelecki, 2005).
Fig. 13. Region of the 2D oscillator network; each oscillator is connected with its neighbors through positive weights Wik; the global inhibitor (GI) is connected to each oscillator.
where Iin denotes external stimulation to the oscillator (the image pixel value). The W ik s are synaptic weights connecting the oscillators k and i. The number of these weights depends on the neighborhood size N (i). Due to these local excitatory connections, an active oscillator spreads its activity over the whole group of oscillators which represent an image object. It provides a synchronization of the whole group. θ x is a threshold above which the oscillator k becomes active. H is a Heaviside function. Wz is the weight associated with of the inhibitor z, which is equal to one if at least one network oscillator is in the active phase (x > 0), and it is equal to zero otherwise. The role of the global inhibitor is to provide the desynchronisation of oscillator groups representing different objects from the one which is currently being synchronized. The global inhibitor will not affect any synchronized oscillator group because the sum in (15) has a greater value than W z . For the task of image texture segmentation, the network weights are set according to (Çesmeli and Wang, 2001): � s s � � k fik f¯N A (i) Wij =
k=1
ε+
s � k=1
k=1
|fik
−
fjk |
,
(16)
P. Strumiłło and M. Strzelecki
520 where A is the number of active oscillators in the neighborhood N (i), f ik and fjk correspond to the k-th texture feature evaluated for the oscillators i and j, respectively, k k f¯N (i) is the mean value of the feature f calculated for active oscillators in the neighborhood N (i), and s is the number of texture parameters. These parameters are evaluated for some windows centered at the pixels i and j, and are high for homogeneous texture regions and low for a region representing texture boundaries. Because the excitation of any oscillator depends on the sum of the weights of its neighbors, all oscillators in the homogeneous textured region oscillate in synchrony. Each texture region is represented by a different oscillator group. Oscillator activation is switched sequentially between groups in such a way that at a given time only one group (representing a given texture) is synchronously oscillating. The segmentation of texture regions is performed by analyzing oscillator outputs (Çesmeli and Wang, 2001; Strzelecki, 2002). For the task of texture boundary detection, the weight connecting the oscillators i and j is set as follows (Strzelecki, 2004b): k Wij = FW (fjk , fN (i) )
s � � k � �fi − fjk �,
(17)
k=1
where Fw is a function used for reducing weight variation over homogeneous regions (e.g., of the same form as the numerator of Eqn. (16)). This function depends on k the texture features f jk of the j-th pixel and features f N (i) evaluated for the neighborhood N (i) of the pixel i. Thus, the weights are large on texture boundaries (due to large differences between the texture features f jk and fik ) and only oscillators located there are activated. Active oscillators delineate an edge of a given texture region and the analysis of their outputs permits texture boundary detection. A segmentation algorithm using an oscillator network was presented in (Linsay and Wang 1998). It is based on a simplified oscillator model and does not require the solution of Eqn. (6) for each oscillator. This algorithm was applied to segment biomedical images (Çesmeli and Wang, 2001; Shareef et al., 1999; Strzelecki, 2002; 2004a).
the image background. Then, for each ROI, 266 texture parameters were calculated (based on the co-occurrence matrix, the run length matrix, the gradient matrix, the first order autoregressive model and Haar wavelet transform coefficients). The number of parameters was reduced using the minimization of the classification error along with the average correlation coefficient (Mucciardi and Gose, 1971). This method generates a set of least correlated features that provides a minimum classification error. The selected parameters came from the run length matrix and the autoregressive model. Next, nonlinear discriminant analysis (NDA) was performed using a three-layer feedforward neural network. NDA transforms the input texture features into a new nonlinear feature space to provide a further feature reduction and its linear separability. Another advantage of NDA is reduction in input data variance in the new space (Strzelecki, 2004a). The obtained NDA features were further applied to define oscillator weights according to (16) and (17). Texture feature estimation, selection and the NDA were performed using the MaZda software, a tool developed for texture analysis at the Institute of Electronics, Technical University of Łód´z (Materka, 2002). Image segmentation was performed using the algorithm described in (Strzelecki, 2004a). Choosing the values for oscillator network parameters (such as the global inhibitor weight W z in (15) or the constant A in (16)) is rather an iterative and heuristic procedure that depends on the estimated features of the textured image regions. A detailed discussion of the settings of network parameters can be found in (Strzelecki, 2004a).
(a)
(b)
(c)
(d)
7. Image Segmentation Examples The oscillator network was applied to the segmentation of sample tumor echocardiac images (Strzelecki et al., 2006). This kind of mass is relatively large and clearly distinguishable from the image background. A sample image of size 640 × 480 with 256 gray levels is shown in Fig. 14(a). A region of interest (ROI) marked by the white line was defined by a cardiologist to outline an intracardiac mass. It was assumed that the image contains two textures: one representing a tumor and the other related to
Fig. 14. Echocardiac image containing a benign tumor (a); segmentation results using the oscillator network with weights programmed for the detection of texture regions (b) and the texture boundary (c); the same for an artificial neural network (d).
Application of coupled neural oscillators for image texture segmentation and modeling of biological rhythms Segmentation results for a sample benign tumor from Fig. 14(a) are shown in Fig. 14(b). Only the echocardiogram part of the image was analyzed. Generally, the masses were correctly separated from the background. The white margins between the detected masses and the background represent a nonclassified area. An artefact object detected by the oscillator network can be seen in the upper part of the mass in Fig. 14(b). Intracardiac mass boundaries, obtained by the network with weights set according to (17), are presented in Fig. 14(c). The detected outlines resemble the correct mass shapes from Fig. 14(b). For comparison, the same images were segmented using a feed forward neural network. The results are presented in Fig. 14(d). Also in this case intracardiac masses were detected correctly. There are no unclassified white regions. However, some fragments in the middle part of the image, representing the background, were misclassified as a mass area. The proposed method was also tested on sample MR biomedical images representing human foot crosssections, containing heel and metatarsus bones. These images were recorded in the German Cancer Research Centre, Heidelberg, Germany, using a 1.5 T Siemens scanner. An exemplary 512 × 512 image is shown in Fig. 15(a). The segmentation of these images is aimed at the detection of foot and heel bones (marked with white lines) from other tissues and the image background. The extracted region is interpreted by physicians to evaluate the bone microarchitecture in the diagnosis of osteoporosis. As texture features, Gaussian-Markov random field (GMFR) model parameters were assumed. In (Strzelecki, 2004a) it was demonstrated that the GMRF model fits very well this class of textures. Thus the GMRF parameters were estimated for each image point (a vector of 15 parameters). Then an NDA analysis was performed, as in the case of echocardiograms. Two new nonlinear features were used to form oscillator network weights. The following three segmentation tools were tested on the same texture feature set: a multilayer perceptron network, an oscillator network programmed to detect the texture region, and an oscillator network with weights set for boundary detection. A detailed estimation procedure of GMRF parameters and an algorithm that employs an oscillator network for image segmentation are described in (Strzelecki, 2002). Segmentation results for the perceptron network and the oscillator network programmed for region detection, shown in Figs. 15(b) and (c), are similar. Generally, the bones were correctly extracted from the image background. Segmentation errors can be seen in the image background, where tissue regions were identified as bones. The oscillator network provides bone object labelling that can be useful for further processing. For the oscillator network with the weights set using (17), only the texture boundaries were detected. However,
(a)
(b)
(c)
(d)
521
Fig. 15. Sample MR image of human foot cross-section (a); segmentation results using: a multilayer perceptron network (b), an oscillator network programmed for: region detection (c) and boundary detection (d). Segmented images are smaller than the original because texture features are calculated for pixel masks that are clipped at image borders.
some wrongly detected metatarsus (soft) tissue located in Figs. 15(b) and (c) is not found in Fig. 15(d). This can be explained by a lower number and weaker activation of the boundary tissue oscillators compared with the oscillators located inside the tissue region. This segmentation method is also much faster than the method for which the network was programmed for region detection (60% reduction in the computation time was gained). This is because the number of active boundary oscillators is much smaller than the number of oscillators associated with the texture area.
8. Summary and Conclusions Models of different relaxation oscillators have been discussed. These oscillator types are inspired by rhythmic behavior observed in biology and engineering. The nonlinearity of the oscillators proved necessary in achieving synchronised actions in populations of interconnected oscillators. For pulse coupled oscillators, only a phase analysis suffices, as was first proposed by Winfree (1967) for the explanation of emergent synchronised rhythms. Such rhythms characterize physiological mechanisms in
P. Strumiłło and M. Strzelecki
522 most living organisms. This is the reason why so much research interest has been focused recently on this type of nonlinear systems. Models of relaxation oscillators currently play an important role in studies of physiological phenomena and pave their way into image analysis applications (Wang, 2005). The latter area of study is exemplified in a successful application of the Terman-Wang 2D oscillator network for image texture segmentation tasks. In this work, the following contributions to the aforementioned research field were made: • identification of the phase response curve (PRC) of the Wilson-Cowan oscillator and the indication of its shape resemblance to the relevant curve observed in cardiac pacemakers (the shape of the demonstrated PRC is a key issue in obtaining a stable entrainment rhythm between pacemakers of different intrinsic frequencies); • explanation of particular cardiac arrhythmias (by means of a computer simulated structure of coupled oscillators) as synchronisation disturbances between coupled pacemaker models; • development of an image segmentation algorithm that uses a network of synchronised oscillators for detecting texture boundaries; it was shown that this algorithm offers a significant computation speed-up and superior quality on difficult segmentation tasks in comparison with region based algorithms.
Acknowledgments The authors wish to express their gratitude to Mr. Marcin Byczuk for providing EEG recordings. ECG records have been downloaded from the ECG MIT/BIH Arrhythmia Database.
References Çesmeli E. and Wang D. (2001): Texture segmentation using Gaussian-Markov random fields and neural oscillator networks. — IEEE Trans. Neural Netw., Vol. 12, No. 3, pp. 394–404. Eckhorn R., Bauer R., Jordan W., Brosch M., Kruse W., Munk M. and Retbock H.J. (1988): Coherent oscillations: A mechanism of feature linking in the visual cortex? — Biol. Cybern., Vol. 60, No. 2, pp. 265–280. Freeman W.J. (1978): Spatial properties of an EEG event in the olfactory bulb and cortex. — Electroenceph. Clin. Neurophysiol., Vol. 44, No. 5, pp. 586–605. Glass L. and Mackey M.C. (1990): From Clocks to Chaos: The Rhythms of Life. — New York: Princeton University Press.
Guevara M., Shrier A. and Glass L. (1990): Chaotic and complex cardiac rhythms, In: Cardiac Electrophysiology: From Cell to Bedside, (Zipes D.D. and Jalife J., Eds.). — Philadelphia: W.B. Saunders Company, pp. 192–200. Hu Y.H. and Hwang J.-N. (2001): Handbook of Neural Network Signal Processing. — Boca Raton, FL: CRC Press. Jain A.K., Duin R.P.W. and Mao J. (2000): Statistical pattern recognition: A review. — IEEE Trans. Pattern Anal. Mach. Intell., Vol. 22, No. 1, pp. 4–37. Konig P. and Schillen T.B. (1991): Stimulus-dependent assembly formation of oscillatory responses: I. Synchronization. — Neural Comput., Vol. 3, No. 2, pp. 155–166. Korbicz J., Ko´scielny J.M., Kowalczuk Z. and Cholewa W. (2004): Fault Diagnosis: Models, Artificial Intelligence, Applications. — Berlin: Springer-Verlag. Kowalski J. and Strzelecki M. (2005): CMOS VLSI chip for segmentation of binary images. — Proc. IEEE Workshop Signal Processing, Pozna´n, Poland, pp. 251–256. Linsay P. and Wang D. (1998): Fast numerical integration of relaxation oscillator networks based on singular limit solutions. — IEEE Trans. Neural Netw., Vol. 9, No. 3, pp. 523– 532. Materka A. (2002): MaZda User’s Manual. — Available at: http://www.eletel.p.lodz.pl/cost/ progr_mazda_eng.html Michalewicz Z. (1996): Genetic Algorithms + Data Structures = Evolution Programs. — Berlin: Springer. Mucciardi A. and Gose E. (1971): A comparison of seven techniques for choosing subsets of patter recognition properties. — IEEE Trans. Comput., Vol. C-20, No. 9, pp. 1023– 1031. Narenda K.S. and Parthasarathy K. (1990): Identification and control of dynamical systems using neural networks. — IEEE Trans. Neural Netw., Vol. 1, No. 1, pp. 4–27. Rutkowski L. (2004): Flexible Neuro-Fuzzy Systems. — Boston: Kluwer. Shareef N., Wang D. and Yagel R. (1999): Segmentation of medical images using LEGION. — IEEE Trans. Med. Imag., Vol. 18, No. 1, pp. 74–91. Somers D. and Kopell N. (1993): Rapid synchrony through fast threshold modulation. — Biol. Cybern., Vol. 68, No. 5, pp. 393–407. Strumiłło P. (1993) Neurodynamic Modelling of the Human Heartbeat. — Ph.D. Thesis, Univ. Strathcyle, UK. Strumiłło P. and Durrani T.S. (1991): Simulations of cardiac arrhythmias based on dynamical interactions between neural models of cardiac pacemakers. — Proc. 2nd Int. Conf. Artificial Neural Networks, Bornemouth, UK, pp. 195–199. Strumiłło P. and Durrani T.S. (1996): Spiral waves in a 2-D model of fibrillating heart and a new way to break them. — Med. Science Mon., Vol. 2, No. 4, pp. 495–504. Strzelecki M. (2002): Segmentation of MRI trabecular-bone images using network of synchronised oscillators. — Mach. Graph. Vis., Vol. 11, No. 1, pp. 77–100.
Application of coupled neural oscillators for image texture segmentation and modeling of biological rhythms Strzelecki M. (2004a): Segmentation of image texture using network of synchronised oscillators and statistical methods. — Sci. Lett., No. 946, Technical University of Łód´z, (in Polish). Strzelecki M. (2004b): Texture boundary detection using network of synchronized oscillators. — Electron. Lett., Vol. 40, No. 8, pp. 466–467. Strzelecki M., Materka A., Drozdz J., Krzemi´nska-Pakuła M. and Kasprzak J.D. (2006): Classification and segmentation of intracardiac masses in cardiac tumour echocardiograms. — Comp. Med. Imag. Graph., (in print). Tadeusiewicz R. (1993): Neural Networks. — Warsaw: Akademicka Oficyna Wydawnicza, (in Polish). Terman D. and Wang D.L. (1995): Global competition and local cooperation in network of neural oscillators. — Phys. D, Vol. 81, Nos. 1–2, pp. 148–176. Van der Pol B. and Van der Mark J. (1928): The heartbeat considered as a relaxation oscillation, and an electrical model of the heart. — London, Edinburgh, and Dublin Philosoph. Mag., and J. Sci., Ser. 7, Vol. 6, pp. 763–775.
523
Von der Malsburg C. and Schneider W. (1986): A neural cocktail-party processor. — Biol. Cybern., Vol. 54, pp. 29– 40. Wang D. (1995): Emergent Synchrony in Locally Coupled Neural Oscillators. — IEEE Trans. Neural Netw., Vol. 4, No. 6, pp. 941–948. Wang D. (2005): The time dimension for scene analysis. — IEEE Trans. Neural Netw., Vol. 16, No. 6, pp. 1401–1426. Wilson H.R. and Cowan J.D. (1972): Excitatory and inhibitory interactions in localized populations of model neurons. — Biophys. J., Vol. 12, No. 1, pp. 1–24. Winfree A.T. (1967): Biological rhythms and the behaviour of populations of coupled oscillators. — J. Theoret. Biol., Vol. 16, No. 1, pp. 15–42. Received: 14 March 2006 Revised: 24 September 2006