Analyst, September 1997, Vol. 122 (925–929)
925
Application of Derivative Variable-angle Synchronous Scanning Phosphorimetry in a Microemulsion Medium for the Simultaneous Determination of 2-Naphthoxyacetic Acid and 1-Naphthalenacetamide Antonio Segura Carretero, Carmen Cruces Blanco* and Alberto Fern´andez Guti´errez Department of Analytical Chemistry, Faculty of Sciences, University of Granada, C/Fuentenueva s/n, 18071 Granada, Spain. E-mail:
[email protected]
The applicability of derivative variable-angle synchronous scanning (DVASS) microemulsion phosphorimetry at room temperature (ME-RTP) was demonstrated for the simultaneous determination of the plant growth regulators 2-naphthoxyacetic acid and 1-naphthalenacetamide in soil samples. This technique permits linear or non-linear paths to be scanned at preselected angles through the excitation–emission phosphorescence matrix in order to obtain the highest signal values and interference-free bands. The phosphorescence emission of the two compounds was obtained using sodium sulfite as an O2 scavenger and thallium nitrate as an external heavy atom salt perturbed in sodium docecyl sulfate microemulsion aqueous solutions. A statistical model of the central composite design type to obtain the optimum phosphorescence responses was applied. The increased selectivity afforded by the DVASS technique permitted the demonstration of its applicability to the simultaneous determination of phosphorescent signals of these two compounds obtained in a microemulsion medium which show closely overlapped profiles giving mean recoveries of 89.0% (n = 5) for 1-naphthalenacetamide and 103.5% (n = 5) for 2-naphthoxyacetic acid, with an RSD of 7.35 and 5.90%, respectively, in real samples. Keywords: Derivative variable-angle synchronous scanning phosphorimetry; phytohormones; room temperature phosphorescence; microemulsion; experimental design Because of the overlap of the broad-band spectra observed when carrying out multicomponent analysis of real samples by luminescence techniques, many types of time-consuming separation techniques are always required. Synchronous spectrometry (SS), a method first used by Lloyd1 to identify a number of fluorescent PAHs, involves simultaneous scanning of the excitation and emission monochromators synchronized in such a fashion that a well defined relationship is maintained between the two wavelengths. This technique has the limitation of exploring only those sections of the excitation–emission matrix (EEM) located at 45°. This problem was overcome by Kubic et. al,2 who introduced a modification of conventional synchronous scanning called variable-angle synchronous scanning3–5 (VASS), which permits the relative scan speeds of each monochromator to be varied digitally3 or by a microcomputer6–9 and any zones of the EEM to be explored, avoiding the limitation mentioned above. The VASS technique does not require highly sophisticated equipment but its application was not extended until computer systems became part of most equipment. Most of these applications are related to the analysis of fluorescent compounds,4,10–18 with only one application to the resolution of mixtures of phosphorescent compounds.6,19
The true advantage of VASS over SS is not related to the band-narrowing effect but to the capacity to go throughout maximum intensity peaks (which circumvents overlapping spectral areas), giving great flexibility in choosing the scan paths to pass as near as possible to the spectral maxima of different compounds, which is a valuable advantage in the resolution of compounds in multicomponent analyses of real samples over SS or derivative synchronous techniques. In this work, the use of VASS was extended to the application of derivative scanning of the corresponding VASS spectra obtained from the detailed inspection of those parts of the EEM where less interference from one analyte to the other is obtained. The better results obtained with this derivative variable-angle synchronous scanning spectroscopic (DVASS) technique applied to the resolution of a mixture of two phosphorescent compounds at room temperature in solution was demonstrated in the simultaneous determination of the phytohormones 1-naphthaleneacetamide (NAD) and 2-naphthoxyacetic acid (NOA), which are usually applied to prevent fruit fall, so fruit composition has to be specially regulated in each country. Despite the native fluorescence of NAD,20,21 the possibility of applying phosphorescence detection has not previously been considered. With respect to NOA, only a few phosphorimetric methods have been proposed, mainly at low temperature,22–24 with only two using room temperature with a solid support25,26 or micellar27 or organized media.28 As the derivative method permits the division of total luminescence spectra into positive and negative parts, better resolution for simultaneous quantification can be achieved by comparison of the derivative variable-angle phosphorescent emission–excitation matrices of both compounds, allowing one to find zones where quantification can be carried out without interferences from other compounds in the mixture. In this paper, we present the first application of DVASS with phosphorescence detection to the simultaneous determination of NAD and NOA in soil samples, with very satisfactory results. Experimental Reagents The solvents used, dichloromethane and butan-1-ol, the surfactant sodium dodecyl sulfate (SDS), analytical-reagent grade thallium(i) nitrate and anhydrous sodium sulfite (all from Sigma, St. Louis, MO, USA) were used as received. Aqueous solutions were prepared with doubly distilled water. The sodium sulfite solutions were prepared daily and kept in tightly stoppered containers. NAD and NOA (Sigma) were used without further purification. Microemulsion stock standard solutions were prepared by dissolving 10 mg of NAD or NOA in 1 ml of dichloromethane and 1 ml of butan-1-ol and diluting to 100 ml with 0.5 mol l21 SDS.
926
Analyst, September 1997, Vol. 122
All experiments were performed with analytical-reagent grade chemicals and pure solvents. Doubly distilled, demineralized water was used throughout. Instrumentation and Software All recordings of uncorrected luminescence spectra and measurements of micelle-stabilized roon temperature phosphorescence (MS-RTP) intensities were carried out with an Aminco Bowman (Rochester, NY, USA) Series 2 luminescence spectrometer equipped with a 7 W pulsed xenon lamp and a thermostated cell holder. The system was controlled with a personal computer with a 40 MB hard disk, 4 MB of RAM, a 3.5 in 1.44 MB floppy disk drive, a VGA color monitor with VGA graphics adapter card, a serial two-button mouse, DOS 6.0, OS/2 version 2.0 and a GPIB(IEEE-488) interface card for computer instrument communication. An Ultrasons ultrasonic bath (Selecta, Barcelona, Spain) was used for sample sonication. The software package used to carry out the experimental design was STATGRAPHICS, Statistical Institution Edition Version 6.0 (Statistical Graphics, Rockville, MD, USA). General Procedure A 30 or 200 ml aliquot of NAD or NOA microemulsion, respectively, 0.730 or 0.560 ml of 0.5 mol l21 SDS, respectively, 1.00 ml of 0.25 mol l21 thallium(i) nitrate and 0.25 ml of 0.8 mol l21 sodium sulfite were introduced into a 10 ml calibrated flask and diluted to volume with water. If a precipitate appeared after the addition of the thallium(i) nitrate, the flask was warmed until the precipitate disappeared, before the other reagents were added. After thorough mixing, the flask was placed in a water-bath at 25 ± 1 °C for 10 min. Standard 10 mm fused-silica cells were filled with this analyte solution. The relative phosphorescence intensities of the samples and the blank were measured at lex/lem 280/478 nm for NAD and lex/lem 336/501 nm for NOA. The gate time (tg) was kept constant at 200 ms for both compounds and the delay time (td) was 200 ms for NAD and 100 ms for NOA. Excitation and emission slits of 16 nm were used throughout. Phosphorescence signals at the fixed wavelengths were used to construct the corresponding calibration graphs. Procedure for Soil Sample Analysis The method was applied to soil samples from G´ojar village (Granada, Spain). Certain amounts of NAD and NOA were added to 10 g of sample in such a way that the final concentration was included in the range of the calibration graph. The samples were extracted twice with a mixture of 20 ml of dichloromethane and 20 ml of butan-1-ol, filtering under vacuum, and washing the dry residue with 40 ml of the same mixture. Both extracts were mixed and evaporated to dryness in a rotary evaporator at 60 °C. The residue was diluted to 10 ml with the above mixture and 2 ml were taken and diluted with 100 ml of 0.5 mol l21 SDS. The basic procedure was applied to this solution. Caution: thallium(i) salts and dichloromethane are very toxic. Results and Discussion Experimental Variables MS-RTP suffers from a limitation due to the slow dissolution of hydrophobic analytes. To avoid this problem in analyses for compounds such as NAD and NOA, an aqueous microemulsion of the analytes in apolar solvents was used. A microemulsion is a stable, optically transparent monodisperse system of 10–20
mm diameter droplets intermediate in size between an emulsion and a micelle. Microemulsions are formed spontaneously when appropriate amounts of water, an apolar solvent, a surfactant and a co-surfactant are mixed. To form oil-in-water (o/w) microemulsions containing a hydrocarbon core, critical concentrations of the surfactant SDS and of the apolar solvent and the alcohol should be carefully selected to create a microenvironment where the two phytohormones should be protected from collisional deactivation that can cause phosphorescent quenching. For this reason, different proportions of the apolar solvent dichloromethane and the alcohol butan-1-ol were tested between 0.5 and 6% v/v. The best results were obtained when using 2% dichloromethane and butan-1-ol, and this proportion was selected for the rest of the experimental work, while the concentrations of dichloromethane and butan-1-ol in the final solution were 0.02%, respectively. Together with the selection of these concentrations, an external heavy atom addition with deoxygenation carried out by sodium sulfite is decisive in obtaining intense RTP signals. Hence studies of the effects of each of these experimental variables and their interactions have to be carried out. The simplest way to do this is to use a three-variable, composite cube-star design.29 The variables used in this multivariate optimization were SDS, TlNO3 and Na2SO3 concentrations. The maximum response was obtained with [SDS] = 3.8031022 mol l21, [TlNO3] = 2.5031022 mol l21 and [Na2SO3] = 2.0031022 mol l21 and these concentrations were used in the rest of the experimental work. The different instrumental parameters that could affect the phosphorescence response, such as wavelength maxima, scanning speed, delay time, gate time and detector sensitivity, were conveniently selected (see Table 1). In order to avoid possible phosphorescence signal modifications, a thermostatically controlled water-bath at 25 ± 1 °C was adopted for the rest of the experimental work. At this temperature and after waiting 5 min before making measurements, the phosphorescence signals remain stable for at least 1h. Phosphorescence Spectral Characteristics The object of this work was to extend the interesting characteristics of the derivative technique, previously demonstrated in applications to normal excitation and emission spectra, and to synchronous spectra in luminescence analysis, to their application to the spectra obtained after variable-angle synchronous scanning spectrometry. As can be seen from Fig. 1, the simultaneous determination of NAD and NOA by normal fluorescence spectrometry is not possible, owing to their great spectral overlap. Based on the possibility in this work of obtaining the phosphorescence signal of both compounds using a microemulsion medium, a careful examination of the phosphorescence spectra of these two compounds was carried out. The extent of the possible phosphorescence spectral overlap can be usefully examined by interfacing a microcomputer to the spectrometer to obtain the total phosphorimetric information Table 1 Instrumental parameters Parameter Excitation/emission wavelength/nm Excitation/emission slits/nm Minimum period pulse/ms Scanning speed/nm s21 Delay time/ms Gas time/ms Detector sensitivity/V
NAD 280/478 16/16 5 2 100 200 1100
NOA 336/501 16/16 5 2 200 200 1100
Analyst, September 1997, Vol. 122
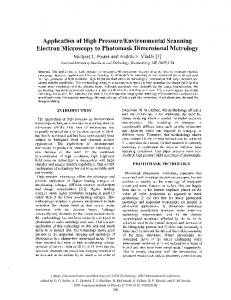
available in the EEM. With suitable computer programs, the three-dimensional (3-D) spectra can be obtained and presented as an isometric projection, where the emission spectra at stepped increments of the excitation wavelength are recorded and plotted. Also, the 3-D spectra can be effectively transformed into a 2-D plot with iso-lines of equal intensity as a function of excitation and emission wavelengths [see Fig. 2(a) and (aA)]. The 2-D representation is of great interest as it yields information about the most suitable route to follow in the excitation–emission matrix to obtain the variable-angle phosphorescence spectra, which could allow their simultaneous determination.
Fig. 1 Normal excitation–emission fluorescence spectra of 0.30 mg ml21 of NAD (dashed lines) and 1.0 mg ml21 of NOA (dotted lines). Detector sensitivity, 700 V. [SDS] = 3.8031022 mol l21.
927
Although high resolution is always demonstrated in the application of VASS to fluorescence or phosphorescence EEM, the similarity of the chemical structures of the present two analytes impedes their direct determination. Because once a VASS spectrum has been obtained it could be manipulated by a suitable computer program, the possibility of applying the derivative technique to these spectra was considered. These DVASS spectra consist of positive [Fig. 2(b) and (bA)] and negative [Fig. 2(c) and (cA)] parts, which increased the possibilities of resolution. The individual derivative contour plots for NAD and NOA showed that the main peaks with interference-free bands were centred on their respective wavelength excitation–emission pairs lex/lem 280/478 and 336/501 nm for NAD and NOA, respectively, using the positive and negative parts of the contour plots of the corresponding derivatives for both compounds. One of the most important merits of contour plots is that sections through them give very useful information. The application of DVASS has made it possible to explore those areas of this contour plot where the highest signal values with interference-free bands are present. Because phosphorescence measurement works with two additional parameters (td and tg) compared with fluorescence, we used them as another selectivity parameter. As can be seen in Fig. 2, there is partial overlap between NAD and NOA under the NAD measurement conditions. For this reason, we made use of the differences between the td values of the two compounds. On varying the td value from 100 to 200 ms, a marked decrease in the phosphorescence signal of the NOA was observed whereas maximum phosphorescence response was obtained for NAD at 200 ms. To measure the VASS spectra, no special equipment was required. The excitation/emission monochromators were changed manually and 30 points of each EEM route section were selected to measure the phosphorescence signals under the
Fig. 2 Two-dimensional image plot of total luminescence spectra (a and aA) and positive (b and bA) and negative (c and cA) part of the corresponding derivative spectra for NAD and ANOA, respectively. a, b and c, NAD 0.30 mg ml21; and aA, bA and cA, NOA 2.0 mg ml21. td 200 ms for NAD and 100 ms for NOA; tg, 200 ms, detector sensitivity 1100 V. [SDS] = 3.80 3 1022 mol l21; [TlNO3] = 2.50 3 1022 mol l21; [Na2SO3] = 2.00 3 1022 mol l21.
928
Analyst, September 1997, Vol. 122
instrumental conditions previously selected. The phosphorescent signals obtained were then treated in a software graph package to construct the spectra. The variable-angle scanning route was carefully determined by trial and error to traverse those parts of the 3-D spectral zones with the least overlap. The scan was selected to transverse those parts of the 3-D data matrix with the least overlap and the closest approach of the maximum peaks. In spite of the fact that losses in sensitivity occur because no maximum peaks are traversed, interference-free signals of the two components may be obtained from the chosen routes that scan the 3-D zones by skirting the slopes of the peak and avoiding the areas of interference between the two compounds. Fig. 3 shows a 3-D variable-angle scanning spectrum for a binary mixture. The technique used to choose suitable wavelengths to take measurements proportional to NAD and NOA concentrations for the preparation of calibration graphs was the ‘zero contributions’ method. As Fig. 4 shows, the measurements of the relative phosphorescence intensity for a mixture of these phytohormones at lex/lem 280/478 nm is a function of NAD concentration only and at 336 and 501 nm is a function of NOA concentration only. Consistently these wavelength values were selected to construct the calibration graphs.
Analytical Parameters In order to test the mutual independence of the analytical signals of NAD and NOA from the corresponding concentration of the other compound at the wavelengths selected, the following calibrations were performed. The technique used to choose suitable wavelengths to take measurements proportional to the two phytohormones for the preparation of calibration graphs was the ‘zero contribution’ method. As can be seen in Fig. 5, the measurements of the phosphorescence intensity for a mixture of these phytohormones at lex/lem 280/478 and 336/501 nm are functions of NAD and NOA concentrations, respectively, and were used to establish the corresponding calibration graphs. It can be seen that increasing the concentration of each compound in turn had no effect on the measurement wavelength of the other compound. These calibration graphs were constructed for standard solutions containing between 0.15 and 0.60 mg ml21 of NAD and 1 and 4 mg ml21 of NOA. The more important analytical parameters30 for the two compounds are summarized in Table 2. The repeatability of the proposed method was determined. The precision was measured for phytohormone concentrations of 0.30 mg ml21 of NAD and 2 mg ml21 of NOA with seven independent determinations. The RSDs were 3.50 and 3.64% for NAD and NOA, respectively. The VASS phosphorimetric method was also applied to the analysis of several synthetic mixtures of the two compounds in different ratios using the same tolerance criteria as indicated previously. The results are summarized in Table 3; very good recoveries were always obtained.
Fig. 3 Three-dimensional spectra of a mixture of NAD and NOA. Conditions as in Fig. 2.
Fig. 5 Two-dimensional projections of the calibration graphs established for (dashed line) NAD [(1) 0, (2) 0.15, (3) 0.30, (4) 0.45 and (5) 0.60 mg ml21] and (dotted lines) NOA [(1) 0, (2) 1.0, (3) 2.0, (4) 3.0 and (5) 4.0 mg ml21]. td, 200 ms for NAD and 100 ms for NOA; tg, 200 ms; detector sensitivity, 1100 V. [SDS] = 3.80 3 1022 mol l21; [TlNO3] = 2.50 3 1022 mol l21; [Na2SO3] = 2.00 3 1022 mol l21. Table 2 Analytical parameters Parameter Linearity [1 2 RSD (b)%]* Analytical sensitivity/mg ml21 Detection limit/mg ml21 Quantification limit/mg ml21 Linear dynamic range/mg ml21 Fig. 4 Two-dimensional projection of: (dashed line) NAD, (dotted line) NOA and (solid line) a binary mixture. Conditions as in Fig. 2.
*
See ref. 30.
NAD
NOA
97.99 0.0165 0.036 0.121 0.036–0.6
97.88 0.1108 0.243 0.809 0.243–4.0
Analyst, September 1997, Vol. 122
10
Table 3 Study of phytohormone recoveries in synthetic mixtures Concentration added/mg ml21
Concentration found/mg ml21
11 Recovery (%)
NAD
NOA
NAD
NOA
NAD
NOA
0.30 0.30 0.15 0.45 0.45
2.00 1.00 1.00 2.00 1.00
0.263 0.273 0.141 0.341 0.425
2.05 1.90 1.03 2.34 1.06
87.7 91.0 94.2 75.8 94.5
102.4 94.5 102.9 116.9 106.1
12 13 14 15 16
Applications A soil sample from G´ojar village (Granada, Spain) was spiked with NAD and NOA by adding appropriate volumes of a standard solution. Different recovery experiments were performed on the spiked soil samples. Samples of soil containing 30 mg ml21 of NAD and 2 mg ml21 of NOA were analysed. Mean values of 89.0% (n = 5) for NAD and 103.5% (n = 5) for NOA, with RSDs of 7.35% and 5.90%, respectively, were obtained. References 1 2 3 4 5 6 7 8 9
Lloyd, J. B. F., Nature (London), 1971, 231, 64. Kubic, T. A., Kanabrocki, T., and Dwyer, J., paper presented at the 32nd Annual Congress of the American Academy of Forensic Sciences, 1980. Miller, J. N., Analyst, 1984, 109, 191. Garc´ıa S´anchez, F., Ramos Rubio, A. L., Cerd´a, V., and Oms, M. T., Anal. Chim. Acta, 1990, 228, 293. Clark, B. F., Frei, A. F., Milne, K. T., Pattle, D. M. G., and Williams, M. H., Anal. Chim. Acta, 1985, 170, 35. Cabaniss, S. E., Anal. Chem., 1991, 63, 1323. Clark, B. J., Fell, A. F., Aitchison, I. E., Pattie, D. M. G., Williams, M. H., and Miller, J. N., Spectrochim. Acta, Part B, 1983, 38, 61. Om, M. T., Cerd´a, V., Garc´ıa S´anchez, F., and Ramos Rubio, A. L., Talanta, 1988, 35, 671. Garc´ıa S´anchez, F., Ramos Rubio, A. L., Cerd´a, V., and Oms, M. T., Talanta, 1988, 35, 335.
17 18 19 20 21 22 23 24 25 26 27 28 29 30
929
Clark, B. J., Fell, A. F. Milne, K. T., Pattie, D. G., and Williams, H., Anal. Chim. Acta, 1985, 170, 35. Oms, M. T., Forteza, R., Cerd´a, V., Maspoch, S., Coello, J., and Blanco, M., Anal. Chim. Acta, 1990, 233, 159. Lee, Y. Q., Huang, X. Z., Xu, J. G., and Chen, G. Z., Chin. Chem. Lett., 1991, 2, 23. Li, Y., Huang, X., Xu, J., and Chen, G., Fenxi Huaxue, 1991, 19, 538. Li, Y., Cai, D., Huang, X., and Xu, J., Fenxi Huaxue, 1993, 21, 1420. Li, Y. Q., Huang, X. Z., Xu, J. G., and Chen, G. Z., Talanta, 1994, 41, 695. Garc´ıa S´anchez, F., Fern´andez Guti´errez, A., and Cruces Blanco, C., Anal. Chim. Acta, 1995, 306, 313. Capit´an-Vallvey, L. F., del Olmo, M., Avidad, R., Navaln, A., de Orbe, I., and V´ılchez, J. L., Anal. Chim. Acta, 1995, 302, 193. Garc´ıa S´anchez, F., Cedazo, M., Lovillo, J., and Navas D´ıaz, A., Talanta, 1996, 43, 1377. Segura Carretero, A., Cruces Blanco, C., and Fern´andez Guti´errez, A., Anal. Chim. Acta, 1996, 329, 165. Cochrane, W. P., Lanouette, M., and Grant, R. J., J. Assoc. Off. Anal. Chem., 1988, 63, 145. Garc´ıa S´anchez, F., and Cruces Blanco, C., Quim. Anal., 1988, 7, 299. Sanders, L. B., and Winefordner, J. D., J. Agric. Food Chem., 1972, 20, 166. Trautwein, N. L., and Guyon, J. C., Mikrochim. Acta, 1979, 1, 413. Aaron, J. J., Kaleel, E. M., and Winefordner, J. D., J. Agric. Food Chem., 1979, 27, 1233. Roth, M., J. Chromatogr., 1967, 30, 276. Aaron, J. J., and Winefordner, J. D., Analusis, 1979, 7, 168. Segura Carretero, A., Cruces Blanco, C., and Fern´andez Guti´errez, A., Talanta, 1996, 43, 1001. Mu˜noz de la Pe˜na, A., and Dur´an-Mer´as, I., Talanta, 1993, 40, 1657. Box, G. E. P., Hunter, W. G., and Hunter, J. S., Statistics for Experiments, Wiley, New York, 1978, ch. 15. Cuadros Rodr´ıguez, L., Garc´ıa Campa˜na, A. M., Jim´enez Linares, C., and Rom´an Ceba, M., Anal. Lett., 1993, 26, 1243.
Paper 7/00591A Received January 27, 1997 Accepted May 15, 1997