Application of Graph-based Data Mining to Metabolic Pathways. Chang Hun You, Lawrence B. Holder, Diane J. Cook. School of Electrical Engineering and ...
Application of Graph-based Data Mining to Metabolic Pathways Chang Hun You, Lawrence B. Holder, Diane J. Cook School of Electrical Engineering and Computer Science Washington State University Pullman, WA 99164-2752 Email: {changhun, holder, cook}@eecs.wsu.edu
Abstract We present a method for finding biologically meaningful patterns on metabolic pathways using the SUBDUE graph-based relational learning system. A huge amount of biological data that has been generated by long-term research encourages us to move our focus to a systems-level understanding of bio-systems. A biological network, containing various biomolecules and their relationships, is a fundamental way to describe bio-systems. Multi-relational data mining finds the relational patterns in both the entity attributes and relations in the data. A graph consisting of vertices and edges between these vertices is a natural data structure to represent biological networks. This paper presents a graph representation of metabolic pathways to contain all features, and describes the application of graph-based relational learning algorithms in both supervised and unsupervised scenarios. Supervised learning finds the unique substructures in a specific type of pathway, which help us understand better how pathways differ. Unsupervised learning shows hierarchical clusters that describe the common substructures in a specific type of pathway, which allow us to better understand the common features in pathways.
1 Introduction After the identification of the double helix, many biologists have pursued the origin of life. With advances in computer science, bioinformatics plays a central role in solving this fundamental problem. Bioinformatics has been focused on molecular-level research until now. Genomics and proteomics, main areas in molecular-level research, have studied the function and structure of macro molecules in organisms, and produced a huge amount of results. However, proteins and genes can play their roles only in harmony with the whole cytoplasmic environment. Molecular-level understanding is definitely a fundamental step, but it is not
the final step. A biological organism is a system which is not just composed of various objects, but also has dynamic and interactive relationships between them. A systems-level understanding is a more efficient way to solve the problem [6]. A biological network is a fundamental way to define a complex biological system in terms of both the structure and its dynamics. Identification of biological networks is an initial and fundamental step in systems biology. Biological networks consist of biological objects and their relationships. For a long time, molecular biologists have been focused on identification of the patterns, such as domain or motif, in protein or gene molecules. These molecules have many kinds of atoms and relationships between them. The identified substructures (patterns) in these molecules have been efficiently used to study the structures and predict unrecognized molecules. The patterns in biological networks are also important to understand the system. The different aspect in the structure of biological networks is that relationships are more various than ones of the molecular structures. Relationships in biological networks include chemical reactions, enzyme activities and signal transductions. The patterns of these relationships provide better understanding of biological networks and systems. A pattern can be the most important feature to distinguish a network from another, or a pattern can be the common property to group several networks. And also this pattern can be used as a rule to construct a new biological network. Graph-based approaches, as subfields of multi-relational data mining, are applied to mine patterns in biological networks [7, 4]. A graph has been widely used to represent a variety of relational data such as computer networks, social networks, and biological data. A biological network is another appropriate field to be represented as a graph. Graphbased data mining can be applied to find the meaningful patterns in the biological network which is represented as a graph. In this paper, we introduce the SUBDUE graph-based relational learning system [9] and KEGG PATHWAY
database [5]. We then show the application of SUBDUE to metabolic pathways which are downloaded from the KEGG PATHWAY database and represented as a graph. The goal of this research is to show the substructures learned by SUBDUE have understandable biological meaning. These substructures can be considered as building blocks of metabolic pathways. Supervised learning shows that the learned substructures can identify what is unique about a specific type of pathway, which allows us to understand better how pathways differ. Unsupervised learning generates hierarchical clusters that show what is common about a specific type of pathway, which provides us better understanding of the common structure in pathways. Ultimately, we could consider these blocks as guides to define a graph grammar for metabolic pathways that would improve both our ability to build new networks and our understanding of pathways.
2 Graph-based Approach on Pathways Our approach in this research is processed in three phases. As a preprocessing phase, we generate our graph representation using the KGML data from the KEGG PATHWAY database [8]. Then we apply the SUBDUE graph-based relational learning system to data in the manner of supervised and unsupervised learning. Finally, we verify the learned substructures using the linked database of KEGG.
2.1
Graph-based Relational Learning
Graph-based relational learning is focused on finding novel and meaningful, but not necessarily most frequent, substructures in a graph representation of data. We use the SUBDUE graph-based relational learning system to discover patterns which not only abstract instances of the patterns by compression, but also provide better understanding of the data [1]. SUBDUE can perform unsupervised learning and supervised learning by substructure discovery guided by the Minimum Description Length (MDL) heuristic [2]. Using background knowledge given as predefined substructures can guide graph-based relational learning to find more meaningful substructures. SUBDUE has been applied to a variety of areas such as Chemical Toxicity, Molecular Biology, Security and Web Search.
2.2
KEGG database
The KEGG PATHWAY is a widely known database which contains information on various kinds of pathways including pathway image files [5]. The KEGG PATHWAY includes several linked databases which have various information about bio-molecules and reactions on metabolic
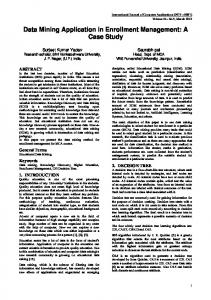
Figure 1: A graph representation of a metabolic pathway pathways. It also uses the KGML (KEGG Markup Language) as an exchange format for KEGG metabolic pathways, based on XML [8]. KGML data are are converted to graphs for SUBDUE. Linked databases of the KEGG PATHWAY database are also used to identify biological meaning of the final pattern. The ultimate goal of this exploration is to show that the substructure found by SUBDUE is biologically important and meaningful.
2.3
The Graph Representation
In figure 1, our graph representation has three generic vertices (Entry, Relation and Reaction), rather than just their specific names because we would like to show the systematic view, like a Relation between two Entries (gene or protein), or a Reaction between two Entries (compound) catalyzed by another Entry (enzyme). Each generic vertex has its own satellite vertices to describe its properties.
3 Results and discussion Our goal is the application of the SUBDUE graph-based relational learning system to the KEGG metabolic pathways to find better understanding and biologically meaningful substructures. These substructures can distinguish two pathways, or provide the common features in several pathways.
3.1
Supervised Learning
The main goal of supervised learning is to find the best substructures to distinguish between a metabolic pathway in a species group and a different pathway in the same group. This task provides us the unique substructures in the specific type of pathways to understand better how pathways differ. The distinguishing patterns of relationships between molecules, under few consideration of the feature of each molecule, can also play an important role in Systems Biology with the molecular-level research.
Table 1: Results of supervised learning
Graphs of metabolic pathways are divided into two example sets: positive and negative. SUBDUE searches for patterns which exist only in positive examples, but not in negative examples. The discovery algorithm uses the setcover approach and it is iterated for the number of positive examples. 3.1.1 Classification Results Supervised learning tries to find substructures which exist in the positive examples, but not in the negative examples. The choice of which examples are positive and which are negative might affect the classification result. Since our goal is the better classification between two groups, we run two cases. First (A+), we make a positive example set and a negative example set. For the second (B+), we swap the two sets. We use a convention A(+) B():src when we denote each experimental case. For example, 00300(+) 00310(-):euk represent A+ case of the 00300 00310:euk experiment. Table 1 shows the experimental sets and results for supervised learning. The first column shows the name of the set which consists of three parts: A, B and source group. A and B represent two groups of pathways [8], and the source group represents the species set. The Eukaryote (euk) set consists of all eukaryote species (17) in the KEGG PATHWAY database. The 45 set has 45 species, and the 150 set has 150 species. The second column provides the number of pathways in each group. This number is less than or equal to the number of each source set, since the metabolic pathway may not yet be constructed (or not presented) in the specific species. For example all 17 species of the eukaryote cell have the 00010 pathway. But, Encephalitozoon cuniculi (fungi) and Danio rerio (Zebra fish) do not have the
00061 pathway. The third column shows the total size of the graphs, which is calculated as size(G) = |V | + |E|, where a graph G = (V, E), V is the set of vertices and E is set of edges. The last two columns show the maximum running time and accuracy in each set. We present the classification accuracy and running time as the maximum values of A+ and B+ in each experimental set. The maximum accuracy expresses the best case of the classification and the maximum running time represents the worst case of the running time. It is computed in terms of accuracy on the training set. Each case shows a different result in terms of running time and accuracy, depending on what are used as the positive examples. The average accuracy of all experiments consisting of A+ and B+ is 71.76%. The average of maximum accuracy is 82.3%. Supervised SUBDUE can distinguish well between two different types of pathways with more than 60% accuracy (17 sets out of 20) in polynomial running time. 3.1.2 Verification of the substructures The goal of supervised learning is to find the patterns which are not only able to distinguish between two sets of examples, but are also biologically meaningful. The pattern found by SUBDUE can differentiate well between two examples. The pattern exists only in positive examples, not in negative examples, because of biologically indispensable reason. We try to verify biological meaning of these patterns by using the linked database of KEGG PATHWAY [8]. Figure 4 shows a substructure of Aquifex aeolicus bacteria in 00010(+) 00900(-):45 experiment set. The partial pattern composed of vertices and edges marked by “[ ]” is found commonly in 40 instances of 40 examples in the first iteration of the 00010(+) 00900(-):45 experiment. This common substructure which covers 90.9% of the positive examples (40 out of 44) is shown as related to two reactions. This pattern shows that an enzyme catalyzes two reactions, which share the same substrate and product. Generally, an enzyme catalyzes a reaction, but some enzymes can be related to two or more reactions. In figure 3, two reactions vertices are connected to an entry (enzyme) vertex by an E to Rct edge, which is linked to a gene as its type. The two reactions include the shared substrate (linked by a S to Rct edge) and product (linked by a Rct to P edge). The gene aae:aq 1065 represents the enzyme ec:1.2.1.12. This enzyme catalyzes two reactions, R01061 and R01063, which are oxidoreductase reactions of N AD+ and N ADP + . These two coenzymes are working as carriers of hydrogen atoms and electrons in some oxidation-reduction reactions, especially ATP (Adenosine TriPhosphate: energy material) related reactions. In our experiment, the learned substructure is found only in the positive examples (Glycolysis), not in the negative examples
Figure 2: The first best pattern from supervised learning on 00010(+) 00900(-):45 set, drawn using GraphViz [3] 3.2.1 Clustering Results
Figure 3: Partial Hierarchical Clusters of metabolic pathways in fruit fly, drawn using GraphViz [3]
(Terpenoid biosynthesis). Glycolysis is an energy generating process which degrades a molecule of glucose in a series of enzyme-catalyzed reactions to yield two molecules of the Pyruvates and ATPs. By this conclusion of verification, the substructure found by SUBDUE can distinguish between two metabolic pathways and has an understandable biological meaning.
3.2
Unsupervised Learning
Unsupervised learning tries to find common substructures in the different pathways of one species. The ultimate purpose of applying clustering to metabolic pathways is to provide a better understandable blueprint of metabolic pathways by using hierarchical topologies. This experiment allows us to understand the common structures of different pathways. The common patterns of relationships in metabolic pathways can contribute to biological network research in accompany with traditional bioinformatics.
Seven experiment sets are used in unsupervised learning. Each set includes all metabolic pathways of a species in KEGG PATHWAY database (excluding gene regulatory networks). The smallest number of pathways is 86 in sce (Saccharomyces cerevisiae). The largest number is 110 in hsa (Home Sapiens). The range of graph size is 58,166 ∼ 90,157 and the range of running time is 267.81 ∼ 598.99 seconds. The aim of unsupervised learning is to find the common substructures, which describe the regular features in a group of metabolic pathways. Partial hierarchical clusters of substructures learned from the dme (fruit fly) set are shown in figure 3. The hierarchical clusters show that the substructures at the upper level are contained in the lower level. Namely, the general patterns are used to compose more specific patterns, and finally the pathway. This is how SUBDUE shows the common relational patterns of the pathway and how the patterns relate to each other hierarchically. SUB 1 represents a reaction that is found in 972 instances of 90 examples. SUB 3 is found in 3,659 instances of 47 examples at the third iteration. SUB 4, found in 1,136 instances of 21 examples, represents a relation with the ECrel property. The ECrel relation is an enzyme-enzyme relation where two enzymes catalyze successive reaction steps [8]. SUB 8 consists of two SUB 1s, a SUB 3 and a SUB 4 with several edges. This substructure, found in 264 instances of 3 examples, contains one relation of two enzymes which catalyze two successive reactions. Moreover, SUB 8 has one more meaning than SUB 4. The key is the “link” edge which connects to a compound which is a product of the first reaction of this relation and a substrate of the second reaction at the same time [8]. In fact, SUB 1 should be found in all examples, because it represents a basic biochemical reaction. However, it is found in only 90 examples out of 92, because KEGG PATHWAY is missing reactions in the dme00193 and dme00531 metabolic pathways. SUBDUE finds SUB 8 in three metabolic pathways of fruit fly. This pattern, an enzyme-enzyme relation which relates three successive chemical compounds, is not only the com-
Figure 4: The eighth substructure of figure 3 found in Galactose metabolic pathway , drawn using GraphViz [3] mon relational pattern in these three metabolic pathways, but also the distinguishing property from other pathways. 3.2.2 Verification of the substructures Figure 4 shows a specific example of the SUB 8 found in the dme00052, Galactose metabolic pathway. As before, the nodes and edges with “[ ]” are commonly found in other pathways. The enzyme-enzyme relation has a relationship with two reactions: R01092 and R01105 [8]. R01092 is catalyzed by the enzyme of the gene dme:CG5288-PA, and R01105 is catalyzed by the enzyme of the gene dme:CG9092-PA. The substrate of R01092 is the C05796 compound (Galactin). The product of this reaction is C00124 (D-Galactose), which is also the substrate of R01092. R01092 produces C00446 (alpha-D-Galactose 1-phosphate) as the product compound. The relation in this substructure has the link as a pointer to C00124, because this compound is the shared metabolite in two reactions catalyzed by two enzymes connected within this relationship. This substructure shows a relation between two enzymes which shares a compound, as a substrate by one and a product by another.
4 Conclusion Unlike traditional bioinformatics research, we are focused on the relationships between molecules, more than the molecules themselves. There are a variety of biological molecules in the biological networks, and they are related to each other as several kinds of forms. The research on the relationships, as well as molecular-level research, can play a contributive role in Systems Biology. Our results show that the substructures learned by SUBDUE have understandable biological meaning and, when considered as building blocks of metabolic pathways, can be used to help us construct new pathways. In the supervised learning scenario the learned substructures can identify what is unique about a specific type of pathway, which allows us to understand better how pathways differ. Unsu-
pervised learning generates hierarchical clusters that show what is common about a specific type of pathway, which provides better understanding of the common structure in pathways. Ultimately, we could think of these blocks as guides to define a graph grammar for metabolic pathways that would improve both our ability to build new networks and our understanding of pathways. They also open our sights to a new application. They can help us identify the target place of a drug in metabolic pathways. Additionally, a graph grammar of building blocks will help to simulate the drug interaction on metabolic pathways. Future works include research on advanced graph representation and a graph grammar of metabolic pathways. Ultimately, graph-based relational learning on a graph which can represent dynamics as well as static structures of metabolic pathways will enable us to find more efficient methods for drug discovery.
References [1] D. J. Cook and L. B. Holder. Substructure discovery using minimum description length and background knowledge. Journal of Artificial Intelligence Research, 1:231–255, 1994. [2] D. J. Cook and L. B. Holder. Graph-based data mining. IEEE Intelligent Systems, 15(2):32–41, 2000. [3] E. Gansner, E. Koutsofios, and S. North. Drawing Graphs with dot. AT&T Bell Labs, February 2002. [4] H. Hu, X. Yan, Y. Huang, J. Han, and X. J. Zhou. Mining coherent dense subgraphs across massive biological networks for functional discovery. Bioinformatics, 21(1):213– 221, 2005. [5] M. Kanehisa, S. Goto, S. Kawashima, U. Okuno, and M. Hattori. KEGG resource for deciphering the genome. Nucleic Acids Research, 32:277–280, 2004. [6] H. Kitano. Systems biology: A brief overview. Science, 295:1662–1664, 2002. [7] M. Koyuturk, A. Grama, and W. Szpankowski. An efficient algorithm for detecting frequent subgraphs in biological networks. Proceedings of the International Conference on Intelligent Systems for Molecular Biology, 20:200–207, 2004. [8] KEGG website. http://www.kegg.com. [9] SUBDUE website. http://www.subdue.org.