Application Performance Modeling in a Virtualized Environment Sajib Kundu† Raju Rangaswami† Kaushik Dutta‡ Ming Zhao† † School of Computing & Information Sciences ‡ College of Business Administration Florida International University {skund001, raju}@cs.fiu.edu
[email protected] [email protected]
Abstract Performance models provide the ability to predict application performance for a given set of hardware resources and are used for capacity planning and resource management. Traditional performance models assume the availability of dedicated hardware for the application. With growing application deployment on virtualized hardware, hardware resources are increasingly shared across multiple virtual machines. In this paper, we build performance models for applications in virtualized environments. We identify a key set of virtualization architecture independent parameters that influence application performance for a diverse and representative set of applications. We explore several conventional modeling techniques and evaluate their effectiveness in modeling application performance in a virtualized environment. We propose an iterative model training technique based on artificial neural networks which is found to be accurate across a range of applications. The proposed approach is implemented as a prototype in Xen-based virtual machine environments and evaluated for accuracy, sensitivity to the training process, and overhead. Median modeling error in the range 1.16-6.65% across a diverse application set and low modeling overhead suggest the suitability of our approach in production virtualized environments.
1. Introduction Accurately predicting application performance for a given set of resources aids in effective management of high performance IT infrastructure by enabling optimized resource allocation. The importance of correctly modeling application performance behavior is pronounced in virtualized data centers, where multiple applications share the same physical resources (host resources), sand-boxed within virtual machines (VMs). Incorrect resource allocation to a specific VM has the potential to affect not just the target VM but any or all of the other VMs running on the same host. A common practice in VM resource allocation involves
over-provisioning of resources to reduce the probability of target SLA (Service Level Agreement) violations. Such practice has shortcomings. First, over-provisioning leads to underutilized resources which inflates the IT budget. When the objective is to maximize SLA-based revenue for the data center, over-provisioning resources for a VM may degrade the SLA-based revenue otherwise obtainable by other VMs that share host resources. Second, complex relationships governing resource usage within a single VM invalidates simple over-provisioning based on resource consumption characteristics. For instance, an increase in CPU utilization may not be due to inadequate CPU allocation, but due to inadequately provisioned memory leading to frequent CPUintensive garbage collection, while an increase in disk bandwidth utilization may be due to paging I/O resulting from inadequately provisioned memory. Third, complex relationships governing resource usage across the VMs sharing a physical host increase the variance in application behavior at a given resource configuration. Resources such as (disk and network) I/O bandwidth are not strictly partitionable either because of the nature of the underlying hardware resource and/or the limitations of current solutions for resource partitioning; consequently, provisioning such resources is not strictly feasible and contention may lead to unexpected performance change. We argue that it is feasible to implement near-optimal resource provisioning in future high-performance virtualized data centers based on the ability to predict a virtualized application’s performance at a given allocation level of partitionable resources and an observed competition level of non-partitionable resources. Several challenges need addressing in developing such a solution. The first challenge is the identification of the parameters of a virtualized system that can affect the performance of a virtualized application at the right level of abstraction and which are sufficient to predict application behavior with high accuracy. The second challenge is to identify techniques for either observing or controlling these parameters in a virtualized environment. The third challenge is in building a performance model for a virtualized application based on the
above parameters that can accommodate the complexity of both intra-VM and inter-VM resource usage dynamics. The contributions of this work are three-fold. First, we identify key system parameters that influence application performance in a virtualized environment and demonstrate that these are sufficient to create accurate performance models. These parameters are sufficiently high-level to facilitate easy comprehension and reasoning by data center system administrators. Second, we provide insight into the complexities of application behavior in a virtualized environment that are distinct from those in non-virtualized environments. Relatedly, we evaluate a number of techniques for modeling application performance in a virtualized environment and isolate a specific artificial neural network (ANN [19]) based model as both superior and adequate. Third, we experimentally evaluate our approach in a Xen [5] based virtual machine environment for a set of benchmark applications representing various application classes such as memory intensive, I/O intensive, CPU intensive, and a combination of the above. We demonstrate that our approach can make predictions with a median error ranging from 1.16-6.65% across these application classes. The rest of this paper is organized as follows. In Section 2 we provide the context for our work. Section 3 identifies generic and Xen-specific model parameters. Modeling techniques are evaluated in Section 4. A detailed experimental analysis of an ANN-based model is presented in Section 5. We discuss related work in Section 6 and conclude with directions for future work in Section 7.
2. Background System-level virtualization [2, 5, 22] is becoming increasingly popular at data centers because it enables resource sharing while ensuring an almost strict partitioning of physical resources across several applications running on a single host. However, running a virtualized data center at high efficiency is a non-trivial task. Within each physical host, the virtual machine monitor controls the allocation of physical resources to individual VMs. A change in the resource demand of an application (e.g., due to an upgrade to its code-base, change in load, configuration changes, etc.) may require reconfiguring one or more VM allocations to maximize the performance and SLA-based data center revenue. Today, these decisions are made manually based on the administrator’s experience and limited knowledge about the application performance based on staging runs. Future virtualized data centers are likely to automate the process of dynamic resource reallocation to the VMs both within and across physical hosts [7, 23]. A key capability for automated resource reallocation in either context is the ability to predict application performance at any time for a given allocation of VM resources and a given level of resource competition from other VMs. Consequently,
Figure 1. Overview of approach. in this work, we investigate automated techniques to accurately model the performance of a virtualized application which can then be used within either manual or automated mechanisms for resource reallocation. Figure 1 depicts a generic architecture for a virtualized host in such a setting. The virtual machine monitor is responsible for allocating basic resources such as CPU cycles, memory capacity, and disk and network I/O bandwidth. At a high level, allocating a specific share of physical resources to a VM results in a specific performance that is measurable using application-specific performance metrics such as response time and/or throughput. The input to our target model is a set of parameters that can either be observed or controlled easily by system administrator and can be used to achieve a target performance for the virtualized applications in a dynamic environment where resource consumption characteristics or target SLA deliverables of any application are subject to change. Since application resource usage characteristics may gradually change over time, the model must be updated online as new sets of observations are made, reflecting the changes in the system state and application behavior. Further, when VMs are migrated from one host to another, the model of an application running in the VM of host A can be applied to model the same application running in host B, provided host hardware configurations are the same. Alternatively, apriori model training across all possible deployment targets may be considered, or an entirely new model could be constructed from scratch on host B post-deployment following the same principles as used to construct the original model on host A. Finally, for distributed and multi-tier applications, this approach can be extended by modeling each component of the application – storage servers, database servers, application servers – separately, making this approach generically applicable in a variety of real-world data center environments.
3. Parameter Selection Identifying the ideal set of performance-influencing parameters for a VM requires addressing the following concerns. First, the parameters must either directly map to or indirectly reflect known resource usage behavior of processes, and they must be easy to control and/or observe. This will allow system administrators to intuitively use such
parameters. Second, the application behavior within a single VM may depend on the nature of activity in other VMs and the influence of such competition must be accounted for and characterized accurately. For example, an I/O intensive application running in one VM may affect the I/O operations of an application running in another VM. The third challenge is identifying the minimum set of model parameters that efficiently captures application performance with high-accuracy and are yet application-independent. We take a minimalistic approach to parameter selection by starting from known, high-level, system resources that can directly impact application performance including CPU, memory, and disk and network I/O bandwidths. For each target resource of interest, we reason about the controllability of candidate parameters, account for possible influence of competition on consumption of the resource, and discuss generalizability to virtualization architecture alternatives. Although not considered in this paper, it is conceivable that processor cache resource can be also incorporated as an additional parameter, either by controlling the cache allocation (if it is partitionable) across VMs or by taking into account the influence of cache contention between VMs via hardware performance counters. In this work, we assume that other system resource properties such processor architecture and operating system design remain invariant. We use Xen-specific paravirtualization architecture to both develop and evaluate our approach to modeling application performance in a virtualized environment. In this architecture, the host consists of an I/O driver domain (dom-0) VM through which all disk and network I/O from user domain (dom-U) VMs is routed. Adequate CPU and memory must be allocated to dom-0 to avoid I/O performance degradation. For each of the generic parameters we identify, we also provide a Xen-specific instantiation. 3.1
CPU Usage
The common practice in modeling CPU usage by an application is establishing a correlation between the average or peak CPU utilization of an application and its observed performance [10, 20, 21, 25]. These models have been used for application placement to predict running times of applications [10], to predict CPU utilization at different application load levels for capacity planning purposes [21], for cross-platform performance prediction [20], and for mapping resource usage of an application running natively to that when the application runs within a VM [25]. Since a primary goal for performance modeling in our case is to provide tunable knobs to the system administrator for controlling performance, the commonly used CPU utilization, an observable (rather than controllable) parameter, is ill-suited. Moreover, forcing the application to specific CPU utilization levels is necessary to create a model that predicts performance based on CPU utilization and requires
changing application load levels, thus requiring knowledge of application semantics. Instead, we choose the percentage CPU allocation which merely imposes an upper limit on CPU utilization, and is a basic control parameter across all virtualization architectures and solutions. This parameter can be directly utilized by a data center system administrator to determine the expected application performance for a given CPU resource allocation. Strictly bounding allocations may however lead to transitory non-work-conserving CPU behavior as resource utilization characteristics of the application change; the under-utilization of resources can be addressed with an online performance model updating mechanism as discussed in Section 2. Xen-specific instantiation. By default, Xen uses a credit scheduler for time-sharing CPU cycles across the VMs, including the dom-0 VM. We instantiate the CPU allocation generic parameter as the Xen-specific CAP parameter which places a upper bound on a VM’s CPU usage and can be changed dynamically from within dom-0 at run-time. 3.2
Memory Usage
The use of memory utilization for modeling application performance has been explored before [21]. In a virtualized environment, besides sharing the same drawbacks as CPU utilization when used as a control knob, the memory utilization metric also incorrectly characterizes an unused portions of the file system page cache as part of the memory utilization of a VM which gets attributed to the resident application; application performance and its memory utilization can change substantially while the VM memory utilization remains constant, and vice-versa. Virtualization allows the VMs sharing the host physical memory to have their own isolated memory allocation. Following the rationale for the CPU resource parameter, we choose the the VM memory allocation for the VM as our model parameter. This parameter provides a control knob that is available across all virtualization solutions. Xen-specific instantiation. Changing memory allocation for a VM is very straightforward in Xen. These memory allocation limits are strictly enforced by the virtual machine monitor. The xm mem-set command can be issued from dom-0 to change the memory allocation of a VM dynamically, allowing full control over dynamic memory repartitioning across VMs as needed. Thus, we instantiate the memory allocation generic parameter as the Xen-specific mem-set alloc (MEM) parameter. 3.3
Disk I/O Bandwidth Usage
Enforcing control over allocation of disk I/O bandwidth is not straightforward. Currently there are no widely available mechanisms for strictly partitioning I/O bandwidth across multiple VMs. Most virtualization solutions provide a mechanism to prioritize I/O requests from different VMs at the level of I/O scheduler which directly impacts the I/O
performance. Consequently, we incorporate disk I/O priority as a parameter for modeling the influence of disk I/O bandwidth availability. However, relative prioritization alone is insufficient to model the influence of disk I/O resource on application performance which ultimately depends on the disk I/O bandwidth actually made available to the application VM. The contending I/O volume due to concurrently running VMs on the same host has a direct influence on the resource availability, especially in case of shared storage. To address this issue, we include an additional parameter to the model, the competing disk IOPS (I/O Operations Per Second) from other virtual machines on the same host. Though this is not a controllable parameter, it is an exogenous parameter that can easily be observed and used as an input to the model to represent the current condition of the VM environment. Xen-specific instantiation. In Xen, all disk I/O for a particular VM is attributed to its corresponding blkback process running inside dom-0. Ionice values can be assigned to blkback processes to adjust their relative priorities in disk I/O scheduling. Thus, the disk I/O priority generic parameter is instantiated as the Xen-specific IONICE parameter for each driver domain blkback process. I/O operations from all VMs can be conveniently measured using the xentop tool, which provides cumulative statistics of total number of read and write requests separately from each domain. Thus, the competing disk IOPS generic parameter is instantiated as the Xen-specific competing disk I/O operations per second (CDIOPS) parameter. 3.4
Network I/O Bandwidth Usage
There are substantial similarities in resource consumption across the disk and network I/O dimensions in both non-virtualized and virtualized systems. Similarly to disk I/O bandwidth resource modeling, we model network I/O bandwidth resource usage with network I/O priority and competing network IOPS. Similarly to disk I/O priorities, controlling relative network I/O priorities across VMs is readily available in common virtualization solutions. The competing network IOPS is an easily observable parameter in common virtualization solutions. Xen-specific instantiation. Similarly to the blkback process, there is a netback process running inside dom-0 and associated with each VM which handles network I/O for the VM. The network I/O priority generic parameter can be instantiated as the Xen-specific CPU-nice parameter for each driver domain netback process. Network I/O competition from VMs can be also measured using xentop, which provides statistics for transmit as well as receive traffic separately for each VM. The competing network IOPS can be instantiated as the Xen-specific competing network bytes per second (CNBPS) parameter.
4. Modeling Virtualized Applications In this section, we examine the behavior of several benchmark applications in a virtualized environment and evaluate common modeling techniques on their ability to adequately capture the subtleties of behavior for each. 4.1. Benchmark Applications We start by examining the subtleties in the behavior of several benchmark applications under varied resource configurations (varying the model parameter values) of a virtualized system. The benchmark applications are chosen as a representative set to address the various resource consumption characteristics across applications in general. Configurable parameters are those identified for Xen in the previous section, excluding the network related parameters. CPU-intensive benchmark We chose the CPU intensive benchmark from the SysBench [4] package which consists of configurable number of events that compute prime numbers from 1 to N (user-specified). The benchmark reports the average event handling time which we used as the performance metric. This seemingly simple benchmark showed interesting characteristics as the system configuration was changed. First, as expected, the response time reduced as the CAP was increased, almost proportionately. Second, the response time also decreased with increased CDIOPS, an unexpected outcome that we verified several times. However, on a different hardware platform, this anomaly was not observed. It is likely that the anomalous behavior on the first platform is due to cache contention, which unfortunately we could not verify due to incompatibility of the Xen-kernel with host hardware performance counters. Third, we observed a notable impact of IONICE and MEM on response time but with no apparent trends. Memory-intensive benchmark We created a microbenchmark that allocates a large array in memory and continuously writes to random elements of that array. The application performs a fixed number of operations (user-specified) and reports memory-operations-per-second (MOPS). A 1 GB sized file in dom-0 was configured as the SWAP virtual block device of the benchmark’s VM. Interesting behaviors emerged as we varied configuration parameters for this micro-benchmark. First, as memory allocation (MEM) was reduced, initially MOPS remained constant as long as the array could fit entirely in the VMs physical memory. However, as MEM was reduced further, MOPS reduced super-linearly, a consequence of the large I/O latencies incurred due to demand paging. Second, the benchmark’s dependence on the CDIOPS was non-linear - from low to medium levels of competing disk I/O the MOPS was constant, but from medium to high levels, MOPS decreased substantially. Third, IONICE affected MOPS notably, with no obvious trend. Finally, as expected, MOPS was found to
increase with an increase in CAP. IO benchmark - Postmark PostMark [13] is a disk I/O intensive benchmark which models e-mail systems, electronic news, and e-commerce systems. It creates a number of files and performs append, create, delete, and truncate operations on the pool of files. The benchmark reports Transactions Per Second (TPS) as the performance metric. We configured the benchmark to create a data set of size 1.5 GB and perform 10000 transactions. The behavior of this benchmark turned out to be quite predictable across all parameter dimensions. First, as expected, TPS decreased with increased CDIOPS. Second, TPS was greatly influenced by MEM since Postmark is a meta-data intensive workload and is therefore sensitive to the size of the in-memory file system page cache. Third, TPS decreased with increased IONICE (reduced priority). Fourth, CAP had little to no impact on TPS. Most importantly, a linear dependence was observed for each of the above parameters. OLTP benchmark We used the online transaction processing (OLTP) benchmark of SysBench [4] suite with a MySQL-based database setup. This benchmark utilizes all the three types of resources intensively. We created a table size of 2GB and configured the benchmark to perform 10000 database transactions. The benchmark reports the transactions-per-second (TPS) as the performance metric. This benchmark was quite complex in its behavior. First, it was memory-dependent; while the TPS increased with an increase in MEM, the dependence was non-linear. Second, TPS was found to be inversely proportional to CDIOPS, but the influence was nominal. Third, the dependence on CAP was peculiar; as CAP was increased, TPS increased but beyond a certain point, it started degrading. We attribute this behavior to the split-driver architecture of Xen. If the CAP of the target VM is increased beyond certain value, the available CPU for dom 0 reduces with a negative impact on the target VM’s I/O performance. Finally, quite unexpectedly, varying IONICE was found to have no significant effect on the TPS. While we found this behavior consistent, we could not find any reasonable explanation, another instance of complex application behavior when virtualized. 4.2. Model Training Procedure Training models adequately is a key step in the modeling process which can significantly influence the accuracy of the models. We now describe the model training procedure (Figure 2 ) which is uniformly applied to all the modeling techniques that we examine. For each modeling technique explored, we start with a boot-strapping step that identifies the set of boundary parameter configurations for initial benchmark runs. The boot-strapping requires input from the system administrator to identify the best-case and worst-case resource allocation deemed feasible across each resource dimension for
Figure 2. Flowchart for Iterative Model Training. the benchmark. Given these boundary allocations, the bootstrapping step identifies a range for the application performance metric (henceforth simply referred to as output parameter) for each benchmark application. The upper/lower boundary of output parameter value range for an application is obtained by allocating the highest/lowest values of MEM and CAP and the lowest/highest values of IONICE and CDIOPS as specified by the system administrator. The next step identifies the set of training data for the model. We use an iterative process that examines the incremental improvement in modeling accuracy as the training set is augmented with data points gradually and systematically. This process starts by choosing the input parameter values at the boundaries and a configurable number (we used 1) of additional points equally-separated from each other and the boundary points. All possible combinations of the chosen input parameter values are then used for benchmark runs. This set of input and output data forms the initial training set which may be subsequently refined. Additional input parameter values are chosen randomly to conduct benchmark runs and populate the testing data set. The subsequent iterative model training procedure is summarized in Figure 2. After each model training step, the testing set data is used to measure the prediction accuracy of the model. A∗ denotes the administrator’s desired prediction accuracy and Ai denotes prediction accuracy at iteration i. If the desired accuracy is not achieved, we further subdivide the output parameter range to examine if output parameter values from the training data are represented within each sub-range. If not, additional data is collected for adding to the training set by identifying input parameters that are highly correlated with the output parameter [3] and choosing values for such parameters that further subdivide the corresponding input parameter space. The goal for this additional data collection is to populate the output parameter ranges in the training data more uniformly. If augmenting the training set does not improve the accuracy relative to the previous iteration, we establish a case of over-fitting and
Benchmark Modeling Technique Regress-L Regress-LQ Regress-LI ANN-Linear ANN-Gauss ANN-Elliot
avg. 24.90 21.69 21.89 18.72 27.42 11.50
CPU % prediction error med. stdev. 20.12 20.11 17.81 17.83 19.35 16.36 14.02 17.41 21.13 23.84 6.65 14.02
90p. 54.88 48.88 49.31 46.46 57.16 29.60
avg. 19.87 8.66 19.80 18.57 47.34 2.50
Memory % prediction error med. stdev. 20.24 12.98 6.47 8.12 16.71 14.80 18.53 12.45 46.53 29.73 1.16 3.68
90p. 34.87 19.36 37.19 34.43 96.15 6.10
avg. 6.04 6.27 6.58 4.36 25.58 7.31
Postmark % prediction error med. stdev. 4.73 5.60 5.09 5.51 5.71 5.53 3.57 5.25 21.00 24.54 3.34 10.95
90p. 11.42 11.19 12.60 8.53 33.34 16.24
avg. 23.95 73.51 71.36 24.87 40.00 8.48
OLTP % prediction error med. stdev. 90p. 17.91 19.29 50.54 53.12 74.75 195.49 46.31 75.04 213.53 16.72 22.93 57.53 20.89 48.22 120.04 4.24 12.36 21.95
Table 1. Prediction error statistics for the regression and ANN techniques instead discard from the training set data points that represent variation in the input parameters that are uncorrelated to the output parameter [3]. C denotes the state that adequate data collection has been evidenced with over-fitting symptoms and the training set reduction has commenced. The training procedure halts when either (i) prediction accuracy is adequate or (ii) prediction accuracy stabilizes or starts degrading. 4.3. Evaluating Alternative Modeling Techniques Given the range of behaviors of virtualized applications, identifying techniques that can adequately model them is a challenge. We first examine the suitability of regression techniques that have been used to model application behavior in a non-virtualized environments. Observing the unsuitability of regression-based models, we examine modeling using artificial neural networks that have hitherto not been explored for modeling application behavior. For evaluating model accuracy, we uniformly use the percentage prediction error when the model is applied for predicting application performance and report the median, average, standard deviation, and 90th percentile values for prediction error. 4.3.1
Regression Models
We first evaluate regression analysis, a common class of techniques for modeling the influence of multiple independent variables on a dependent variable. In our case, the independent variables are the input parameters of the model, which we shall denote in this section using the following notation within regression equations: C (CAP), M (MEM), I (IONICE), IO (CDIOPS), and O (output parameter for each benchmark). We used the R statistical package [3] to do the regression analysis. Table 1 summarizes the prediction errors across three regression models that we examined. Regression-L We start with the simplest regression model, Regression-L, that only uses linear terms for the dependent parameters as: O = b1 + a1 ∗ C + a2 ∗ M + a3 ∗ I + a4 ∗ IO. For most of the benchmarks, the median errors of different applications are considerably high. The reason can be attributed to the fact that most of the benchmarks have a non-linear dependency on the input parameters, which the restricted linear equation cannot model adequately. Regression-LQ We examined an alternate linear regression model, Regression-LQ, which included quadratic terms
for the dependent parameters in addition to the linear terms as: O = c1 + a1 ∗ C + b1 ∗ C 2 + a2 ∗ M + b2 ∗ M 2 + a3 ∗ I + b3 ∗ I 2 + a4 ∗ IO + b4 ∗ IO2 . Prediction errors, while reduced compared to Regression-L, are still high, indicating the behavior of the applications are too complex to be captured with quadratic terms alone. Regression-LI Observing that some of the input parameters, e.g., MEM and CDIOPS, had a combined influence on the performance metric for certain benchmarks, we examined a linear regression model, Regression-LI, which included pair-wise interactive terms in addition to the linear terms as follows: O = b1 + a1 ∗ C + a2 ∗ M + a3 ∗ I + a4 ∗ IO + a12 ∗ C ∗ M + a13 ∗ C ∗ I + a14 ∗ C ∗ IO + a23 ∗ M ∗ I + a24 ∗ M ∗ IO + a34 ∗ I ∗ IO. Unfortunately, the median errors were found to be high, with errors sometimes better and sometimes worse than Regression-LQ. Our experience with regression models led us to hypothesize that it might be extremely difficult, to create a conventional mathematical model which can predict a virtualized application’s performance with acceptable accuracy. These models primarily employ curve-smoothing techniques to fit the training data which may not help in capturing behaviors when output changes non-smoothly in different ranges of the input parameters. We therefore identified the need for a technique which is adaptive and efficient in modeling complex non-linear relationships between outputs and inputs. Evolutionary approaches such as fuzzy logic, artificial neural networks, and genetic algorithms provide such an ability. 4.3.2
Artificial Neural Network Models
Artificial neural networks (ANN) [19] are advanced nonlinear statistical modeling tools based on biological neural networks. At a high level, a neural network consists of cells and links. Cells are computational elements and they generate activation signals for other cells, while links connect any two cells and enable messages to flow between them. Each link is weighted and unidirectional; the weight is used as a multiplicative factor for the signal strength communicated. We used the RPROP algorithm [18] for training the ANN within each step of the iterative model training procedure outlined earlier. The input and output variables of the ANN can be separated by multiple layers each of which has a configurable number of hidden neurons. The choice of these
parameters depends on the number of input and output variables and the complexity of their inter-relationships. After evaluating different configurations for prediction accuracy, we configured the ANN with two hidden layers with 20 interconnecting neurons at each layer. There is an internal ANN parameter which deserves further discussion, the activation function which defines the output of a node or a set of nodes based on a set of inputs. Our chosen ANN implementation [1] offers multiple choices for the activation function. While we evaluated all of these functions, we discuss only three, ANN-LINEAR, ANN-ELLIOT, and ANN-GAUSSIAN, due to space constraints, and discuss only two of these below. The LINEAR function is defined as: O = X ∗ S, D = 1 ∗ S, where O represents output and X represents the input set. Derivation (D) is used to update the weights of the neurons. Steepness (S) is a configuration parameter to the activation function; we used the default S value of 0.5 which provided the best results in our case. The ANN-LINEAR function provides accuracy similar to linear regression (Table 1). The ANN-ELLIOT outperformed all the other activation functions in the ANN package as well as all the linear regression techniques that we examined, given by: O = ((X ∗ S)/2)/(1 + |X ∗ S|) + 0.5, D = S ∗ 1/(2 ∗ (1 + |X ∗ S|) ∗ (1 + |X ∗ S|)) The error values for ANN-ELLIOT (Table 1) indicate that it is able to adequately model the performance of all the benchmarks providing median error in the range 1.166.65%. It is well known that the most complex instances of non-linearity can be represented in neural networks by a sigmoidal function [24] of which the ANN-ELLIOT is a specific instance that is also computationally efficient. It is perhaps not surprising then that an ANN-ELLIOT with sigmoidal properties was found suitable.
5. Experiments In this section, we evaluate the ANN-Elliot model that was identified to be adequate for modeling the performance of virtualized applications. We analyze the distribution of prediction error for each benchmark application, the sensitivity of prediction accuracy to the training data set size, and the training overhead. 5.1. Experimental Setup For our experiments, we used a Dell Optiplex 755 dual core Intel Pentium 4 machine with 2 GB of physical memory running Xen-3.2.0 and and Linux VMs. All VMs including dom-0 ran Linux Kernel-2.6.18.8-xen. At any instant, dom-0 could use one or more cores that were available. Guest machines were restricted to use a single core with the choice of the specific core made at run-time by the VMM, a default Xen option. The VMs used physical partition backed virtual block devices for storage on the same 7.2K RPM SATA disk drive.
480-500 IOPS
2200-2400 IOPS
6000-6400 IOPS
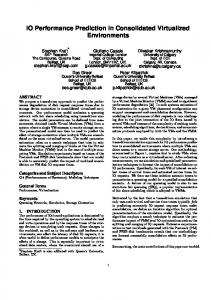
Figure 3. Error Distribution for Sysbench-CPU benchmark. Each row of heatmaps in the 2D heatmap array corresponds to ionice values 0, 3, and 7 resp. from top to bottom. Each column corresponds to the specified CDIOPS range below. Within each heatmap, the X axis represents CAP values of 8,15, and 20; the Y axis represents MEM allocations of 100MB, 200MB and 512MB. Error codes are same for these and all future heatmaps. Error value 0-3% = white, 3-9% = light grey, 9-27% = dark grey, 27% and more = black.
Initial experiments indicated that inadequate CPU allocation in dom-0 can adversely impact application performance. In our setup, we ensure at least 25% CPU allocation for dom-0 and did not impose any upper bound on the CPU usage for dom-0. In addition, dom-0 memory allocation (512 MB) was kept constant for all the experiments. To emulate disk I/O contention, we created an additional VM with 256 MB of memory and 20% CPU CAP, which ran an application issuing random reads to large files at varied IOPS values. To obtain training and testing data, each benchmark was run thrice for each input parameter configuration, and an average value of the performance metric was chosen as the output parameter value. 5.2. Prediction Error Distributions While the average and median error values are valuable indicators of model accuracy, the distribution of the errors across the various input parameter configurations can be a valuable guide to the system administrator when choosing allocation values. We depict error distribution across the input parameter space using error heatmaps, a visual representation that aids in performing allocations with known confidence measures of performance. Sysbench-CPU For the CPU benchmark, we used 53 and 81 data points for training and testing respectively. The median error using ANN ELLIOT for the test data set is 6.65%. Figure 3 depicts the distribution of error under different allocation values. Careful examination indicates that the training data set does not contain any data points corresponding to CAP range 5-10, MEM 512 , and IONICE 0. The absence of those points results in a greater inaccuracy
100-130 IOPS
400-600 IOPS
20-40 IOPS
1100-1700 IOPS
Memory micro-benchmark For training, 108 data points are used; a separate 108 data points are used for testing. The median error observed from ANN ELLIOT for the test data set is 1.16%. The error heatmap (Figure 4) indicates that high error values are concentrated in high values of MEM and an IONICE value of 0 (highest I/O priority). At high memory allocation, most pages are accessed from memory and consequently, the application run-time is a small value which increases its sensitivity. PostMark For Postmark, 54 data points were used for training and 62 data points were used for testing. For this I/O intensive application, the median modeling error is 3.34%. We do not present a heatmap for this benchmark due to space constraints but we observe that the prediction accuracy was high with the most error values being relatively small. OLTP For the OLTP benchmark with complex behavior, 180 data points were used for training and 136 data points for testing. The median error observed from ANN ELLIOT for the test data set is 4.24%. Figure 5 indicates that the high error predictions are located in the region of 200 MB when the range of competing IO is between 800-1600 IOPS. From our training data, we found that there are relatively fewer training data points observed in that range perhaps leading to an under-fitting of the model and consequently, increasing modeling error in that specific range. Augmenting the training set, unfortunately, resulted in over-fitting, indicating that there is possibly room for improvement in our training procedure. 5.3. Sensitivity to Training Data Set Size To understand the sensitivity of model accuracy to the training data set size, we trained the model with a randomly
1600-4200 IOPS
Changes are in the CAP values – 5, 15, 20 used.
chosen subset of size 20%, 40%, 60%, 80%, and 100% of the final training data set and measured the prediction accuracy for each benchmark. From Figure 6 it is evident that the median error reduces and approaches acceptable values quickly as the training data set size increases. These errors do not monotonically decrease with increase in training data set size owing to the random selection of the subsets used in training, rendering them non-representative of the overall training data set.
Error %
of the model for these input parameters and is reflected in the dark regions of the heatmap. Our training procedure did not add more data points due to over-fitting symptoms.
800-1600 IOPS
Figure 5. Error Distribution for the OLTP benchmark. X and Y axis are similar to those used in Figure 3.
Figure 4. Error Distribution for memory microbenchmark. X and Y axis are similar to those used in Figure 3. Changes include memory values – 100MB, 128MB and 175MB, and the CAP values – 5, 15, 20.
100-300 IOPS
300 250 200 150 100 50 0
Median Error 90th Percentile Error
CM P O 20%
CM P O CM P O CM P O 40% 60% 80% Relative training data size
CM P O 100%
Figure 6. Sensitivity of accuracy to training data set size. C-Cpu benchmark, M-Memory benchmark, PPostmark, and O-OLTP
5.4. Training and Deployment Overhead To understand the overhead of training and to determine the suitability of the modeling approach in a dynamic environment where the model needs to be updated continuously, we recorded the training time as we varied the number of data points in the training. We observed that the training time for the ANN is proportional to the size of the data set (due to space restriction we can not show that in the paper). For the largest training data set of 180 training points (from the OLTP benchmark), the training time is 34 seconds, which is typically much smaller than the average steady state application performance duration in which the average application load or business logic does not change much. Such a model can quickly adapt to changes in application and system behaviors, and it can be used at any time by data center managers to predict application performance at desired parameter configuration of the VM. Further, to
minimize the impact to the production virtualized hosts during actual deployment, the monitored resource and performance data can be sent via network to a dedicated system that trains the models.
6. Related Work 6.1. Performance Modeling for Virtualized Systems In early work on optimized resource allotment in utility data centers, Doyle et al. investigated internal models to estimate the service response time under different loads and resource allocation [11]. The approach employs queuing models for both server and storage service time prediction and is application-aware since it employs performance models based on knowledge of application load. Bennani et al. also investigated application-aware multi class open queuing networks to predict the response time and throughput for both online and batch workloads [6]. Autoregressive models that map CPU allocation to the mean response time with a fixed workload have been studied by Liu and his colleagues [16]. Fuzzy logic has been used to model the nonlinear relationship between a virtualized Web server’s workload and its CPU usage [26]. Wood et al. propose a combination of application modeling and virtualization overhead profiling for estimating the dom-0 and dom-U CPU utilization of an application when it is moved from native to virtualized hardware [25]. Most recently, Padala et al. proposed an auto-regressive moving average model to represent the relationship between application performance and its resource allocation, where the model parameters are updated online using recursive least squares method [17]. The above approaches either do not adequately address all resource dimensions or resource competition or both, the effects of which are pronounced in a virtualized environment. Approaches for modeling resource utilization are not naturally usable in a virtualized environment where the control knobs are for resource allocation. Our experience with the benchmarking of virtualized applications underscores the importance of choosing both the right set of parameters and the right modeling technique to adequately incorporate the influence of resource allocation and resource competition in a virtualized environment. 6.2. Performance Modeling for Non-virtualized Systems Cross-platform performance prediction approaches can potentially be useful in a virtualized environment where resource configuration is subject to change. Lee et al. [14] have proposed detailed machine regression models based on a large set of architecture-specific information such as register count, cache sizes, etc. combined with application-specific hardware counter information such as L1/L2 misses, stalls, etc. to characterize application performance and power. Subsequent work by them extended the above and proposed to study architectural design spaces
using regression models [15]. The work of Ipek et al. [12] took a similar approach but instead used ANNs trained with a large number of architecture-specific parameter to explore architectural design spaces. Recently, Stewart et al. [20] proposed trait models which characterize various aspects of a system’s influence on application performance, including the influence of cache sizes on cache misses and the influence of the request mix on CPI and cache misses. While architecture-specific and performance-counters based models have the potential to provide more precise predictions for a single application, they are difficult to train and hard to use. Some of the above techniques only address the CPU-intensive applications and model the CPU resource consumption alone. Furthermore, given the large number of parameters in such models, it is extremely difficult to intuitively reason about the nature of the model parameters’ influence on application performance. In a virtualized environment, applications and operating systems are sand-boxed while the data center administrators having little to no knowledge about them, thus making applicationaware models unusable. Virtualization also introduces resource competition by other application VMs which can compromise the accuracy of isolated application models. In contrast, we propose and explore the accuracy of a simple, practically usable models that take coarse-grained view of a virtualized system’s resources along the various resource dimensions of processing, memory, storage, and network. Finally, a large body of work addresses application or application-domain specific performance prediction. For parallel applications, Katramatos and Chapin proposed runtime prediction based on a network-latency model and application profiling for different input data sizes over heterogeneous clusters [8]. Run-time predictions of finergranularity jobs, which are useful for scheduling interactive applications were proposed by Dinda et al. [9] which is based on the AR(16) model for CPU load estimations. For Internet services, Stewart and Shen proposed response time prediction through offline profiling of component-based services in which each component service is individually modeled by its CPU utilization, remote method invocation overhead, and network delay [21]. These application and domain-specific approaches assume a specific model of the application or the deployment platform that does not apply to applications running inside virtual machines running on a shared piece of hardware alongside other applications.
7. Conclusions and Future Work Modeling application performance in a virtualized data center is a challenging and necessary task. It allows system administrators to determine the minimum resources required by an application VM to deliver the required performance that will meet the SLA guarantees. We identified generic resource allocation and competition parameters that
contribute to influencing the performance of virtualized applications with widely varying resource consumption characteristics. These parameters apply to the popular virtualization architectures of today, are simple to interpret, and thus easily usable by data center system administrators. We demonstrated that conventional linear regression that has been used with much success for modeling non-virtualized application behavior fail to adequately model virtualized applications with this newly identified parameter set. A specific implementation of an artificial neural network (ANN) model combined with a custom training process was identified to predict virtualized application performance with high accuracy. Median modeling error in the range of 1.166.65% was observed for a variety of benchmark workloads. Our work opens up several avenues for future research. An important next step involves online model refinement to address dynamically changing application behavior; the key challenge here is to differentiate short-term or transitory changes in application performance characteristics from stable or long term changes. Second, while the model parameters that we proposed addressed the influence of basic, high-level resource types, it would be interesting to see if refining the model to incorporate the influence of additional hardware resource types, especially cache allocation and contention, further increases prediction accuracy. Finally, comprehensively addressing data center resource management would ultimately require exploring new techniques for automatic resource redistribution for SLA-based revenue maximization based on online model refinement with real data center workloads.
References [1] Fast Artficial Neural Network (FANN). http://leenissen.dk/fann/. [2] Microsoft virtual pc for windows. URL: http://www.microsoft.com/windows/products/winfamily /virtualpc/default.mspx. [3] The R Project for Statistical Computing. http://www.rproject.org/. [4] Sysbench: a system performance benchmark. http://sysbench.sourceforge.net/. [5] P. Barham, B. Dragovic, K. Fraser, S. Hand, T. Harris, A. Ho, and R. Neugebauer. Xen and the art of virtualization. In Proceedings of the nineteenth ACM symposium on Operating systems principles, pages 164–177, 2003. [6] M. N. Bennani and D. A. Menasc´e. Resource allocation for autonomic data centers using analytic performance models. In ICAC, pages 229–240. IEEE Computer Society, 2005. [7] C. Clark, K. Fraser, S. Hand, J. G. Hansen, E. Jul, C. Limpach, I. Pratt, and A. Warfield. Live migration of virtual machines. In Proc. of USENIX NSDI, 2005. [8] S. J. C. Dimitrios Katramatos. A Cost/Benefit Estimating Service for Mapping Parallel Applications on Heterogeneous Clusters. IEEE International Conference on Cluster Computing, September 2005.
[9] P. Dinda. Online Prediction of the Running Time of Tasks. Cluster Computing, 5(3), 2002. [10] P. A. Dinda and D. R. O’Hallaron. Host load prediction using linear models. Cluster Computing, 3(4), 2000. [11] R. P. Doyle, J. S. Chase, O. M. Asad, W. Jin, and A. Vahdat. Model-based resource provisioning in a web service utility. In USENIX Symposium on Internet Technologies and Systems, 2003. [12] E. ¨Ipek, S. A. McKee, R. Caruana, B. R. de Supinski, and M. Schulz. Accurate and efficient regression modeling for microarchitectural performance and power prediction. Proc. of the ACM Architectural Support for Programming Languages and Operating Systems Conference, October 2006. [13] J. Katcher. Postmark: A new file system benehmark. Technical report, Network Appliance, 1997. [14] B. C. Lee and D. M. Brooks. Efficiently exploring architectural design spaces via predictive modeling. Proc. of the ACM Architectural Support for Programming Languages and Operating Systems Conference, October 2006. [15] B. C. Lee and D. M. Brooks. Illustrative Design Space Studies with Microarchitectural Regression Models. Proc. of the IEEE International Symposium on High Performance Computer Architecture, February 2007. [16] X. Liu, X. Zhu, S. Singhal, and M. F. Arlitt. Adaptive entitlement control of resource containers on shared servers. In IM, pages 163–176. IEEE, 2005. [17] P. Padala, K. G. Shin, X. Zhu, M. Uysal, Z. Wang, S. Singhal, A. Merchant, and K. Salem. Adaptive control of virtualized resources in utility computing environments. In Proceedings of the 2nd ACM SIGOPS/EuroSys European Conference on Computer Systems 2007, pages 289–302, 2007. [18] M. Riedmiller and H. Braun. Rprop - a fast adaptive learning algorithm. Technical report, Proc. of ISCIS VII, Universitat, 1992. [19] W. S. Sarle. Neural networks and statistical models, 1994. [20] C. Stewart, T. Kelly, A. Zhang, and K. Shen. A dollar from 15 cents: Cross-platform management for internet services. In Proceedings of the USENIX Annual Techinal Conference, pages 199–212, 2008. [21] C. Stewart and K. Shen. Performance modeling and system management for multi-component online services. Proc. of the 2nd USENIX NSDI, 2005. [22] G. Venkitachalam and B. Lim. Virtualizing i/o devices on vmware workstation’s hosted virtual machine monitor. In USENIX Annual Technical Conference, 2001. [23] VMWare Inc. VMWare VMotion. http://www.vmware.com/products/vi/vc/vmotion.html. [24] B. M. Wilamowski and J. Binfet. Do fuzzy controllers have advantages over neural controllers in microprocessor implementation. In Proceedings of the 2nd International Conference on Recent Advances in Mechatronics, pages 342–347, 1999. [25] T. Wood, L. Cherkasova, K. Ozonat, and P. Shenoy. Profiling and modeling resource usage of virtualized applications. In Middleware ’08: Proceedings of the 9th ACM/IFIP/USENIX International Conference on Middleware, 2008. [26] J. Xu, M. Zhao, J. A. B. Fortes, R. Carpenter, and M. S. Yousif. Autonomic resource management in virtualized data centers using fuzzy logic-based approaches. Cluster Computing, 11(3):213–227, 2008.