Journal of Information Processing Systems, Vol.6, No.1, March 2010
DOI : 10.3745/JIPS.2010.6.1.067
Approximate Clustering on Data Streams Using Discrete Cosine Transform Feng Yu*, Damalie Oyana*, Wen-Chi Hou* and Michael Wainer* Abstract—In this study, a clustering algorithm that uses DCT transformed data is presented. The algorithm is a grid density-based clustering algorithm that can identify clusters of arbitrary shape. Streaming data are transformed and reconstructed as needed for clustering. Experimental results show that DCT is able to approximate a data distribution efficiently using only a small number of coefficients and preserve the clusters well. The grid based clustering algorithm works well with DCT transformed data, demonstrating the viability of DCT for data stream clustering applications. Keywords—Grid Density-Based Clustering, Approximate Cluster Analysis, Discrete Cosine Transform, Sampling, Data Reconstruction, Data Compression
1. INTRODUCTION With advances in communication and data collection techniques today, many organizations receive vast amounts of real time data at very high rates. Consider these examples which all receive real time data continuously: sensor networks, network traffic control, and web log monitoring and processing centers. The high rate of data accumulation coupled with constant changes in the characteristics of the data stress traditional algorithms that were designed to process static data. These constantly changing data sets are referred to as data streams. Thus, a data stream is generally a sequence of unbounded, real time data items with a very high data rate that can only be read once by an application [6, 9]. The storage, mining, and querying of data streams are very computationally challenging and time consuming tasks. Many techniques [14] have been proposed for compressing or approximating data. However, few [5] can be applied to compressing data streams, which are generally unbounded and arriving at high speed (or updates in high speed). Since the sizes of data streams can be very large or even unbounded, it can be very time consuming to conduct clustering on such large amounts of accumulated stream data. Hence, finding a way to store the data compactly, preserve the distributions accurately, and conduct clustering quickly is the issue of utmost importance in data stream clustering. The objective of this study is to investigate the potential of using the discrete cosine transform (DCT) as a data approximation method to efficiently store and preserve the distribution of data streams for approximate cluster analysis. Clustering can be defined as the grouping of objects into several disjoint groups such that objects in the same group are similar to each other and are dissimilar to other groups according to Manuscript received December 16, 2009; revised February 26, 2010; accepted March 9, 2010. Corresponding Author: Feng Yu * Department of Computer Science,Southern Illinois University, Carbondale IL 62901, U.S.A (
[email protected], hou@ cs.siu.edu,
[email protected])
67
Copyright ⓒ 2010 KIPS (ISSN 1976-913X)
Approximate Clustering on Data Streams Using Discrete Cosine Transform
some similarity metrics [10]. Many clustering algorithms have been researched and developed [1-4, 8, 11] across several disciplines but only a few are tailored towards very large multidimensional data sets. Most of the existing clustering algorithms do not do well with data streams as they generally require large amounts of memory and processing resources for data stream processing. In this study, we focus on finding a method that can store the data compactly, preserve the distributions accurately, and allow the compressed data to be used readily for approximate clustering. In a data stream environment, such a compression/approximation method must possess the ability to summarize the stream accurately in one pass. In addition, it must be able to update its summary (or coefficients) dynamically and quickly as the data streams through at high speed. In this study, we propose to use the discrete cosine transform (DCT) [15] to compress the data. We design a grid density-based clustering algorithm to work with the transformed data, unlike other algorithms that work with original uncompressed data. We will compare the clusters derived from the compressed data with those obtained from the original data. The rest of this paper is organized as follows. A literature review is presented in Section 2. We give an overview of the data stream models, traditional clustering algorithms, and some background of the discrete cosine transform. Section 3 details the clustering algorithm implemented in this study. In Section 4, experimental results of the algorithm using compressed data are presented. Section 5 is the conclusion.
2. LITERATURE SURVEY A number of algorithms have been proposed for clustering data streams. O’Challagham et al. [12] proposed STREAM which processes incoming data in batches so that each batch can fit into main memory. It clusters the data points and retains a set of centroids for clusters found within each batch. Centroids retained so far are further clustered to derive a cluster model. However, due to the dynamic properties of data streams, the previously generated clusters can be outdated in a short time limiting this algorithm’s ability to cope with outliers. For example, when the outliers appear in a batch, they will distort the real cluster shapes and mask the emerging trend of the data stream. Analytical clustering of data streams using the k-median technique was studied by Guha et al. [7]. The algorithm scans the data stream once using a small amount of space. The algorithm first clusters a sample of data into 2k clusters. Then, it clusters the above points for a number of samples into 2k and does this iteratively until it finally clusters the 2k clusters into k clusters. It has a run time of O(nk), where n is the number of data points and k is the number of centers. Several improvements of the k-means have been proposed. One of them, incremental k-means [11], is a one pass algorithm with an O(Tkn) complexity, where T is the average transaction size, n the number of transactions, and k the number of centers. The main idea behind this algorithm is that it updates the cluster centers and weights after examining a batch of transactions whose size is equal to the square root of the number of transactions instead of updating them for each transaction [6]. CluStream, proposed by Aggarwal et al. [2] divides the clustering process into two components. The online component clusters the incoming data streams using the k-means algorithm. It also maintains summarized data statistics about each cluster discovered. The off line process
68
Feng Yu, Damalie Oyana, Wen-Chi Hou and Michael Wainer
performs clustering on the summary statistics of the micro-clusters to cluster data according to some user preferences such as time frame and number of clusters. This algorithm has been tested on a number of synthetic and real data sets to prove its accuracy and efficiency. However, it can only detect sphere-shaped clusters and is not effective in identifying outliers. The same team, Aggarwal et al.[1] proposed HPStream, a projected clustering (determines clusters for a specific subset of dimensions) algorithm for high dimensional data streams, which outperformed their previous algorithm, CluStream. It continuously refines on the set of projected dimensions and data points during the progression of the data stream. Initially, the incoming data points are tentatively added to each cluster to update the set of projected dimensions for each cluster in such a way that the spread along the chosen dimensions is as small as possible. Then, the distance between the data points and each cluster’s centroid is computed, using this, points are clustered into their closest clusters. However, this method like CluStream can only identify sphere-shaped clusters and cannot detect outliers effectively. Since the algorithm does not store sufficient information about the past data stream, it cannot support comprehensive analysis over historical data. Park et al. [13] proposed a grid-based algorithm, statistical grid-based clustering. Initially, the multi-dimensional data space of the data stream is partitioned into a set of mutually exclusive equal-size initial cells or grids. As new data elements are generated continuously, each initial cell monitors the distribution statistics of data elements within the range. When the support of one of the initial cells becomes greater than or equal to a predefined split support, one of the dimensions of the data space is chosen as a dividing dimension based on the distribution statistics of a dense cell to be partitioned. The range of the cell is dynamically divided into two mutually exclusive smaller cells called intermediate cells. In the same way, when the intermediate cell itself becomes dense, it is partitioned similarly. Partitioning is done in three ways, mean, standard deviation or a hybrid of the two. Eventually a dense region of each initial cell is recursively partitioned until it becomes the smallest cell called a unit cell. This algorithm has some advantages in that since the cell is divided, depending on its support in that range, there is no need to store each data point, thus saving memory. Also being a grid-based clustering algorithm, it does not suffer from the nearest neighbor problem in high dimensional data space. It is capable of discovering clusters of any shape and is also reasonably fast. However, it does not address how to efficiently cluster very large data sets that do not fit in memory. Having reviewed the current data stream clustering algorithms, it is clear that they all need to address the issue of space available for processing historical data. In this light, the value of the next topic, approximation of the data stream distribution using the DCT, can be seen.
3. SYSTEM ARCHITECTURE AND THE DISCRETE COSINE TRANSFORM (DCT) The DCT has been used widely in signal and image processing due to its power in information preserving and simplicity in update [10]. In this research, we build a methodology for approximate data stream clustering based on the DCT. We use it to preserve information using only a small amount of space and design a clustering algorithm on the transformed data.
69
Approximate Clustering on Data Streams Using Discrete Cosine Transform
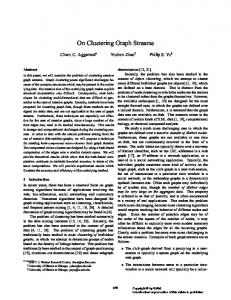
3.1 System Architecture In this research, we use the DCT to transform data streams on the fly and store the transformed data (or coefficients) in a compact fashion for later clustering. Specifically, the DCT is performed on each batch of data that arrives during an interval, for example, every 10 minutes. The transformed data can later be combined at the users' will and clustered. Fig. 1. is the system architecture.
Fig. 1. System Architecture
3.2 Discrete Cosine Transform To apply the discrete cosine transform, a normalization of values is first required. To illustrate the use of the discrete cosine transform, let us begin by considering a one-dimensional case. Let X be an attribute whose values are of interest. The values are normalized to a predetermined domain [0, 1] as follows. Let maxX and minX be the maximal and minimal X values of the data stream, respectively. Then, a value x of X is normalized as follows: xz =
x − min X
(3.1)
max X − min X
z where x denotes the normalized value of x. For example, a domain of {0, 1, 2, 3, 4} is normalized to {0, 1/4, 2/4, 3/4, 1}. The minimal and maximal values of an attribute can usually be determined based on knowledge of the data. Let N be the total number of items seen so far in the current interval of the data stream and Dom(X) the domain of the X values, i.e., [0, 1]. The frequency function of X is defined as
(3.2) where count x is the number of elements with the value x in the current interval of the data
∑ f ( x ) = 1.
stream. The frequency function satisfies the relations:
x∈Dom ( X )
Let . By the theory of discrete cosine transform, f(x) can be represented as
f ( x) =
n −1
∑α φ k =0
70
k
k
( x)
(3.3)
Feng Yu, Damalie Oyana, Wen-Chi Hou and Michael Wainer
where φ k ( x ) = 1 when k = 0; otherwise, φk ( x) = 2 cos kπx, k = 1, ..., n − 1. α k , k > 0, are given by the following formula, N
1 N
αk =
∑φ i =1
k
(t i ) =
n
1 N
∑ count j =1
xj
⋅ φk ( x j )
(3.4)
where t i , 1 ≤ i ≤ N , is the X value of the ith element in the current interval of the data stream, and xj is the jth X value in Dom(X). The DCT is known to have an excellent energy compaction property, concentrating most of the signal information - the frequency function here - within a few low-frequency components of the transform [10, 15]. Therefore, the frequency function, in common practice, is approximated by the first m coefficient terms, where m is a number that is much smaller than the domain size n, requiring much less storage space. That is, m −1
f ( x) ≈ ∑ α kφ k ( x)
(3.5)
k =0
Example. Consider a one-attribute data stream with 6 tuples {0.33, 0.32, 0.12, 0.66, 0.90, 0.80}. The cosine transformation of this distribution is derived as follows. Given the cosine series φ k ( x ), k ≥ 0 : {1, 2 cos πx , 2 cos 2πx ,..., 2 cos kπx ,...}, we derive 1 6 1 6 the respective coefficients as : α 0 = 1, α1 = ∑ φ1 (t j ) = −0.063, α 2 = ∑ φ2 (t j ) = 0.0951, 6 j =1 6 j =1 … , where φ k (t j ) is
2 cos kπ t j , k ≥ 1, and tj, 1 ≤ j ≤ 6, is the jth element in the current
interval of the stream. To apply the transform to the d-dimensional case, the distribution is approximated by its md coefficients a k1,..., kd , 0 ≤ k1 ,..., k d ≤ m − 1 , as :
α k ,...,k = 1
d
1 N
N
d
i =1
j =1
∑ [∏ φ
kj
(tij )]
(3.6)
where tij is the jth attribute of the ith element ti, 1 ≤ i ≤ N . As observed from Eq. (3.3), each coefficient α k1,..., k d of the transform is just the average of the sum of the products of the base functions (i.e., φ k j ( x ) ) on the elements. Therefore, when a new element arrives, we just first compute the “contribution” of that element to the transform and then combine it with the old coefficients. That is, for the arrival of a new element x = (x1, x2, …, xd) to the data stream, which has already had N elements, α k1,..., k d is updated as
α k ,...,k = d
1
N 1 d α k1 ,...,kd1 + ∏ φk ( x j ) N +1 N + 1 j =1 j
(3.7)
Due to the additivity property, one can easily combine or add two sets of coefficients easily as
α k ,...,k = 1
d
N1 N2 α k1 ,...k + α k2 ,...k N1 + N 2 1 d N 1 + N 2 1 d
71
(3.8)
Approximate Clustering on Data Streams Using Discrete Cosine Transform
Where N1 and N2 are the number of elements in the first and second intervals of the stream to combine, respectively, and and are their respective DCT coefficients. Coefficients can be updated easily and dynamically. Note that the set of coefficients derived by the above incremental update scheme is exactly the same as if we had derived in batch fashion using the Eq. (3.4).
3.3 Sampling DCT Coefficients for Storage Space Reduction Usually, the greater the number of DCT coefficients kept, the higher the accuracy of the approximate data distribution. Since the DCT has a good energy conservation property, it allows for using a smaller number of coefficients without much information loss. Some techniques, such as triangular, reciprocal, spherical, and rectangular sampling [10], can be used to further reduce the number of coefficients stored. These techniques filter out high frequency coefficients from the md coefficients without much information loss. To select only a portion of the coefficients to store, in this study the rectangular zonal sampling is used because it has been proved to work well with highly correlated data. Fig. 2 below illustrates a scenario of 64 (=m2, 8 by 8) 2-dimensional DCT coefficients (Fig. 2(a)) being sampled using the rectangular zonal sampling (Fig. 2(b)), which results in only 39 of the 64 coefficients being retained for data distribution (Fig. 2(c)).
(a)
(b)
(c) Fig. 2. (a) DCT coefficients of 8 by 8 blocks, (b) Mask used to sample the coefficients-rect angular zonal sampling, (c) Coefficients Retained by the Rectangular Zonal Sampling (39 sam pled coefficients) 72
Feng Yu, Damalie Oyana, Wen-Chi Hou and Michael Wainer
4. CLUSTERING ON TRANSFORMED DATA The transformed data (i.e., DCT coefficients) are stored by the interval. Due to the additivity of cosine coefficients, users can combine any intervals of data for clustering. The clustering algorithm is a grid density-based algorithm. It partitions the data space into a number of grid cells based on the required resolution requirement, e.g., 8 by 8, 4 by 4, etc. The frequency of elements falling into each grid cell can be computed from the DCT coefficients (to be discussed in the following), on which the clustering algorithm is applied.
4.1 Reconstruction of Data Based on the specified resolution, the algorithm first reconstructs the data from the stored cosine coefficients. Let us illustrate this reconstruction with a two-dimensional example. Assume, for simplicity, both domains have the same size n. Given a resolution requirement of m1 by m2, where m1, m2 < n, the attribute space is partitioned into m1 by m2 grid cells. Let I(I1, I2) be a grid cell in the two-dimensional attribute space, where I1 and I2 are the intervals covered by the cell I on respective dimensions. Then the frequency of the interval I, denoted as f(I), is
(4.1) Where (4.2)
4.2 Clustering Algorithm A density-based clustering is conducted on the grid cells. Cells with frequencies (or densities) greater than a pre-specified threshold (termed significant cells) are assigned cluster numbers. The average frequency of cells is used here as the threshold. Connected significant cells are merged to form clusters. The procedure for labeling the individual cells is borrowed from image processing where image pixels are labeled to distinguish the different objects in the image. Several connectivity measures, such as minimal and maximal, can be used to determine whether cells are connected. Figure 3 illustrates the minimal and maximal connectivity for twodimensional cells. In the minimal connectivity (Figure 3(a)), neighbors of cell A include cells that touch A, along a line or surface. That is, only Cells 2, 4, 6 and 8 are neighbors of A in this case. In the maximal connectivity (Figure 3(b)), all cells that touch the central element in any way are neighbors of A. That is, Cells 1 ~ 8 are considered A’s neighbors. In our study, we have chosen the maximal connectivity for 2-dimensional cases and minimal connectivity for higher dimensional cases as the number of neighbors can increase exponentially
1
2
3
1
2
3
8
A
4
8
A
4
7
6
5
7
6
5
(a) 2-D minimal
(b) 2-D maximal
Fig. 3. Connectivity Patterns in 2-dimensional Space
73
Approximate Clustering on Data Streams Using Discrete Cosine Transform
Fig. 4. Clustering Algorithm
in the number of dimensions and become very time consuming. The procedures are briefly summarized as in the following algorithm. The algorithm is able to detect clusters of arbitrary shape. The higher the resolution, the larger the number of cells and the greater the amount of time will be needed for clustering. It is a very flexible system.
5. EXPERIMENTAL RESULTS 5.1 Data Sets We have implemented the cosine transform and the density-based grid clustering algorithm. Experiments were performed on an Intel Pentium(R) 4 CPU 2.40GHz processor. In order to show that the algorithm can cluster points of arbitrary shape, four two-dimensional synthetic data sets (as shown in Figure 5) were created: 1) DS1: 32,000 data points with most of them clustered into 10 groups, each of which are connected to others at the edges. 2) DS2: 18,500 data points with 8 clusters, 7 of which are connected at the edges. 3) DS3: 36,000 data points with more than 10 clusters, all connected at the edges. 4) DS4: 32,000 data points with the major clusters all connected to form a donut shape. Figure 5 below illustrates the spatial distributions of the datasets.
(a) Plot of DS1
(b) Plot of DS2
(c) Plot of DS3
Fig. 5. Spatial distributions of the data sets
74
(d) Plot of DS4
Feng Yu, Damalie Oyana, Wen-Chi Hou and Michael Wainer
5.2 Performance Results First, elements of the datasets are read into our program one by one, and at the same time DCT coefficients are computed as in Eq. (3.8). To identify clusters, we reconstruct the data from the DCT coefficients by Eq. 4.2 and apply the density-based grid clustering algorithm in Figure 4.2 to the reconstructed data. DCT coefficients are used to compute the density of cells. Cells with densities lower than the average are discarded and connected cells whose densities are greater than the threshold are grouped into the same cluster. In the experiments, we store 3,000 coefficients for each dataset for clustering. The following table shows the speeds in microseconds for converting a data point into 3,000 DCT coefficients and for reconstructing a cell frequency value from the stored DCT coefficients. As observed, it takes an average of 302 microseconds to transform a 2-d coordinate into 3,000 DCT coefficients and 337 microseconds to reconstruct a cell frequency from 3,000 DCT coefficients. The results demonstrate that DCT is fast enough to handle continuous, fast arriving, data streams. In addition, the data distributions can be reconstructed quickly without much delay for clustering. 5.2.1 Accuracy of the Reconstructed Diagrams Figures 6(a) and (b) show the data reconstructed from the DCT coefficients using 3,000 and 1,200 DCT coefficients stored, respectively. As mentioned previously, the accuracy of the reconstructed data set depends on the number of DCT coefficients used in the reconstruction. Figure 6(a), which uses more coefficients than Figure 6(b) in reconstruction, has a better approximation than the original data set, shown in Figure 5 (a).
(a) Reconstructed DS1 using 3,000 coefficients
(b) Reconstructed DS1 using 1,200 coefficients
Fig. 6. Distribution of reconstructed DS1 using a different number of coefficients
Table 1. (a) Connectivity Patterns in 2-dimensional Space Transforming a data point
Reconstructing a cell frequency
302 µ
337µ
75
Approximate Clustering on Data Streams Using Discrete Cosine Transform
5.2.2 Clustering The cells were then labeled using the connectivity methods described in Section 4 to form clusters. Each group of connected cells is labeled with a different number. In the following figures, we use different colors to represent different clusters. Figures 7 (a) ~ (h) show the results
(a) Clusters derived from original DS1
(b) Clusters from reconstructed DS1
(c) Clusters derived from original DS2
(d) Clusters derived from reconstructed DS2
(e) Clusters derived from original DS3
(f) Clusters derived from reconstructed DS3
Fig. 7. Clusters of original and reconstructed data sets
76
Feng Yu, Damalie Oyana, Wen-Chi Hou and Michael Wainer
(g) Clusters derived from original DS4
(h) Clusters derived from reconstructed DS4
Fig. 7. Continued
of the clusters derived from the original and reconstructed data sets from 3,000 DCT coefficients. As observed, our grid-based algorithm identifies clusters from transformed data almost exactly the same as those from the original data for all cases, except DS2. The discrepancy is due to the accuracy of the transform data and the problem can be easily resolved by storing a greater number of coefficients.
6. CONCLUSIONS In this study, we propose using DCT to compress fast arriving and potentially unbounded streaming data. We developed an approximate data clustering algorithm that can be applied to DCT transformed data. The experimental results show that data can be quickly transformed and reconstructed, demonstrating the viability of DCT for data stream applications. We have also shown that only small numbers of coefficients are needed to represent the data accurately. The grid density-based clustering algorithm also works well with DCT transformed data to identity clusters.
REFERENCES [1] [2] [3]
[4] [5] [6]
C. C. Aggarwal, J. Han, J. Wang, P. Yu, “A Frame-work for Projected Clustering of High Dimension Data Streams,” VLDB Conference, 2004. C. C. Aggarwal, J. Han, J. Wang, P. Yu, “A Frame-work for Clustering Evolving Data Streams,” VLDB Conference, 2003. M. Ester, H. P. Kriegel., J. Sander, X. Xu.: A Density-Based Algorithm for Discovering Clusters in Large Spatial Databases with Noise, Proc. 2nd Int. Conf. on Knowledge Discovery and Data Mining (KDD'96), Portland, OR, pp.226-231, 1996. (DBSCAN) D. Fisher, “Iterative Optimization and Simplification of Hierarchical Clusterings,” Journal of AI Research, Vol.4, pp.147-180, 1996. Z. Fu, J. Yang, W. Hu, T. Tan, “Mixture Clustering Using Multidimensional Histograms for Skin Detection,” ICPR (4) 2004: 549-552. Gaber, M. M., Zaslavsky, A., and Krishnaswamy, S. Mining data streams: a review. SIGMOD Rec. 34, 2, 18-26, 2005.
77
Approximate Clustering on Data Streams Using Discrete Cosine Transform
[7] [8] [9] [10] [11]
[12] [13] [14] [15]
S. Guha, N. Mishra, R. Motwani, L. O'Callaghan, “Clustering Data Streams”. IEEE FOCS Conference, 2000. S. Guha, R. Rastogi, K. Shim. CURE: An Efficient Clustering Algorithm for Large Databases. ACM SIGMOD Conference, 1998. Y. Lu, Y. Huang, “Mining Data Streams Using Clustering”. Proc. 4th Int. Conf. on Machine Learning and Cybernetics, Giangzhou, pp.18-21, 2005. J. Lee, D. Kim, and C. Chung, “Multi-Dimensional Selectivity Estimation Using Compressed Histogram Information,” Proc. ACM SIGMOD Conf., pp. 205-214, 1999. G. Medhat, M, M., Zaslavsky, A., and Krishnaswamy, S., “Towards an Adaptive Approach for Mining Data Streams in Resource Constrained Environments,” Proc. of 6th Int. Conf. on Data Warehousing and Knowledge Discovery – Industry Track (DaWak 2004), Zaragoza, Spain, September, Springer Verlag. L. O'Callaghan et al. Streaming-Data Algorithms for High-Quality Clustering. ICDE Conference, 2002. N. Park, W. Lee, Statistical Grid-Based Clustering over Data Streams, ACM SIGMOD Record, Vol.33, No.1, pp.32-37. V. Poosala, Y.E. Ioannidis, P.J. Haas, E.J. Shekita, “Improved Histograms for Selectivity Estimation of Range Predicates,” ACM SIGMOD 1996. G. Strang, “The Discrete Cosine Transform”. SLAM Review, Vol.41, No.1, pp.135-147, 1999.
Feng Yu is a Ph.D. student in the Department of Computer Science at Southern Illinois University since 2008. His research interests are in the area of query optimization, statistical database, data mining, and geometrical questions in data mining.
Damalie Oyana received her MS degree from the Department of Computer Science at Southern Illinois University in 2006.
Wen-Chi Hou received his MS and PhD degrees in computer science and engineering from Case Western Reserve University, Cleveland Ohio, in 1985 and 1989. He is presently a professor in the Department of Computer Science at Southern Illinois University. His interests include statistical databases, mobile databases, XML databases, and data streams.
Michael Wainer obtained his Ph.D in Computer and Information Science from the University of Alabama at Birmingham, in 1987 and is currently an associate professor of Computer Science at Southern Illinois University. His research interests lie in the areas of software development, computer graphics and human computer interaction. He is particularly interested in interdisciplinary work which utilizes the computer as a tool for design and visualization.
78