© 2004 Nature Publishing Group http://www.nature.com/natureneuroscience
ARTICLES
Dopamine neurons release transmitter via a flickering fusion pore Roland G W Staal, Eugene V Mosharov & David Sulzer1–3 A key question in understanding mechanisms of neurotransmitter release is whether the fusion pore of a synaptic vesicle regulates the amount of transmitter released during exocytosis. We measured dopamine release from small synaptic vesicles of rat cultured ventral midbrain neurons using carbon fiber amperometry. Our data indicate that small synaptic vesicle fusion pores flicker either once or multiple times in rapid succession, with each flicker releasing ∼25–30% of vesicular dopamine. The incidence of events with multiple flickers was reciprocally regulated by phorbol esters and staurosporine. Thus, dopamine neurons regulate the amount of neurotransmitter released by small synaptic vesicles by controlling the number of fusion pore flickers per exocytotic event. This mode of exocytosis is a potential mechanism whereby neurons can rapidly reuse vesicles without undergoing the comparatively slow process of recycling.
Several studies suggest that small synaptic vesicles (SSVs) release neurotransmitter by full fusion as well as through transient fusion pores (‘kiss-and-run’ exocytosis)1–3. Capacitance recordings that monitor changes in plasma membrane surface area indicate that SSV endocytosis at the calyx of Held occurs 50–100 ms after fusion4 and that 5% of fusion events by pituitary SSV-like microvesicles are followed (within 2 s) by endocytosis5. These relatively rapid instances of vesicle endocytosis are consistent with formation of transient fusion pores. In the neuromuscular junction, the kinase inhibitor staurosporine attenuates the release of the amphipathic fluorescent dye FM1-43 more than the release of acetylcholine during SSV fusion6. This suggests that PKC inhibition reduces the SSV fusion pore aperture and may inhibit full fusion. In hippocampal neurons, kiss-and-run, full fusion and an intermediate mode of endocytosis can be observed by labeling SSVs with a pH-sensitive fluorescent protein7. Also in some hippocampal neurons, some SSV fusion events result in partial loss of FM1-43 fluorescence8, suggesting that the vesicles close before FM1-43 release is complete. Neurotransmitters, however, have far higher diffusion coefficients than FM1-43 (refs. 6,9), and it is not known whether transient pore openings are sufficient for release of the entire neurotransmitter content of an SSV. In addition, the kinetics of kiss-and-run exocytosis cannot be determined due to the insufficient temporal resolution of current approaches. We therefore adapted carbon fiber amperometry to record dopamine release from synaptic terminals of cultured rat ventral tegmental area neurons. This technique directly measures dopamine flux with a time resolution that is 2–5 orders of magnitude greater than capacitance, imaging and postsynaptic recordings (Methods). We found that small synaptic vesicles regulate the release of neurotransmitter via rapid flickering of the fusion pore.
RESULTS Dopamine release from midbrain neurons SSVs are the predominant synaptic vesicles in cultured dopamine neurons from the ventral midbrain of rats (>99%)10,11. Neurons were stimulated with either 40 mM K+ (Fig. 1a) or a combination of 80 mM K+ and 20 nM α-latrotoxin (K+/α-LTX; Fig. 1b). α-Latrotoxin inserts into the plasma membrane in a manner facilitated by neurexin-1 and CIRL/latrophilin receptors and forms a cation channel that enables Ca2+ to enter the cell, thereby increasing the number of exocytotic events12 (Table 1 legend10). Both secretagogues elicited a variety of amperometric peaks (Fig. 1c,d). The average number of dopamine molecules recorded per amperometric event was similar for both secretagogues (K+, 15,800 ± 4,000 molecules; K+/α-LTX, 11,600 ± 1,700 molecules, P > 0.1), although events obtained by K+/α-LTX stimulation had smaller amplitudes (maximum current; Imax) (K+, 35.4 ± 3.4 pA; K+/α-LTX, 18.4 ± 2.5 pA, P < 0.05, Mann-Whitney U-test) and increased durations (width at half-height; t1/2) (K+, 108 ± 12 µs; K+/α-LTX, 178 ± 29 µs, P < 0.05). Simple and complex amperometric events The shapes of 80–85% of amperometric events induced by either secretagogue closely resembled those previously reported for dopamine and serotonin release during SSV exocytosis10,11,13,14 (Fig. 1c). Such peaks, which we refer to as ‘simple’ events, consisted of a single rising and a single falling phase (Fig. 1e; Methods). Our random walk simulations of dopamine release indicated that the minimum fusion pore diameter consistent with the flux of dopamine observed in simple events was 1.5–3.5 nm (Methods). Surprisingly, this calculated diameter of the fusion pore in dopaminergic SSVs is nearly identical to estimates of the initial
Departments of 1Neurology and 2Psychiatry, Black 305, 650 West 168th St, Columbia University, New York, New York 10032, USA. 3Department of Neuroscience, New York State Psychiatric Institute, 722 West 168th Street, New York, New York 10032, USA. Correspondence should be addressed to D.S. (
[email protected]). Published online 29 February 2004; doi:10.1038/nn1205
NATURE NEUROSCIENCE VOLUME 7 | NUMBER 4 | APRIL 2004
341
© 2004 Nature Publishing Group http://www.nature.com/natureneuroscience
ARTICLES
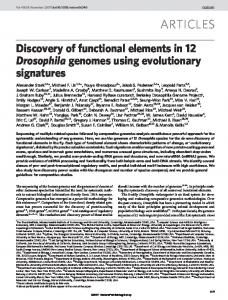
Figure 1 Dopamine release from axonal varicosities of rat ventral midbrain dopamine neurons. (a,b) Representative segment of current trace showing dopamine release from neurons stimulated with K+ alone (a) or with K+/α-LTX (b). The stimulus was given earlier in a portion of the trace that has been omitted because of the paucity of events. (c,d) Representative examples of simple events (c) and complex events (d). Simple events each have a single rising and falling slope, whereas complex events have multiple flickers, each with distinct rising and falling phases (Methods). (e,f) The upper panels show examples of amperometric current traces; the lower panels show the first derivative (dI/dt) of the currents. In the amperometric traces, the mean background current is indicated by a solid line (upper panel). To be considered an ‘event,’ the dI/dt must cross a 4.5 × r.m.s. threshold (solid line, lower panel). (e) Events with derivatives that cross the 3.0 × r.m.s. threshold (dotted line) only once in a rising trajectory are ‘simple’. (f) Events that cross the 3.0 x r.m.s. threshold multiple times are ‘complex’. The corresponding flickers (1–3) are indicated in the current trace. (g,h) Histograms of simple versus complex event characteristics obtained from amperometric recordings after K+/ α-LTX stimulation (n = 532 simple events and n = 130 complex events from eight sites; see Table 1 for statistics).
fusion pore formed by large dense-core vesicles (LDCVs) in eosinophils, neutrophils and chromaffin cells15–17 even though the volume of LDCVs is 3–4 orders of magnitude larger. The remaining events, which we refer to as ‘complex’ events (Fig. 1d), contained multiple, well-defined rising and falling phases (Fig. 1f; see Methods for flicker detection protocol). Complex events consisted of 2–5 ‘flickers’ that occurred at a mean frequency of ∼4 kHz (Table 1) and decreased in amplitude from the first to the last flicker (Table 2 and Fig. 2a). Complex events also showed significantly longer durations and released a greater number of molecules than simple events (P < 0.05; Fig. 1g,h and Table 1). As durations of consecutive flickers did not increase (Table 2), both the distance between the site of release and the recording electrode, and the diameter and open time of the fusion pore, were apparently unchanged.
Pharmacological regulation of events Previous studies have suggested that phorbol esters can increase the number of secretory events via activation of Munc-13 (refs. 18,19). In addition, they can enhance the calcium sensitivity of transmitter release20,21 and modulate the kinetics of fusion pore formation22,23 via protein kinase C (PKC). The nonspecific kinase inhibitor staurosporine is reported to promote kiss-and-run exocytosis, possibly through inhibition of PKC6,24. We found that phorbol 12,13-dibutyrate (PDBU; 3 µM, 15–30 min) increased the total number of exocytotic events per stimulus (Table 1 legend), consistent with the ability of phorbol esters to increase the size of the readily releasable pool of SSVs17,18,25. In the presence of staurosporine (5 µM, 15–30 min), fewer amperometric events were recorded upon stimulation with K+/α–LTX, and no events were detected when K+ alone was applied. PDBU decreased the
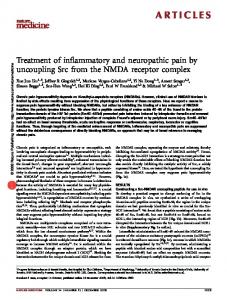
Figure 2 Amplitudes of flickers within complex events. (a) The amplitude (mean ± s.e.m.) of each flicker (Imax) is plotted against the flicker n. Only flickers from complex events with an Imax > 20 pA are shown because of the increased contribution of background noise to smaller flickers (∼3 pA r.m.s., hatched box; n = 21 complex events for untreated, 23 for PDBUtreated and 9 for staurosporine-treated; all were K+/α-LTX-stimulated events). (b) Dependence of flicker Imax on the fraction of total neurotransmitter released per pore opening. The mean values of the experimental data from untreated neurons (solid line, gray circles) yielded a slope of –4.7 ± 1.7 pA/flicker (mean ± s.d.), corresponding to the decrease predicted for release of 26 ± 9% of transmitter content (mean ± s.d.; r2 = 0.97).
342
VOLUME 7 | NUMBER 4 | APRIL 2004 NATURE NEUROSCIENCE
ARTICLES overlap of simple events could be due to the fusion of clustered SSVs where exocytosis of Simple events a single vesicle within a cluster would trigger t1/2 (µs) Number of Imax (pA) the fusion of other vesicles (Fig. 4b). In this dopamine molecules case, the average Imax for flickers within comK+ control 10,400 ± 1,000 35.2 ± 3.3 92 ± 6 plex events would be identical regardless of PDBU 8,300 ± 1,100 30.3 ± 2.9 76 ± 6* order (that is, Imax of flicker 1 = Imax of K+/α-LTX control 10,200 ± 1,500 17.7 ± 2.3 156 ± 30 flicker 2). In a variation of this model, exocyStaurosporine 14,000 ± 1,900 26.1 ± 5.1 164 ± 38 tosis could occur via the fusion of an SSV to PDBU 8,200 ± 1,000 25.7 ± 4.4 91 ± 4 another SSV that had already fused with the plasma membrane (Fig. 4c); in this case, later Complex events flickers would show an increased duration as complex t1/2 (µs) Inter-flicker Flickers/event Number of Imax (pA) a result of diffusional filtering and the diludopamine molecules interval (µs) tion of neurotransmitter inside the two fused + K control 23,700 ± 8,000‡ 26.9 ± 4.8 380 ± 43‡ 240 ± 27 2.06 ± 0.06 vesicles. As has been demonstrated for PDBU 25,800 ± 6,400*‡ 26.4 ± 2.2 461 ± 83‡ 293 ± 71 2.38 ± 0.22 LDCVs30, multiple SSVs might fuse with K+/α-LTX control 18,200 ± 4,900‡ 20.2 ± 4.2 507 ± 48‡ 261 ± 46 2.32 ± 0.03 each other before exocytosis, allowing the Staurosporine 26,400 ± 5,500‡ 33.2 ± 6.4 573 ± 61‡ 322 ± 24* 2.51 ± 0.19 vesicle contents to mix (compound exocytoPDBU 14,200 ± 2,300‡ 19.1 ± 3.2 291 ± 41**†‡ 165 ± 28** 2.19 ± 0.12 sis). The resulting vesicle would either proFor K+-stimulated neurons, the data are presented from untreated neurons (8 sites, 13 ± 4 events per site; mean ± duce a single peak or, if the SSV matrices or s.e.m.) and PDBU-treated neurons (7 sites, 77 ± 56 events per site). No events were detected from neurons treated cores remained intact after SSVs fusion, mulwith staurosporine when K+ alone was used as a secretagogue. For K+/α-LTX-stimulated neurons, the data are tiple peaks with similar amplitudes and durapresented from untreated (8 sites, 85 ± 50 events per site), staurosporine-treated (11 sites, 15 ± 7 events per site) and PDBU-treated neurons (9 sites, 94 ± 41 events per site). Data in the table are shown as mean ± s.e.m. for each tions (Fig. 4d). All of the above hypotheses recording site: *P < 0.05 and **P < 0.005 for PDBU or staurosporine versus control, †P < 0.05 for PDBU versus were contradicted by our experimentally staurosporine, ‡P < 0.05 for complex versus simple events by two-way ANOVA . Inter-flicker intervals are shown for complex events with Imax > 20 pA. determined Imax and t1/2 values of complex event flickers, which decreased sequentially (Fig. 2a and Table 2). In contrast to the above models of multiple SSV fusion, complex incidence of complex events from 15% to 10% (K+ alone) and from 20% to 6% (K+/α–LTX, Fig. 3), whereas staurosporine doubled the events could result from the fusion of a single SSV that forms a rapincidence of complex events to 40% (K+/α–LTX). The number of idly flickering fusion pore (Fig. 4e). In this case, the Imax of each subflickers per complex event did not significantly change according to sequent flicker would decrease because of the reduced SSV treatment or secretagogue used (Table 1). neurotransmitter concentration after each pore opening (Imax of flicker 1 > Imax of flicker 2). This hypothesis was supported by the DISCUSSION observed decrease in the average Imax of successive flickers within Over a decade ago, the amperometric detection of catecholamines complex events (Fig. 2a and Table 2), which corresponded to the released during exocytosis was first applied to chromaffin cells that release of ∼25–30% of the SSV neurotransmitter content per flicker contain LDCVs26. Subsequent studies used amperometry to detect for neurons in all treatment groups (Fig. 2b). The slight decrease in neurotransmitter release from SSVs in neuronal cell bodies13,14,27,28 the t1/2 of flickers within complex events (Table 2) is consistent with and central synaptic terminals10. Our measurements of dopamine random walk simulations, suggesting that this decrease is due to the released from terminals of cultured midbrain neurons show at least filtering applied to the data (data not shown). Although some studies show transient flickering of the fusion pore two types of amperometric events, which we labeled simple and complex. In contrast to simple events, which consisted of single ampero- in LDCVs31,32, the duration of SSV flickers observed here was considmetric peaks, complex events comprised 2–5 flickers that decreased erably shorter than reported for LDCVs (100–150 µs vs. sequentially in amplitude. Although it has long been remarked that exocytosis is not always an all-or-none event29, flickers have not been previously described for SSV exocytosis because other recording tech*# 40 niques do not provide sufficient time resolution to resolve flickers Control within complex events. PDBU Mechanisms of SSV exocytosis In Figure 4, we illustrate several possible mechanisms of exocytosis that could produce complex events. One scenario is that two or more SSVs may release their contents simultaneously, but at different distances from the recording electrode, thus producing overlapping simple events (Fig. 4a). Such an overlap would need to be well coordinated, as the incidence of complex events in untreated neurons was 200-fold greater than the probability that any two simple events would occur randomly within the duration of a complex event (Methods). In addition, the apparent duration of the events released farther from the electrode would be longer as a result of diffusional filtering (that is, t1/2 of flicker 1 ≠ t1/2 of flicker 2). Alternatively, an NATURE NEUROSCIENCE VOLUME 7 | NUMBER 4 | APRIL 2004
Complex events (%)
© 2004 Nature Publishing Group http://www.nature.com/natureneuroscience
Table 1 Characteristics of simple and complex events elicited by K+ and K+/α-LTX
64 160
Staurosporine 20 16 104
* 48 499
0
K+
130 662
*
52 843
K+ / α-LTX
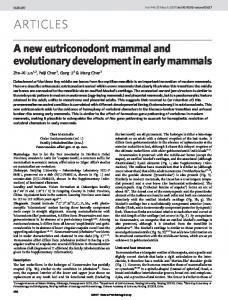
Figure 3 Pharmacological regulation of the incidence of complex events. The percentages of complex events are shown for each experimental condition. The numbers of complex events/total number of events are indicted within the bars. *P < 0.05 vs. control, #P < 0.005 vs. PDBU, by chi-square test. No events were detected after K+ stimulation of staurosporine-treated neurons.
343
ARTICLES Table 2 Characteristics of complex event flickers Flicker
© 2004 Nature Publishing Group http://www.nature.com/natureneuroscience
1st
Number of dopamine molecules 10,800 ± 800
2nd
7,500 ± 1,200*
3rd
6,000 ± 2,400*
Imax (pA)
t1/2 (µs)
18.4 ± 2.2
129 ± 13
14.2 ± 1.5*
110 ± 9
8.4 ± 1.9†*
91 ± 8*
Data are for flickers 1–3 from complex events with Imax > 20 pA in untreated neurons stimulated with K+/a-LTX (mean ± s.e.m.). *P < 0.05 compared with 1st flicker and †P < 0.05 compared with 2nd flicker.
transmitter content. Whereas full fusion of SSVs has been clearly demonstrated33, data from the present study and others7,8 suggest that some synapses primarily use kiss-and-run exocytosis. The presynaptic terminals of midbrain dopamine neurons contain a relatively small number of SSVs34 with an apparently high probability of exocytosis for any given vesicle35. Fusion pore flickering and kiss-and-run exocytosis may be particularly important for such synapses to prevent the loss of SSVs during full fusion and the relatively slow process of endocytosis and recycling.
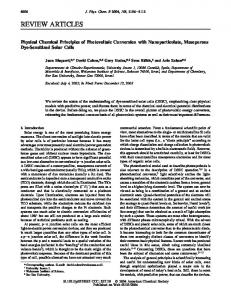
Figure 4 Mechanisms that may explain complex events (left column) and predicted averaged amperometric event shape (right column). (a) Overlap of simple events with spatial separation of release sites. Either vesicle could release first, resulting in either of the scenarios depicted on the right. The carbon fiber electrode (CFE) is 100 times wider than the diameter of the SSVs, and has been omitted in b–e. (b) Exocytosis of clustered vesicles. (c) Vesicle fusion with another vesicle that has already fused to the membrane. (d) If the vesicular matrices remain intact, compound exocytosis would occur without mixing of vesicular contents. If the matrices are labile, the contents would mix, resulting in a single amperometric peak. (e) Transmitter release from a single SSV via a flickering fusion pore.
10,000–500,000 µs, respectively). We also found that they occurred at a much higher frequency than in LDCVs (4,000 Hz vs. 170 Hz)32 and released a far greater fraction of the vesicle’s neurotransmitter (25–30% vs. 0.05; Table 1 and Fig. 1g). Interestingly, the first flicker within complex events was similar to simple events in amplitude (18.4 ± 2.2 vs. 17.7 ± 2.3 pA), number of molecules (10,800 ± 800 vs. 10,200 ± 1,500 molecules) and t1/2 (129 ± 13 vs. 156 ± 30 µs; Tables 1 and 2). These data suggest that simple events may generally represent neurotransmitter Figure 5 Simulated dopamine spillover in the striatum. (a) Diffusion profiles of dopamine released release through short-lived pores that are not from an SSV following one or three openings of the fusion pore (10,000 and 20,000 dopamine open long enough to release an SSV’s entire molecules released, respectively; Table 1) at 4 µm from the release site as determined by random neurotransmitter content, implying kiss- walk simulations. (b) Maximum dopamine concentrations reached at various distances from the and-run exocytosis. Complex events appear release site. The straight dashed line at 10 nM indicates the EC50 for the activation of dopamine 48 levels > 10 nM. to be exocytotic events in which the fusion receptors (1–20 nM) . (c) The duration that receptors are exposed to dopamine Dopamine spillover from a single flicker activates receptors in a 73,500 µm3 sphere (26 µm radius), pore either flickers (opens and closes) or with nearby receptors activated for 480 ms. If the SSV flickers three times, then the volume of the fluctuates (enlarges and constricts) several sphere is 1.7-fold larger (∼125,000 µm3, 31 µm radius) and the duration of receptor activation is times in rapid succession, resulting in the 620 ms. These calculations are based on vesicular dopamine concentrations in L-DOPA pretreated release of a larger fraction of an SSV’s neuro- neurons, which are 3–5 fold higher than in untreated cultures10.
344
VOLUME 7 | NUMBER 4 | APRIL 2004 NATURE NEUROSCIENCE
ARTICLES METHODS
© 2004 Nature Publishing Group http://www.nature.com/natureneuroscience
Rat ventral midbrain neuronal cultures. Postnatally derived ventral midbrain neurons were cultured as previously described40. Neurons were preincubated with 100 µM L-DOPA for 30 min prior to recording11. The secretagogues (92 mM NaCl, 40 mM KCl, 10 mM HEPES, 1 mM Na2HPO4, 2 mM MgCl2, 1.2 mM CaCl2, ∼300 mosm and pH 7.4 or 52 mM NaCl, 80 mM KCl, 10 mM HEPES, 1 mM Na2HPO4, 2 mM MgCl2, 1.2 mM CaCl2 and 20 nM α-LTX) were applied by local perfusion through a glass micropipette (Picospritzer, General Valve) for 6 s at 10 p.s.i. and ∼30 µm from the recording site. Amperometric recordings. A 5-µm diameter carbon fiber electrode held at +700 mV was positioned over a potential release site (Newport micromanipulator MX300R) and lowered until the tissue was slightly depressed10. At this potential, dopamine is oxidized, resulting in the donation of two electrons to the electrode. Thus, the number of molecules reaching the electrode can be estimated from the current38. The current was filtered using a 4-pole 10 kHz Bessel filter built into an Axopatch 200A amplifier (Axon Instruments), sampled at 100 kHz (PCI-6052E, National Instruments) and digitally filtered using a binomial 10 routine (Igor Pro, Wave Metrics) with a –3 dB cut-off of ∼15 kHz. This yielded an overall –3 dB cut-off frequency of >8 kHz and essentially no time distortion for the t1/2 of amperometric events with durations >50 µs. It also broadened events of shorter duration toward 50 µs41. Traces with root mean square (r.m.s.) noise less than 3 pA r.m.s. were analyzed. The background noise was normally distributed with no maxima for any frequency component between 0.6 and 33 kHz. No events were recorded when the applied voltage was adjusted to 0 mV or when the electrode was transiently lifted from an active recording site. Peak detection and flicker analysis. Raw amperometric data were collected and analyzed using a locally written routine in Igor Pro. The first derivative of the current trace (dI/dt) was used to detect amperometric events. The r.m.s. of the dI/dt noise was first measured in a segment of the trace that did not contain peaks. Then, dI/dt was used to detect events that were 4.5-fold larger than the r.m.s. noise. These spikes represented the total population of amperometric events. The beginning and the maximum of each event were at dI/dt = 0 (Fig. 1e,f). The end of an event was defined as the point when the current returned to the baseline value. If there was more than one maximum within an event and the dI/dt of these maxima (flickers) was three-fold larger than the r.m.s. noise, then the event was classified as ‘complex’ (Fig. 1f). Events that included a single peak with one rising and one falling phase or for which the dI/dt of flickers was less than three times the r.m.s. noise were categorized as ‘simple’ events. This approach was relatively conservative in identifying flickers, but the same rules were applied for each treatment. We found that the same flickers were identified independently of their order within a complex event. Due to the shape of complex events, the typical t1/2 value does not accurately reflect the event’s duration. Thus, the duration of complex events was calculated as:
complex = t 1/2
(t(fn) – t(f1) + t1/2(f1) + t1/2(fn) 2
cules (n) released during exocytotic events are distributed as a function of vesicle volumes so that the cube roots of n result in a normal distribution (Fig. 1g; for review, see ref. 38). As previously reported10, occasional large events (3 of 772 in untreated cultures) were >5 standard deviations greater than the geometric mean of the cube roots of n and were excluded from the data analysis in Table 1. The data in Figure 4 are nonparametric and were analyzed by chi-square test. Estimation of the expected random overlap of simple events. The probability that complex events resulted from the random overlap of simple events can be estimated from the exponential decay of interspike intervals38. The time constant was 545 ms (R2 = 0.997 from untreated cultures; Supplementary Fig. 1 online). The probability of observing an interspike interval less than 0.5 ms (two overlapping events within the duration of complex events) is P = (1– e–0.5/545) × 100 = 0.09%. Simulation of dopamine release from the vesicle. Random walk simulations38 (finite-difference model) of molecular diffusion to an amperometric (‘consuming’) electrode was performed using Excel software (Microsoft). During each time bin (tbin), the flux (J, molecules/s) of dopamine molecules from the vesicle through a fusion pore was calculated as: Nv [molecules] π · (Rpore [cm])2 · 4 · D[cm2/s] π · (Rv[cm])3 a · Cv · D 3 J= = b b[cm]
(2)
where a is the area, b is the length and Rpore is the radius of a cylindrical pore43. Cv and Nv are the concentration and the number of molecules of neurotransmitter in the vesicle with radius Rv. D is the diffusion coefficient, which is 6.9*10–6 cm2/s for dopamine in aqueous solution44. We used electron micrographs of tyrosine hydroxylase–immunolabeled cultures to determine SSV diameters under the conditions used in the recordings. SSV diameters were similar to those of previous reports11; 50.7 ± 1.4 nm (mean ± s.e.m., n = 49 vesicles in 7 terminals; data not shown). The length of the fusion pore was estimated as 7.5–15 nm, twice the membrane thickness of 5hydroxydopamine-labeled SSVs in this preparation11. The distance between the release site and electrode was varied from 50–400 nm, beyond which the amperometric currents would be too low in amplitude to be identified. The number of molecules (N) encountering the surface of the amperometric electrode during tbin was converted to units of amperometric current (I) using the following formula38:
I[pA/s] =
N[molecules] · 106[µs] tbin [µs] · 3.121 · 106 [molecules · s/pA]
(3)
where t(f1) and t(fn) are the times at Imax, and t1/2(f1) and t1/2(fn) are the durations of the first and the last flickers of complex events. The number of molecules in the first flicker was estimated by subtracting the integral of the subsequent flickers from the integral of the entire complex event. The baseline for the subsequent flickers was estimated as a line from the beginning of the second event to the end of the complex event. Although this approach may slightly overestimate the number of molecules in the first flicker as a result of the nonlinear decay of events, this error would be