(Bentler & Lee, 1978; Bloxom, 1968; Tucker, 1966) with some constraints (Browne, 1984). ..... Johnson, Smith, & Tucker, 1982. (n=100, T=5,M=2). McCabe ...
Copyright 1990 by the American Psychological Association, Inc. 002I-90IO/90/S00.75
Journal of Applied Psychology 1990, Vol. 75, No. 5,547-560
Assessing Method Variance in Multitrait-Multimethod Matrices: The Case of Self-Reported Affect and Perceptions at Work
This document is copyrighted by the American Psychological Association or one of its allied publishers. This article is intended solely for the personal use of the individual user and is not to be disseminated broadly.
Richard P. Bagozzi and \bujae Yi School of Business Administration, University of Michigan
Spector (1987) concluded that there was little evidence of method variance in multitrait-multimethod data from 10 studies of self-reported affect and perceptions at work, but Williams, Cote, and Buckley (1989) concluded that method variance was prevalent. We extended these studies by examining several important but often neglected issues in assessing method variance. We describe a direct-product model that can represent multiplicative method effects and propose that model assumptions, individual parameters, and diagnostic indicators, as well as overall model fits, be carefully examined. Our reanalyzes indicate that method variance in these studies is more prevalent than Spector concluded but less prevalent than Williams et al. asserted. We also found that methods can have multiplicative effects, supporting the claim made by Campbell and OXTonnell (1967,1982).
cedures (i.e, interpretation of correlations); their core ideas (Le, the use of multitrait-multimethod data and convergent and discriminant validity) are sound. Williams et al. reanalyzed the same data that Spector (1987) analyzed by using chi-square difference tests and variance partitioning with confirmatory factor analyses (CFA). Their analyses indicated that method variance is present and accounts for substantial variance in the measures originally examined by Spector. Williams et al.'s (1989) study was executed carefully with a powerful CFA approach. However, their findings are inconclusive because their procedure has several limitations. First, because their tests examined only overall effects of method factors, they failed to provide information about method effects on individual measures. Suppose, for example, that the chisquare difference test indicates significant method effects in an MTMM model with 10 measures. This omnibus test does not identify how many and which of the measures are significantly affected by the methods. For instance, a global test based on model fits can indicate significant method variance when only 1 of 10 measures is affected by the method factor. Although Williams et al. partitioned the variance into trait, method, and error variance at the scale level, they did not test the significance of the method variance either at the scale level or at the individual item level. Thus, Williams et al.fe study does not give diagnostic information for conclusions about individual measures in the MTMM matrix. Second, Williams et al. (1989) examined the chi-square goodness-of-fit test and the normed-fit index (NFI; Bentler & Bonett, 1980) but ignored other indicators, such as the adjusted goodness-of-fit index (AGFI), root-mean-square residual (rmr), standardized residuals, and improper estimates, which can provide useful information about model fit. For example, the chi-square test is sensitive to sample size and could possibly point to a satisfactory fit because of a lack of statistical power (e.g, Satorra & Saris, 1985). Likewise, when many trait and method factors are introduced into an MTMM model, a satisfactory chi-square may arise simply as a result of overfilling.
Researchers have often shown a substantial interest in assessing method variance with multitrait-multimethod (MTMM) matrices (e.g., Campbell & Fiske, 1959; Schmitt, Coyle, & Saari. 1977). As an artifact of measurement, method variance can bias results when researchers investigate relations among constructs measured with the common method. Because method variance provides a potential threat to the validity of empirical findings, it seems important to assess the extent to which method variance is problematic in typical research settings. Spector (1987) addressed this issue by examining a series of MTMM matrices in research on self-reported affect and perceptions of work. Following the classic procedure proposed by Campbell and Fiske (1959), Spector assessed the amount of method effects by comparing the correlations of different traits measured with the same method (i£, monomethod correlations) and the correlations among different traits across methods (i£., heteromethod correlations). The monomethod correlations were not significantly different from the heteromethod correlations, and Spector concluded that there was little evidence of method variance. Williams, Cote, and Buckley (1989) recently noted a number of limitations of this analytic procedure. As summarized by Schmitt and Stults (1986) and Widaman (1985), these limitations are (a) the lack of quantifiable criteria, (b) the inability to account for different reliability, and (c) the implicit assumptions underlying the procedure, especially the requirement of uncorrelated methods. It should be emphasized here that these limitations concern Campbell and Fiske^ (1959) analytic pro-
We would like to thank three anonymous reviewers for their helpful comments on the previous versions of this article. The financial assistance of the University of Michigan's School of Business Administration is also gratefully acknowledged. Correspondence concerning this article should be addressed to Richard P. Bagozzi or Youjae Yi, School of Business Administration, University of Michigan, Ann Arbor, Michigan 48109-1234. 547
This document is copyrighted by the American Psychological Association or one of its allied publishers. This article is intended solely for the personal use of the individual user and is not to be disseminated broadly.
548
RICHARD E BAGOZZI AND YOUJAE YI
One should evaluate a structural model by using all the measures of the overall degree of fit as well as information on individual parameters provided in any particular application. Finally, the CFA approach taken by Williams et al. (1989) is based on the assumption that variation in measures will be a linear combination of traits, methods, and error. That is, methods are presumed to have additive effects on measures in the CFA model. This may be a reasonable assumption and, in fact, can be tested as a hypothesis in any particular MTMM analysis. However, in certain contexts, traits and methods may interact in the determination of measure variation. Campbell and OXTonnell (1967) went so far as to suggest that such an interaction is "quite general in nature" (p. 421). The multiplicative relation occurs such that "the higher the basic relationship between two traits, the more that relationship is increased when the same method is shared" (Campbell & OXTonnell, 1982, p. 95). If methods do have multiplicative effects, then the CFA model is inappropriate for examining method effects. By using CFA models only, Williams et al. assumed that methods had linear effects for all of the data examined by Spector (1987) and ignored the possibility of multiplicative method effects. In fact, Williams et al. (1989) seem to have confused traitmethod interactions with trait-method correlations. For example, Williams et al. (1989, p. 463) asserted that their "analysis assumes that Trait X Method interactions do not exist (zero correlation among trait and method factors)." Also, their justification for the assumption, based on Widaman's (1985, p. 7) argument that correlations among trait and method factors "present both logical and empirical estimation problems of great magnitude," is misleading. The degree of association among traits and methods may be independent of the interaction between traits and methods, if any. One purpose of the present article was to investigate these important, but often ignored, issues. A second purpose was to correct any erroneous conclusions about method variance in and construct validity of the data examined by Spector (1987) and Williams et al. (1989). To do so, we incorporated the aforementioned issues into our analyses. The third purpose was to show that the analysis and interpretation of MTMM data are not straightforward endeavors but require a careful, detailed consideration of many criteria for model specification, goodness of fit, and other statistical findings.
Evaluation of Method Variance and Model Fit The general form of the CFA model for MTMM data can be expressed with two sets of equations (eg, JSreskog, 1974; Werts, J6reskog,& Linn, 1972): y=[ATA M ]
lM S = AT*,AT + AM*,Ai + 8,
(I) (2)
where y is a vector of r X s measures for r traits by j methods; AT and AM are factor-loading matrices for traits and methods, respectively (defined in the next sentence); >JT and ?|M are vectors of r traits and s method factors, respectively; t is a vector of residuals for y; 2 is the implied variance-covariance matrix for y; *T and *M are correlation matrices for traits and methods, respectively; 9 is the vector of unique variances for e; AT = [A! ,
A2, • • • , A, ]'; A/ is a diagonal matrix with factor loadings corresponding to the measures of the ith trait; and ~A,
•
•
•
0"
0
Aj •
0
•
•
0
0
0
•
0
X,
•
where A, is a vector of factor loadings corresponding to the measures obtained by the jtii method. Application of the CFA model to MTMM data permits one to partition variance into trait, method, and random error. These reside, respectively, in the squared factor loadings for AT and AM and in 6. Four CFA models can be tested and compared to yield meaningful tests of hypotheses about method and trait factors (Widaman, 1985): Model 1 hypothesizes that only unique variances are free (i.e, it is the null model); Model 2 hypothesizes that variation in measures can be explained completely by traits plus random error (i.e, it is the trait-only model); Model 3 hypothesizes that variation in measures can be explained completely by methods plus random error (i.e, it is the method-only model); and Model 4 hypothesizes that variation in measures can be explained completely by traits, methods, and random error (i.e, it is the trait-method model). Model 4 is, in fact, the hypothesis implied by Equations 1 and 2. Models I though 3 are special cases formed by constraining certain parameters of Model 4. Notice that the null model is nested in both the method-only and trait-only models and that the method-only and trait-only models are nested in the traitmethod model. Consequently, chi-square difference tests can be used to test whether trait, method, or trait and method factors are present. For example, a test of method variance is provided by comparing Models 1 and 3 as well as Models 2 and 4. The chi-square difference test is an omnibus test that indicates whether or not measures are significantly affected by methods (or traits). In many cases, however, one may wish to determine how many and which of the measures are responsible for the global significance. Moreover, the method effects should be meaningful and interpretable (e.g., Browne, 1984). For this purpose, an inspection of the loadings linking method factors to individual measures is useful because loadings in AM represent method-related variance for each measure (Widaman, 1985). Thus, an examination of loadings for method factors will provide useful information as to how often the method effects are significant at the individual item level and whether or not they are meaningful and interpretable. Multiplicative Effects of Methods It has been suggested that method factors may interact with trait factors in a multiplicative way (eg, Campbell & O^onnell, 1967,1982;Schmitt&Stults, 1986). That is, the higher the relationship between traits, the higher the method effects. Swain (1975) proposed the following direct-product model (DPM) to represent the multiplicative interaction of traits and methods in an MTMM analysis: 2=SM®2T,
(3)
where 2 is the covariance matrix of the observed variables, SM and S, are method and trait covariance matrices, respectively, and © indicates a right direct (Kronecker) product.
549
METHOD VARIANCE
This model expresses the covariance matrix of measurements as the direct product of a covariance matrix of methods and a covariance matrix of traits. However, this model has several limitations. It does not allow for measurement errors or different scales for different variables, which can limit the applicability of the model in many MTMM studies. Browne (1984, 1989) therefore extended the DPM to overcome these limitations (see also Cudeck, 1988) as follows:
This document is copyrighted by the American Psychological Association or one of its allied publishers. This article is intended solely for the personal use of the individual user and is not to be disseminated broadly.
2 = Z(PM ® PT 4- E)Z,
(4)
where Z is a nonnegative definite diagonal matrix of scale constants, some of which are set equal to unity to achieve identification; PM and PT are nonnegative definite method and trait correlation matrices, respectively, whose elements are particular multiplicative components of common score correlations (i.e., correlations corrected for attenuation); and E is a diagonal matrix of nonnegative unique variances. The DPM in Equation 4 is called the heteroscedastic error model and is equivalent to a three-mode factor analysis model (Bentler & Lee, 1978; Bloxom, 1968; Tucker, 1966) with some constraints (Browne, 1984). It can be seen that Equation 4 decomposes test scores into true scores plus error-score components. Under Equation 4 the correlation matrix corrected for attenuation has a direct-product structure, P M ®P T ,
(5)
where Pc is the disattenuated correlation matrix with a typical element p(TjM t , T,-M/); PM is the latent method correlation matrix with a typical element p(M t , M,); and PT is the latent trait correlation matrix with a typical element p(T,, T,). From the definition of a right direct product, one can then see that a typical element of Equation 5 is p(T,Mt,
p(T,, Ty)p(Mt, M,).
(6)
Notice that this equation assumes a multiplicative structure for true scores or common scores in the factor analysis sense, rather than for observed scores. Browne (1985) has developed a program, MUTMUM, to estimate the parameters in the DPM, but the program has not been widely used, perhaps because of its limited distribution. Wothke and Browne (1990) have recently shown that the DPM can be reformulated as a linear model, allowing researchers to estimate the model by using the widely available LISREL program. Specifically, Equation 4 can be written as a second order confirmatory factor analysis model as follows: 2=
where A = Z, r is the partitioned matrix
= (r,|T2),
(8)
CM is a square, lower triangular matrix chosen such that PM = CMQ,, I, and !„, are identity matrices, and
(9) The DPM can be easily restricted to suitable submodels. One useful version of the model, a composite error model, is defined by the additional restriction
E=E
(10)
with EM and ET diagonal. By using the fact that any symmetric, nonnegative definite matrix can be expressed as the product of a square matrix and its transpose (e.g, Searle, 1982), this restriction can be rewritten as follows:
E = (EM"2 ® i,)(im © E T )(
r;. a o
Several restrictions are needed for the identification of the DPM. First, one equality constraint per method is required for identification of scale factor estimates (Wothke & Browne, 1990). This restriction will fix the scale of the component scores. For instance, one may select a trait and set all its scale factors in Z equal to unity Alternatively, one can constrain all diagonal elements of CM to unity. The two types of restriction may be suitably combined. Another restriction is required to fix the scale of the error components because (aEM ) ® (iET ) equals EM ® ET for any a equal to 1 / b. This may be achieved by fixing one element in either EM or ET at unity. PT is directly estimated in the model, and standard errors of its elements will be available from the LISREL solution. In contrast, the estimate of PM is obtained by rescaling CMC£,into a correlation matrix, and standard errors are not available from the LISREL output. However, one can obtain the standard errors for the method correlations by employing an alternative parameterization in which PM (rather than PT ) is directly estimated. Under the multinormality assumption, the model fit can be evaluated by using the maximum-likelihood chi-square statistic, computed as X 2 = (;V-l)[ln|Z| -ln|S| + trace (S2T 1 )-™],
(12)
where N is the sample size, and r and i are the number of traits and methods, respectively. The corresponding degrees of freedom are computed as \rs (rs + 1 )/2] — k, where k is the number of free parameters to be estimated in the model. Campbell and Fiske^ (1959) original criteria for convergent and discriminant validity have the following direct interpretations in the DPM (Browne, 1984, pp. 9-10). Evidence for convergent validity is achieved when the correlations among methods in PM are positive and large. The first criterion for discriminant validity is met when the correlations among traits in PT are less than unity. The second criterion for discriminant validity is attained when the method correlations in PM are greater than the trait correlations in PT . The final discriminant validity criterion is satisfied whenever the DPM holds. These interpretations follow from the DPM specification. Recall that p(T,Mt, T,M,), a typical element of Pc, denotes the disattenuated correlation between the /th trait measured with the fcth method and the ./th trait measured with the fth method. From Equation 6, p(T,M4, T,M,) equals p(T,, T,) p(Mk, MI). Campbell and Fiskels (1959) criterion for convergent validity is that the monotrait-heteromethod correlations should be substantially greater than zero. When the monotraitheteromethod correlation p(T,M t , T>M,) is examined under the DPM, it can be seen that p(T,M t , T,M,) =
t,
M,) = p(M t , M,). (13)
That is, the monotrait-heteromethod correlations are equal to method correlations under the DPM. As a consequence, con-
550
RICHARD P BAGOZZI AND YOUJAE YI
vergent validity is achieved when method correlations are large and positive. The first criterion for discriminant validity is that the monotrait-heteromethod correlations, p(T,Mt, T,M,), should be greater than the corresponding heterotrait-heteromethod correlations, p(T,Mt, T^M,) andp(T,.Mt, T,M,), fori^j. One can see that p(T,M 4 ,T,M,)/p(T,M t> T,M,)
This document is copyrighted by the American Psychological Association or one of its allied publishers. This article is intended solely for the personal use of the individual user and is not to be disseminated broadly.
= p(T,Mk, T,M,)/p(T,.Mt) T,M ( )
(14)
That is, the ratios of a monotrait-heteromethod correlation to the heterotrait-heteromethod correlations become trait correlations under the DPM. Thus, the first criterion for discriminant validity is met when trait correlations are less than unity The second criterion is that the monotrait-heteromethod correlations, p(T,M t , T,M;), should be higher than the corresponding heterotrait-monomethod correlations, p(T,M t , TjM t ) and XTjMj, T,M ( ). From Equation 6, it can be seen that p(T,Mt, T,Mt)/p(T,Mt, T f M,) = p(T,-M,, T,M;)/p(T,Mt, T,M,)
(15)
= p(T f ,T,.)/p(M t ,M,). That is, the ratios of monotrait-heteromethod correlations to heterotrait-monomethod correlations become the ratios of trait correlations to method correlations under the DPM. As a consequence, this criterion is met when the method correlations are greater than the trait correlations. The final criterion is that all matrices of intertrait correlations should have the same pattern whichever methods are used. This criterion is met whenever the DPM holds because the ratio p(T,-Mt, T;M;)/p(TmMt, T.M,) = p(T,., T,-)/p(Tra, T.) (16) has the same value for any M t and M;. The DPM hypothesizes multiplicative effects of methods and traits such that sharing a method exaggerates the correlations between highly correlated traits relative to traits that are relatively independent. That is, the higher the intertrait correlation, the more the relationship is enhanced when both measures share the same method, whereas the relationship is not affected when intertrait correlations are zero. An important question then arises: What processes underlie the multiplicative effects of method factors? One view might be called differential augmentation (Campbell & O'Connell, 1967, 1982). In this view, multiplicative effects are a functional interaction between the "true" level of trait correlation and the magnitude of method bias. A conventional position is that method factors add irrelevant systematic (method-specific, trait-irrevelant) variance to the observed relationships. That is, sharing a method is expected to augment or increase the correlations between two measures above the true relationship; halo effects and response sets provide evidence for such method bias. However, not all relationships are likely to be equally exaggerated by shared method. Only relationships that are large enough to get noticed are more likely to be exagger-
ated. Campbell and OX:onnell (1967, pp. 421-422) provide an example of such effects when ratings (eg, self-ratings and peer ratings) are used as methods. Each rater might have an implicit theory (expectations) about the relationships (co-occurrence) of certain traits, which will lead to a rater-specific bias. In such cases, the stronger the true associations between traits, the more likely they are to be noticed and exaggerated, thus producing the multiplicative-method effect pattern. In summary, method factors augment or exaggerate the observed correlations differently, depending on the level of true trait relationships. The differential attenuation perspective (Campbell & O'Connell, 1967,1982) offers another explanation for multiplicative-method effects. A conceptual basis for this view is that using different methods will attenuate the trait relationships better represented when method is held constant rather than varied. Not sharing a method attenuates the true relationship so that it appears to be less than it should be; that is, methods are seen as diluting trait relationships rather than adding irrelevant systematic variance. From the differential attenuation perspective, not sharing a method attenuates the observed correlations differently depending on the level of true trait relationships. Suppose, for example, that multiple occasions are used as methods. It is often found in longitudinal studies that correlations are lower for longer time lapses than shorter lapses, following a so-called autoregressive process. In this process, a high correlation between two traits will be more attenuated over time than a low correlation (for more details, see Campbell & O'Connell, 1982, pp. 100-106). In contrast, a correlation of zero can erode no further, and it remains zero when computed across methods (here, occasions). The traditional concept of attenuation as due to the unreliability of measures shows a multiplicative pattern because high correlations are more attenuated by unreliability than low ones. See Campbell and OXtonnell (1982) for a detailed discussion of these two explanations for multiplicative effects. In summary, in the CFA model and the DPM, different functional forms are hypothesized for trait and method effects: in the former, additive effects are assumed, whereas in the latter, multiplicative effects are assumed. In principle, the two models constitute alternative explanations for MTMM data. Specifically, the effects of a method are hypothesized to be constant in the CFA model. In contrast, method effects are hypothesized to vary with the level of trait correlations in the DPM. Although Campbell and O'Connell (1967,1982) implied that trait and method interactions are the rule rather than the exception, it might be better in any specific case to examine which (additive or multiplicative) model is more appropriate. Ideally, one should have substantive expectations about the method effects prior to selecting a model. If no prior expectations are available, the researcher should test both models to discover which process is at work.
Method For each of the 10 studies (11 data sets) examined originally by Spector (1987) and later by Williams etal. (1989), four CFA models (Models 1 to 4) were fitted by following the procedures suggested by Widaman (1985; see also Williams et al, 1989). Figure 1 provides an exam-
551
This document is copyrighted by the American Psychological Association or one of its allied publishers. This article is intended solely for the personal use of the individual user and is not to be disseminated broadly.
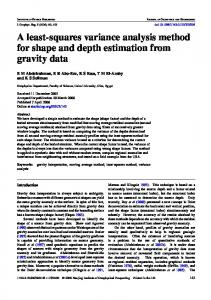
METHOD VARIANCE pie of the full CFA model (i.e. Model 4) for MTMM data with three traits and three methods. It can be seen that Models 1 through 3 are derived from Model 4 by constraining certain parameters. The effects of method factors were examined in two ways. First, we compared the hierarchically nested models to determine whether the introduction of method factors improved the fit of the model. Specifically, Model 1 (null) was compared with Model 3 (method only), and Model 2 (trait only) was compared with Model 4 (trait and method). Second, we examined the specific effects of method factors by examining the statistical significance of the individual-method factor loadings. For each measure, the method factor loading indicates the effect of the method factor, and the square of the loading indicates the percentage of variance due to the method factor (Widaman, 1985). Thus, the significance of factor loadings was examined to determine whether the method variance was significant. As noted earlier, we also tested the possibility that Trait X Method interactions exist. In this regard, the DPMs were fitted on the basis of the procedures proposed by Wothke and Browne (1990). Because the causal diagram for the LISREL operationalization is quite cumbersome (e.g, there are 27 latent variables alone for the smallest model with three traits and three methods), we have not provided a figure. However, the Appendix contains the input program needed to perform a DPM analysis of the data found in Gillet and Schwab (1975). Marsh and Hocevar (1988) recently introduced a new, powerful approach to MTMM analyses that uses hierarchical confirmatory factor analysis. As an alternative to CFA, this procedure explicitly partitions total variance into additive components for random measurement error, variance specific to each trait-method combination, variance common to a trait across methods, and variance common to a method across traits. Unlike the CFA model or the DPM, however, the approach requires multiple measures for each trait-method combination. Because none of the data sets reported in the studies considered satisfied this requirement, we did not use this approach in our study. All statistical analyses were performed with the LISREL 7 program (Joreskog & Sorbom, 1989), given the widespread use of LISREL among researchers (e.g., Bagozzi, 1980; Widaman 1985). LISREL 7 provides several advantages over earlier versions (e.g, LISREL 6); for example, the correct formula for the asymptotic variances of the residuals is
Figure 1. An illustration of the confirmatory factor analysis model for multitrait-multimethod designs with three traits and three methods.
used, and an error in the computation of the AOFI has been corrected. Throughout our analyses, the models were evaluated with multiple indicators of goodness of fit. These indicators included (a) chi-square tests, (b) AGFI, (c) rmr, (d) the number of large standardized residuals, and (e) the number of improper estimates (these will be discussed later).
Results The results of the four CFA models discussed earlier are presented in Table 1. The descriptions of the four data sets are different from those provided by Spector (1987) and Williams et al. (1989). Specifically, the sample size is 111 (not 302) and 723 (not 941) for Alderfer (1967) and Sims, Szilagyi, and Keller (1976), respectively, and the number of traits is 4 rather than 5 for both Dunham, Smith, and Blackburn (1977) and Gillet and Schwab (1975). We made these corrections after closely inspecting the data given in the original articles. For example, only four traits are common across methods in Dunham et al. (1977, p. 429), contrary to the description given by Williams et al. (1989, p. 465). Although convergence failures were common when both method and trait factors were included in CFA models, we were nevertheless able, by judicious choice of starting values, to achieve satisfactory solutions in most instances. The first thing to notice is that the CFA model with traits and methods fit 10 of the 11 MTMM data sets quite well, as shown in the last column in Table 1. This conclusion is based on an interpretation of the chi-square goodness-of-fit tests alone. Later we scrutinize additional goodness-of-fit measures and other diagnostic criteria that make this interpretation problematic. The chi-square difference tests based on comparison of two sets of nested models are presented in Table 2. The comparison of Model 1 and Model 3 showed that the introduction of method factors significantly dropped the chi-square value in each data set, indicating that meaningful improvements over the null models were achieved (see the first column in Table 2). The comparison of Model 2 and Model 4 also showed that the introduction of method factors provided significant improvements over the trait-only models for all data sets except Spector (1985). Notice that the two chi-square difference statistics are generally quite different in their magnitude (eg, 1,096.8 vs 53.1 for Meier, 1984) although they have the same degrees of freedom. It is thus possible that two chi-square difference tests can lead to different conclusions. Indeed, for Spector's(1985)data, the comparison of Model 1 with Model 3 yielded a significant chi-square difference test, whereas the comparison of Model 2 with Model 4 yielded a nonsignificant chi-square difference test. Thus, a question arises: Which chi-square difference test should be used to assess method effects? We believe that the test should be based on the comparison of Model 2 with Model 4 for two reasons. The first reason stems from the definition of method variance. Campbell and Fiske (1959) defined method variance as variance attributable to measurement method rather than to the constructs of interest. This definition suggests that method variance refers to the variance that cannot be explained by traits but that is explained by methods. Second, the baseline model should be chosen from the set of meaningful models that researchers already accept as valid (Sobel & Bohrn-
552
RICHARD R BAOOZZI AND YOUJAE YI Table 1 Results of Confirmatory Factor Analysis of Multitrait-Multimethod Matrices Applied to Data Summarized in Spector (1987) Model 1 Study
2
Model 4
2
df
x2
df
x
260.8*
45
46.2*
25
119.2*
34
12.9
14
6,799.7*
120
1,850.1*
98
2,659.6*
98
258.0*
76
710.1*
28
39.2*
14
259.4*
19
6.1
5
528.3*
45
77.1*
25
204.5*
34
10.4
14
774.8»
45
50.5*
25
435.0*
34
6.5
14
926.2'
45
34.6
25
376.9*
34
13.9
14
1,264.2*
45
48.7*
25
199.8*
34
13.0
14
485.7*
45
25.6
25
218.4*
34
10.4
14
682.9*
28
58.9*
14
214.5*
19
2.6
5
1,082.4'
28
78.6*
14
259.7*
19
11.5
6
1,682.3*
36
64.8*
24
585.4*
24
11.7
12
(n=100, T=5,M=2) This document is copyrighted by the American Psychological Association or one of its allied publishers. This article is intended solely for the personal use of the individual user and is not to be disseminated broadly.
2
df
X
Alderfer, 1967 (n = l l i , r = 5 , M = 2 ) Dunham, Smith, & Blackburn, 1977 (n = 622, T = 4 , W = 4 ) Gillet& Schwab, 1975 (n=273,r=4,M=2) Johnson, Smith, & Tucker, 1982
Model 3
Model 2 df
X
McCabe, Dalessio, Briga, & Sasaki, 1980 (Study 1)
(n = 82, T=5,M=2) McCabe et al, 1980 (Study 2)
(n = 82, T=5,M=2) Soutar& Weaver, 1982 (n = 242, T = 5 , M = 2 ) Spector, 1985 (n=102, T = 5 , M = 2 ) Pierce & Dunham, 1978 («=155, !T=4, M = 2 ) Sims, Szilagyi, & Keller, 1976 (n = 723. 7"=4, M = 2 ) Meier, 1984 (n = 320, T = 3 , M = 3 )
Note. Model 1 is the null model; Model 2 is the trait-only model; Model 3 is the method-only model; and Method 4 is the trait-method model. T- number of trait factors; and M= number of method factors. * p