Asynchronous Sampling for Optical Performance Monitoring. Sarah D. Dods,
Trevor B. Anderson, Ken Clarke, Masudazzaman Bakaul, and Adam Kowalczyk.
OMM5.pdf
Asynchronous Sampling for Optical Performance Monitoring Sarah D. Dods, Trevor B. Anderson, Ken Clarke, Masudazzaman Bakaul, and Adam Kowalczyk National ICT Australia, Victorian Research Laboratory, Building 193, The University of Melbourne, VIC 3010, Australia
[email protected]
Abstract: We present two novel performance monitoring techniques for optically switched networks, based on asynchronous multi-tap sampling. We show that multiple simultaneous impairments can be separated and quantified by a single monitor. ©2007 Optical Society of America
OCIS codes: (060.4510) Optical communications; (060.2360) Fiber optics links and subsystems
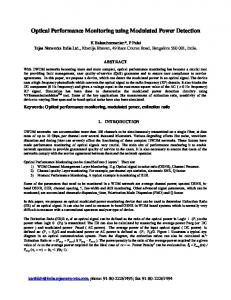
1. Introduction The transparency of optical networks is increasing, due to the ever-increasing global demand for bandwidth, and the ongoing development and maturation of the underlying optical communications technology [1, 2]. Distance transparency is increasing, in that data can now be transmitted optically over thousands of kilometers between regeneration points. Path transparency is increasing, in that the optical transmission paths may pass through many network elements, including optical filters, optical switches and optical amplifiers. Bit rate transparency is increasing, in that a single fiber may now transport multiple DWDM channels at different data rates. Format transparency is increasing, in that the drive to improve system performance over long distances has spawned a plethora of new formats based on both phase and amplitude modulation. The multiple bit rate channels that may be transported in a single fiber may also have different formats [3]. Protocol transparency is also increasing, in that Sonet/SDH has now been joined by Ethernet standards, and other protocols are continuing to emerge (e.g. [4]). This combination of factors means that there will be limited points within transmission systems where electronic access to the underlying data is available to monitor the health of each channel. The current deployment of the first reconfigurable optical add-drop multiplexers (ROADMs) is also bringing to an end the concept of an optical transmission system as a simple data pipe [5]. The introduction of optical switching to the physical layer changes the nature of optical links from closed systems, with fixed transmitters, paths, and receivers, to open systems, where many different combinations of transmitter, path and receiver are possible. Designing optical networks to guarantee satisfactory operation for all possible routes within an open system is likely to add unsustainable costs. To overcome this problem, the additional flexibility and network utilization offered by ROADMs will be offset by increased complexity in network operation and management. Feedback and measurements of the optical network characteristics will become much more important as the evolution toward automated, intelligent networks continues, necessitating the development of a new suite of optical performance monitoring techniques [6]. In this paper, we review the development of several new ROADM-compatible optical performance monitoring techniques, and show how they can add value to network operation and management. 2. Optical Signal to Noise Ratio (OSNR) Monitor Amplified spontaneous emission (ASE) from optical amplifiers is perhaps the most ubiquitous of optical impairments. Unlike distortions such as polarization mode dispersion and chromatic dispersion, ASE adds true noise to the signal, and there is currently no method of removing or compensating for its presence [5]. The requirements for an OSNR monitor are low cost, immunity to other impairments, and increasingly, compatibility with ROADMs. Traditional methods fail on this last point, as they are based on estimating the ASE from the optical power at frequencies between the wavelength channels. The optical filters within ROADMs remove this background power, and optical switching can make ASE levels in neighboring channels discontinuous [7]. A number of new techniques have been proposed to directly measure the OSNR within the channel, based on methods including polarization effects [8], RF spectral content [9, 10], and asynchronous histograms [11]. The OSNR monitor we have developed is based on polarization effects, but measures signal-spontaneous beat noise, rather than the spontaneous-spontaneous beat noise in [8]. A diagram of the technique is shown in Figure 1. The channel to be monitored has a well defined polarization state, and is divided by a polarization beam splitter (PBS) according to its alignment with the polarization axes. The ASE is unpolarized and so divides evenly between the two paths. Low bandwidth detectors receive the two PBS outputs, and digital signal processing is used to remove the signal component, leaving the signal spontaneous beat noise. The digital signal processing defines all
OMM5.pdf
2 2IsIASE γ +
-
PBS
γ G= 1- γ
G
(1-γ)Ps+ ½ PASE
IASE + Ith 2(1- γ )
In-band OSNR (dB)
32
γPs+ Detectors ½ PASE
27
No PMD, 800ps/nm CD 30ps PMD, No CD No PMD, No CD
22
17
12
7 7
12
17
22
27
32
OSNR from OSA (dB)
(a)
(b)
Fig. 1: In-band OSNR measurement: (a) technique, (b) RF spectrum of noise floor with PMD, and (c) OSNR measurements which are immune to PMD and chromatic dispersion.
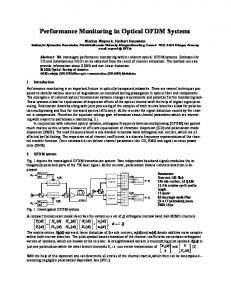
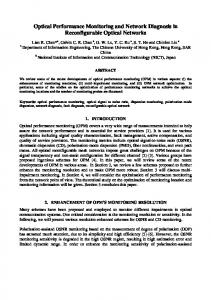
patterns that are common to the two paths as signal, and removes these elements. This has the advantage of allowing extreme signal distortion due to undersampling by the receivers, as well as making the method bit rate and modulation format independent. The low bandwidth detectors have other advantages. Chromatic dispersion and polarization mode dispersion (PMD) are intrinsically high bandwidth effects, so that their effects are removed by the low pass filtering. Fig. 1(b) demonstrates the immunity of the technique to chromatic dispersion and first order PMD. Also, at low bandwidths, the manufacturing tolerances on the path length differences are greatly relaxed. Length differences of up to 15cm were found to not affect measurement accuracy. Finally, they provide a significant cost advantage. The combination results in a low cost, robust, ROADM-compatible OSNR monitoring technique. 3. Multi-impairment monitor As optical networks become more complex, the need to monitor more than just channel wavelength, power and OSNR becomes compelling. The next range of impairments of interest is given in [1] as PMD, four wave mixing, chromatic dispersion and slope, reflections, laser noise, and both inter-channel and interferometric crosstalk. Q factor and timing jitter are also useful as measures of the signal quality. Many techniques have been proposed to measure different subsets of these measurements. Eye diagrams to date have been the most generic technique, but require clock recovery, which is format and bit-rate dependent, and can be difficult to extract for strongly distorted signals. We have developed an alternative to the eye diagram based on asynchronous delay-tap sampling [12]. By sampling the optical waveform in pairs with a known physical delay as shown in Fig. 2, information-rich patterns called phase portraits can be extracted without requiring clock recovery. The information content can be further enhanced by varying the delay between the samples. For example, delays much shorter than the bit period highlight the gradient of the waveform, while delays of around half a bit period emphasize the more general rise and fall times. One bit delays can separate and isolate different bit combinations for analysis. Unique patterns that occur for different ratios of the delay to the bit period offer a means of bit rate identification, which is sufficient to differentiate between different overheads and protocols for 10 Gbit/s transmission, as well as identifying 2.5 Gbit/s, 10 Gbit/s and 40 Gbit/s line rates. The various amplitude-based modulation formats such as RZ and NRZ also produce different signatures, additionally enabling format identification [13]. By analyzing the phase portraits, we can extract not only the signal quality through Q and jitter, but also the underlying cause of signal degradation, whether it is OSNR, chromatic dispersion, PMD, filter dispersion, or some combination, as shown in Figure 3.
Ts
Ts
s e c o n d (d e la y e d ) s a m p le x
Δt
y3
x2 y2 x1
x3
y1
0.5 0.4
y
0.3 0.2 0.1
0
100
200
300
400
500
Time
600
700
800
900
100
0
0
0.1
0.2
x
0.3
0.4
0.5
0
Fig.2: Delay-tap asynchronous sampling, showing three sample points. Ts = sampling period, Δt = time offset within each sample. The two-tap scatter plot to the right shows y plotted against x for each sample pair, with Δt = bit period/8.
OMM5.pdf
Fig.3: Monitor vs. actual values of various impairments and signal quality measures, for simultaneous mixtures of OSNR, chromatic dispersion, PMD and filter offset, from 10 Gbit/s NRZ simulations.
4. Enabling Network Automation The drivers for monitoring optical impairments come down to the economics of automating network operation and management [5, 6]. The essential features of network management that require feedback through optical performance monitoring are the provisioning of new services, monitoring and protection of service level agreements, fault diagnosis and location, and network optimization. Signal quality measurements provide useful feedback for adjusting network parameters, but understanding the causes of signal quality allows for smarter, faster optimization. Monitoring the various impairments over time, as well as signal quality, provides far more useful information for diagnosing the cause of developing trickle errors, before they become critical faults. Finally, Q monitoring is not sufficient for setting up new services because the change in signal quality along any given link depends not only on the Q at the start of the link, but also the cause of the Q value. Two paths through the network to the same point can result in the same Q value, due to different impairments. For example, one could have significant residual chromatic dispersion, while the other has poor OSNR. If both signals continue through a subsequent link with high dispersion, the signal that already has significant dispersion will be much more strongly affected. Existing route-finding algorithms are based on simple metrics such as number of hops or bandwidth utilization [14]. Devices such as the multi-impairment monitor will provide essential information about the network to input to more sophisticated routing algorithms based on optimizing received signal quality. 5. Conclusions We have discussed the drivers behind optical performance monitoring, and presented new asynchronous monitors that will aid in the evolution of optical communications from data pipes to intelligent networks. We have explained the value of monitoring the causes of signal degradation, as well as monitoring signal quality. We have demonstrated that multiple simultaneous impairments can be separated and quantified by a single monitor. Finally, we have shown how this monitoring capability can be used to enable the key functions required for network automation. References [1] I.T.U.-T, "Recommendation G.697 - Optical monitoring for DWDM systems." Geneva: International Telecommunication Union, 2004. [2] K. Hinton, "Histogram analysis for optical monitoring," paper MoB1-2, presented at COIN/ACOFT 2003, Melbourne, Australia. [3] M. Birk et al., "Field trial of a 40 Gbit/s PSBT channel upgrade to an installed 1700 km 10 Gbit/s system," paper OTuH3, presented at OFC/NFOEC, 2005. [4] P. A. Humblet, "Metro area optical networks: technologies and trends," paper WD3, presented at LEOS 2001. [5] C. P. Larsen and P. O. Andersson, "Signal Quality Monitoring in Optical Networks," in SPIE Opt. Networks Magazine, vol. 1, 2000, p. 17. [6] D. C. Kilper et al., "Optical performance monitoring," J. Lightwav. Technol., vol. 22, pp. 294-304, 2004. [7] Y. C. Chung, "Polarization-nulling method for monitoring OSNR in WDM network," paper OThP3, presented at OFC 2006, Anaheim, USA. [8] J. H. Lee et al., "OSNR monitoring technique using polarization-nulling method," IEEE Photon. Technol. Lett., vol. 13, pp. 88-90, 2001. [9] W. Yang and J. H. Sinsky, "Radio-frequency spectral analysis for SONET framing recognition and performance monitoring," J. Opt. Networking, vol. 1, pp. 74-79, 2002. [10] H. Stuart, "Signal-to-noise ratio monitoring of optical data using narrowband RF analysis at the half-clock frequency," paper WP5, presented at OFC 2003. [11] N. Hanik et al., "Application of amplitude histograms to monitor performance of optical channels," Electron. Lett., vol. 35, pp. 403-404, 1999. [12] S. D. Dods and T. B. Anderson, "Optical performance monitoring technique using delay tap asynchronous waveform sampling," paper OThP5, presented at OFC/NFOEC 2006, Anaheim, USA. [13] K. Clarke et al., "Monitoring of chromatic dispersion for 10 Gbit/s RZ modulation using asynchronous sampling," paper, presented at ACOFT 2006, Melbourne, Australia. [14] G. Bernstein et al., Optical network control: architecture, protocols and standards: Addison Wesley, 2004.