AUTOMATED RESPIRATORY PHASE DETECTION BY ACOUSTICAL MEANS Joo S. Chuah , Zahra K. Moussavi Department of Electrical and Computer Engineering, University of Manitoba, Winnipeg, Manitoba, R3T 2N2, Canada
[email protected] ,
[email protected]
ABSTRACT - This study focuses on the automation of acoustical respiratory phase detection process without the aid of airflow measurement. Instead of measuring the airflow, a computerized algorithm was developed to detect respiratory phases using the breath sound signals recorded from both the chest and trachea. 17 sets of normal breath sound signals were used to test the accuracy of the phase detection algorithm. 93% of phase detection accuracy and 100% of breath onset detection accuracy were achieved in the fully automated mode. The detection of respiratory phases by acoustical means simplifies the experimental apparatus as well as provides accurate timing of breaths. Keywords : Respiratory phases, Breath sound signals, Chest sounds, Tracheal sounds, Airflow.
I. INTRODUCTION The detection of respiratory phase is essential in swallowing studies on children with swallowing disorders [1]. Traditionally, respiratory phases are determined by direct airflow measurement [2]. However, techniques recommended for accessing the airflow are not applicable to children with both significant neurological impairments and swallowing disorders [3]. Therefore, a more reliable, noninvasive method is necessary for the detection of respiratory phases. A non-invasive method has been proposed as an alternative of airflow measurement [4]. The proposed method suggests that respiratory phases can be detected from the power spectra of chest signals and tracheal signals. Previous studies have shown that breath sounds recorded from the chest have greater intensity during inspiration than during expiration [5]. With an appropriate frequency range, the peaks of average power spectra of chest signals match with the midpoints of respective inspiration phases [3]. Based on these results, chest signals can be used to detect the peaks of inspiration phases. On the other hand, compared to chest signals, tracheal signals require a lower minimum critical airflow to produce detectable breath sounds during expiration [6]. Therefore, tracheal signals can be used to detect the onsets of breaths [4].
The main objectives of this study are: • to further enhance and improve the phase detection algorithm using breath sound signals of healthy subjects. • to develop a C++ based software application that serves as a foundation for the phase detection program.
II. METHODS A. Subjects and Data 17 sets of tracheal sounds and chest sounds recorded from the best recording locations of 11 healthy subjects (aged 4-35) were used to test the phase detection algorithm. The best recording locations on the chest are the left midclavicular 2nd interspace (LMC) and the right midclavicular 3rd interspace (RMC), where the average inspiration (I) and expiration (E) power difference are the greatest [4]. These signals were recorded during a previous study [4]. To test the accuracy of the algorithm, corresponding airflow signals, measured by a pneumotachograph, were used to verify the estimated respiratory phases and onsets. B. Software application The software application, written in a C++ environment, was developed to aid in the analysis of chest and tracheal signals. This is an easy-to-use application which allows users to observe various spectral characteristics of breath sound signals visually. A user-friendly Graphical User Interface was developed to display the sonograms and power spectra of breath sound signals as well as the associated airflow signals. Airflow signals are used to compare the breath sound signals in relation to respiratory phases. The main application was designed specifically for the phase detection program. Fully optimized phase detection algorithm can be added to the application in the future. C. Signal Processing Breath sound signals were segmented into 100 ms segments, each with a 50% overlap between the successive segments. A Hanning window was applied to each of the
segments. The power spectrum of each 100 ms segment was then calculated using Fast Fourier transform. To ensure that the respiratory phases were detected properly, a frequency band of 150-300 Hz was chosen to calculate the average power of the chest signals. This is the frequency range that yields the greatest I-E power difference for the chest signals (at least 6 dB) [4]. In addition, the average power for tracheal signals was taken from 150 Hz to 600 Hz, where most of the spectral components lie on. D. Respiratory Phase Detection algorithm The phase detection algorithm uses the average chest power spectra to detect the respiratory phases whereas, the average tracheal power spectra are used to determine the breath onsets. This algorithm first detects the inspiration peaks of chest power spectra. The estimated peaks are then used in the prediction of breath onsets. To detect the peaks of inspiration from chest signals, initially, the slope at each sample is calculated by taking the differences between adjacent points. Samples that have a positive difference from the previous sample and a negative difference from the next sample are identified as the possible peak points To further locate the inspiration peaks, a small moving window is used. Since the flow rate may vary from breath to breath, the window was chosen to cover a complete breath cycle of the signal (approximately 2s or 20 samples). Such a moving window is applied to the possible peak points determined in the previous step. Maximum points within the window having at least one standard deviation above the local mean are then determined. For the chest power spectra, inspiration peaks are expected to be much higher than expiration peaks. As the possible peak points may consist of the inspiration peaks as well as some expiration peaks, a threshold is used to filter out the expiration peaks. The peak detection algorithm is designed to be both semi and fully automated. In the semi-automated mode, users are allowed to add the missing peaks or reject the detected peaks after looking at the average power spectra of the tracheal and chest signals. To find the onsets of breaths from tracheal signals, first, the slope at each sample is calculated. In this case, samples that have a negative difference from the previous sample and a positive difference from the next sample are selected as the potential onsets. Since on average, the duration of a respiratory phase is approximately 1s, the distance between a peak and the closest onset is expected to be about 500 ms or 5 samples. To be on the safe side, a difference of 2 samples (200 ms) was considered as “too close”. Therefore, potential onsets detected from the previous step that are considered too close to any of the detected peaks are excluded from the selection. To calculate the local mean and standard deviation of each sample, a moving window with a length of 10 samples (approximately half of a breath duration) is used. Potential onsets with at least 0.5 standard deviation smaller
than the local mean are further chosen for analysis. Next, the average distance between two inspiration peaks is estimated using the detected peaks obtained in the peak detection process. The average length of a respiratory phase is then calculated as a half of the average peak distance. This information is used to group the selected potential onsets into clusters. Only the minimum point within each cluster is chosen to be a breath onset. To maximize the accuracy of the phase detection program, further optimizations were made. A self-correcting algorithm was added into the program. This algorithm compares the detected onsets to the estimated peaks to ensure that only two onsets exist between each of the two inspiration peaks. Onsets that are not detected during previous selection are added whereas extra points that exist between two peaks are removed accordingly. With the estimated peaks and onsets, the respiratory phases or the direction of airflow can be predicted. Intervals between two onsets with a peak are inspiration whereas intervals without any peaks between the two onsets are determined as expiration. E. Performance Analysis Three types of calculations were used to determine the overall performance of the respiratory phase detection algorithm: • Percentage of respiratory phases detected correctly by the peak detection algorithm. • Percentage of onsets detected correctly by the onset detection program • Average difference (in milliseconds) between the detected onsets and the corresponding actual breath onsets.
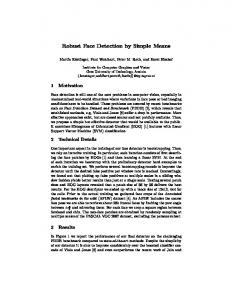
III. RESULTS Table I summaries the results of phase detection. In the semi-automated mode, inspiration peaks were detected with 100% accuracy. For the fully automated peak detection, an average accuracy of 93% was obtained with a standard deviation of 7%. Distribution of the peak detection results are summarized in Table II. Out of the 9 chest signals with peak detection accuracy greater than or equal to 95%, 5 of them were detected 100% by the peak detection algorithm. The least result obtained was 76% accurate. A fully automated onset detection algorithm was developed successfully. 100% of breath onsets were detected correctly by the algorithm. Compare to the actual flow signal, on average, there is only a 118.0 ± 39.9 ms difference between the estimated onsets and the corresponding actual breath onsets. Figure 1 shows the airflow signal estimated by the phase detection program and the actual recorded airflow of a healthy subject. Note that the phase detection algorithm
developed in this study only estimates the breath onsets and respiratory phases or the directions of airflow. No attempt was made to estimate the actual magnitude of airflow signals.
IV. DISCUSSION The peak detection algorithm developed in this research depends on the power spectra of chest signals. For a chest signal that has a large I-E average power difference, the inspiration peaks usually have a much higher breath intensity than the expiration peaks. Therefore, accurate peak detection can be expected. Conversely, for small I-E average power differences, inspiration peaks are not clearly distinguished from expiration peaks. Hence, the global threshold, used to separate expiration peaks from inspiration peaks, may not be able to filter out the expiration peaks entirely. That is, some expiration peaks may lie above the threshold and will be considered as inspiration peaks. This will then affect the overall evaluation of the peak detection accuracy. However, as previous studies have shown, there is at least a 6 dB difference in I-E power of chest signals when chest signals are recorded from either LMC or RMC [4]. Under such conditions, over 90% of average accuracy can be achieved, as reported in section III. From the results given in table I, the peak detection accuracy obtained in the fully automated mode (93%) is slightly lower than that obtained in the semi-automated mode (100%). This is due to the fact that there might be some very loud segments, or spikes, in the power spectrum of chest signals, such as swallowing sounds or artifacts. Since swallowing sounds and artifacts usually have much louder spectral components relative to the power spectrum of chest signals, the presence of these artifacts will alter the original threshold value of the chest signals. As this research, at this stage, does not focus on the removing of artifacts nor on the recognition of swallowing sounds from chest power spectra, the peak detection algorithm developed does not compensate for the effects of swallowing sounds or artifacts. Therefore, in the presence of swallowing sounds or artifacts, performance of the peak detection algorithm is affected slightly and hence, 93% accuracy was obtained in the fully automated mode. In the semi-automated mode, peaks may be added or rejected manually based on visual observation of the sonograms, 100% accuracy was achieved. The onset detection algorithm uses tracheal power spectra to locate breath onsets. Since the detection of onsets also depends on the estimated peaks detected by the peak detection algorithm, as long as the inspiration peaks were detected accurately, the program was able to detect 100% of breath onsets correctly in the fully automated mode. The main reason is due to a self-correction capability that was added into the algorithm. The algorithm itself was able to identify and correct onsets that were not detected properly during previous detection. Onsets that were missing were detected and onsets that were detected wrongly were
Peak Detection Accuracy 100% 93% ± 7%
Semi-automated Fully automated
Fully Automated Difference in the estimated onsets
Onset Detection Accuracy 100% 118.0 ms ± 39.9 ms
Table I. Performance of the phase detection algorithm (mean ± standard deviation). Percentage 0-74% 75-79% 80-84% 85-89% 90-94% 95-100% Total
Number of chest signals 0 1 2 1 4 9 17
Table II. Percentage distribution of the peak detection results
Figure 1. Comparison of the estimated airflow signals and the recorded airflows. Labeled: “actual” is the recorded airflow signal. “est” is the estimated airflow signal by the phase detection program.
removed. Hence, this self-correction capability optimizes the onset detection algorithm and increases the performance of the algorithm. The design of the onset detection algorithm is robust, even when the peak detection algorithm is less accurate. The algorithm depends on the peak detection algorithm, but not entirely. Detected inspiration peaks are only used to estimate the average distance between two onsets and also to identify
some missing onsets. Without peak information, the onset detection algorithm is still able to detect the breath onsets with high accuracy. However, the peak points are needed to identify phases, that are inspiration versus expiration. As reported in section III, there is an average difference of 118 ms between the actual and the estimated onsets. Since a minimum critical flow is required for the trachea to generate detectable breath sounds, a difference between the actual breath onsets and the estimated onsets is expected. Previous studies have shown that there is a 40 ms time difference in the onset of estimated breaths [4]. However, the 40 ms was obtained by using a semi-automated mode. Conversely, the 118 ms difference obtained in this current study is in a fully automated mode, such that all onsets are detected automatically by the onset detection program itself. Since the onset detection algorithm uses one point for each 100 ms segment to represent the average power, the delays between the estimated onsets and the actual ones are expected to be about 100ms. Hence, an average difference of 118 ms is acceptable. The current non-invasive method may be used to detect the timing and frequency of breathing in the studies of diagnosing respiratory diseases. However, further research is required in order to be able to predict the actual airflow magnitude from the recorded breath sounds. Another important application of the current method is to detect the respiratory phases of children with swallowing disorders and/or neurological impairments during feeding assessment. Additional signal processing is needed to further improve the phase detection algorithm for this use. In such cases, a swallowing detection algorithm and an artifactremoving algorithm must be used in conjunction with the developed phase detection algorithm in order to reliably estimate the respiratory phases.
V. CONCLUSION The outcomes of this study support the use of breath sound signals as an alternative method to airflow measurement, in detecting respiratory phases. Results obtained in this study have proven that the proposed method is applicable in detecting respiratory phases of healthy subjects. With additional signal processing, the phase detection algorithm can be used to detect the respiratory phases of subjects with neurological impairments or asthma. The automation of respiratory phase detection using breath sounds is essential, as it is useful in respiratory or swallowing studies where traditional airflow measurements are difficult. Using the computerized algorithm to detect peaks and onsets of breath sounds greatly simplifies the experimental apparatus as well as the evaluation of respiratory phases. Excellent results obtained in the fully automated mode, with a 93% accuracy for peak detection and a 100% accuracy for onset detection, are promising. A difference of 118 ms between the actual and the estimated onsets is acceptable.
Success in implementing the software application is also encouraging. In the future, fully optimized respiratory phase detection algorithm can be added to this application in order to further complete the development of this software.
Figure 2. Graphical User Interface of the software application.
References [1]
W. Selley, R. Ellis, F. Flack, C. Bayliss and V. Pearce, “The synchronization of respiration and swallow sounds with videofluoroscopy during swallowing”, Dysphagia 9, pp. 162-167, 1994
[2]
S. Tarrant, R. Ellis, F. Flack, W. Selley, “Comparative review of techniques for recording respiratory events at rest and during deglutition”, Dysphagia 12, pp. 24-38,1997
[3]
Z. Moussavi, M. Leopando and G. Rempel, “Automated detection of respiratory phases by acoustical means”, Proc. of 20th Int. IEEE/EMBS Conference, pp. 21-24,1998
[4]
Z. Moussavi, M. Leopando, H. Pasterkamp and G. Rempel, “Computerized acoustical respiratory phase detection without airflow measurement”, Med. Bio. Eng. Comp., in press, 2000
[5]
M. Kompis, H. Pasterkamp, Y. Oh and Wodicka, “Distribution of inspiratory expiratory respiratory sound intensity on surface of the human thorax”, Proc. of 19th IEEE/EMBS Conference, pp. 2047-2050, 1997
[6]
G. Chi-Lem, Y. Inaba, M. Greenberg, H. Pasterkamp, “Critical flow to generate breath sound does change during bronchial constriction”, Am. J. of Respir. & Crit. Care Med., 157(3), pp. A540, 1997
G. and the Int.