The International Archives of the Photogrammetry, Remote Sensing and Spatial Information Sciences, Volume XLII-3/W1, 2017 2017 International Symposium on Planetary Remote Sensing and Mapping, 13–16 August 2017, Hong Kong
AUTOMATIC DETECTION OF SECONDARY CRATERS AND MAPPING OF PLANETARY SURFACE AGE BASED ON LUNAR ORBITAL IMAGES Atheer L. Salih
a,
*, A. Lompart a , A. Grumpe a , C. Wöhler a , H. Hiesinger
b
a
Image Analysis Group, T U Dortmund, Dortmund, Germany (atheer.altameemi | andrii.lompart | arne.grumpe | christian.woehler)@tu-dortmund.de b Institut für Planetologie, Westfälische Wilhelms-Universität Münster, 48149 Münster, Germany -
[email protected] Commission III, ICWG III/II KEY WO RDS: Automatic crater detection; Absolute model age; Cater size-frequency distribution; Secondary craters
ABSTRACT: Ages of planetary surfaces are typically obtained by manually determining the impact crater size-frequency distribution (CSFD) in spacecraft imagery, which is a very intricate and time-consuming procedure. In this work, an image-based crater detection algorithm that relies on a generative template matching technique is applied to establish the CSFD of the floor of the lunar farside crater T siolkovsky. T he automatic detection t hreshold value is calibrated based on a 100 km² test area for which the CSFD has been determined by manual crater counting in a previous study. T his allows for the construction of an age map of the complete crater floor. It is well known that the CSFD may be affected by secondary craters. Hence, our detection results are refined by applying a secondary candidate detection (SCD) algorithm relying on Voronoi tessellation of the spatial crater distribution, which searches for clusters of craters. T he detected clusters are assumed to result from the presence of secondary craters, which are then removed from the CSFD. We found it favourable to apply the SCD algorithm separately to each diameter bin of the CSFD histogram. In comparison with the original age map, the refined age map obtained after removal of secondary candidates has a more homogeneous appearance and does not exhibit regions of spuriously high age resulting from cont amination by secondary craters.
1. INTRO DUCTIO N For decades, craters on planetary surfaces have been regarded as the traces left by direct impacts of asteroids and comets. T he process of secondary cratering occurs usually on objects with sufficient gravitational acceleration, where the ejecta from the initial impact fall back on the planet’s surface and create secondary craters. In the last decades, a number of researchers have focused on analysing the role of secondary craters in the estimation of the absolutude model age (AMA). T hey concluded that secondary craters “contaminate” the crater statistics, which results in inaccurate age estimation especially when craters smaller than about 1 km are considered (e.g., McEwen and Bierhaus, 2 006; Werner et al., 2009; Robbins and Hynek, 2014). To speed up the crater counting process, a number of automatic detection and counting methods have already been developed. Some of them are fully automated but dependent on the choice of a detection threshold. According to the previous literature, none of them has the capability of automated detection of secondary crater candidates (e.g., Salamunićcar and Lončarić, 2010). The main goal of this work is to develop an automated approach to elimination of secondary craters that would be combined with semi-automatic template matching based crater detection. T his would reduce the time burden and complexity of crater counting as well as the amount of proficiency needed to achieve accurate age estimation results. T he T siolkovsky crater area is a good testing ground for this method because of its size an d the homogeneous lava-flooded floor.
In this paper, we propose an automatic method of detection for secondary crater candidates on the lunar surface. T he results presented in this paper are encouraging for further improvement of this automatic method via alternative clustering criteria and testing on other lunar surface parts. 2. CRATER DETEC TIO N Impact cratering is a very common geological process that occurs on all planets of the solar system, and is commonly used to estimate the relative age of surfaces that have not been sampled before (e.g., Michael and Neukum, 2010). Currently, manual counting still dominates the field of age estimation of planetary surfaces. However, a single standardised approach for the assessment of impact craters and measurement of their sizes has not been developed for use in the process of absolute age determination of planetary surfaces. There have been a number of tools developed to support the scientists in manual crater counting. Examples are the CraterT ools software developed by (Kneissl et al., 2011) and also the CraterStats software package developed by (Michael et al., 2010) that helps to estimate the AMA. Most of these tools simplify the process of working with crater information, but the crater counting is still has to be performed manually. A fully automated system replacing those tools has not been developed yet. The availability of high resolution images of the Moon provided by the Kaguya T errain Camera (T C) (Ohtake et al., 2008) or the Lunar Reconnaissance Orbiter Narrow Angle Camera (NAC) (Chin et al., 2007) provides an opportunity to analyse and extract more geological information than ever before. T he resolution of those images is sometime reach to up to few meters per pixel, which allows for the identification of craters of
This contribution has been peer-reviewed. https://doi.org/10.5194/isprs-archives-XLII-3-W1-125-2017 | © Authors 2017. CC BY 4.0 License.
125
The International Archives of the Photogrammetry, Remote Sensing and Spatial Information Sciences, Volume XLII-3/W1, 2017 2017 International Symposium on Planetary Remote Sensing and Mapping, 13–16 August 2017, Hong Kong
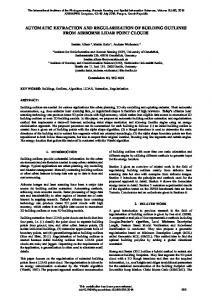
down to a dozen meters in diameter. T hat might provide unprecedented precision for age estimation of the surface of the Moon. However, the high resolution and amount of data also increases the time required to identify these geological features and suggests the development of an automated counting system. In recent years, a number of comput er vision techniques have been developed to address the task of automated crater counting. They can be split in several groups, one group based on edges and Hough T ransform as in (Sawabe et al., 2006) who propose a multistage approach on edge detection and fuzzy Hough T ransform. It uses multiple heuristics methods to detect impact craters. A crater detection rate of 80% compared to manual detection is obtained by (Sawabe et al., 2006). Another group is the neural networks based approach as in (Cohen et al., 2016), who propose a CNN (Convolutional Neural Networks) technique. In contrast to other approaches, CNNs do not have to use handcrafted features, instead they learn optimal filters and features from training examples (for an overview see, e.g., Simard et al., 2003). A drawback of the CNN approach is the need for a large number of examples to train on, which need to be extracted and labelled, as well as long training times. Recently, methods not based on images but on topographic maps have been developed to address crater counting (Yin et al., 2013). In contrast to image based methods, they are not affected by illumination, visual surface properties and atmospheric conditions. In this work, we have applied the image-based template matching crater detection algorithm developed by (Gr umpe and Wöhler, 2013) which depends on a few parameters, such as a threshold of similarity between the impact crater template and the actual image. 3. CRATER DETEC TIO N VIA TEMPLATE MATCHING T emplate matching is a technique that finds areas within an image that are similar to a template image, where usually t he slidin g windo w approach is employed. The windo w starts slidin g from the initial position and is shifted by a given increment. For every step, a similarity measure is calculated. Common measures include cross-correlation and the sum-ofsquared differences bet ween template and image. See, e.g., (Brunelli, 2009) for an overview. To detect craters within our testing area, the template matching algorithm of (Grumpe and Wöhler, 2013) is applied. It uses six templates which represent six different 3D models of small craters. They were constructed using laser altimeter tracks (LOLA) (Smith et al., 2010), that contain full cross sections of satellite craters of the lunar crater Plato. Each crater is split in its centre point to extract two different profiles. Then these curvature models were rotated symmetrically around the crater centre to generate two-dimensional surfaces in 3D space. From these surfaces, crater templates could be obtained by applying the Hapke model (Hapke, 1984, 2002) to render crater template images based on the known directions towards the sun and the viewer. T he obtained templates are grey scale images as shown in Figure 1, which are then re-scaled to match a given crater diameter with respect to the image. T he similarity between the template and the image is computed by cross-correlation.
Figure 1. Set of six rendered crater templates used for template matching, given typical illumination conditions. This procedure is repeated for a specified range of diameters, the generated template is applied to the original image windo w by win dow, and the cross-correlation coefficient is computed for every position on the image. When the cross-correlation exceeds a given threshold, the crater is added to the list of candidates. T his method yields a list of observed craters and their positions and diameters in pixel units. The final detection step consists of a removal of multiple detections of the same crater at slightly different locations with slightly different diameters (Salih et al., 2016). Choosing the optimal threshold value is important because a low threshold would result in a large n umber of false detections and a high one would result in missing craters. The choice of threshold values depends basically on factors such as surface, illumination and observation angle of the image. One reliable way to calibrate this threshold is to use an area with manually counted craters. T he area is split into three parts. A threshold for each area is estimated so as to closely match the corresponding manual count. The result consists of three slightly different thresholds, whose mean value can be chosen as an “optimal” threshold value for this area. 4. SECO NDARY CRATERS For decades, planetary research studies have regar ded the occurrence of craters on solid surface bodies as traces of direct (primary) impacts. In contrast, secondary craters were formed by impacts of pieces of material ejected during much lar ger primary impacts (Bierhaus et al., 2005). Early observations of the lunar surface noted that the rays of large primary craters have a significantly higher density of small craters than the neighbouring surface. T he crater sizefrequency distribution (CSFD) describing the quantity of craters found within a given diameter interval increases with decreasing size (McEwen and Bierhaus, 2006). One of the first scientists who considered these craters as secondary craters was (Shoemaker, 1965). He made the prediction that remote secondary craters should predominate at crater diameters smaller than about 200 m. Secondary craters usually formed in close proximity to the primary crater and appear in characteristic chains or clusters. It has been assumed by many researchers that small craters on the terrestrial planets, except those located close to primary craters, are predominantly
This contribution has been peer-reviewed. https://doi.org/10.5194/isprs-archives-XLII-3-W1-125-2017 | © Authors 2017. CC BY 4.0 License.
126
The International Archives of the Photogrammetry, Remote Sensing and Spatial Information Sciences, Volume XLII-3/W1, 2017 2017 International Symposium on Planetary Remote Sensing and Mapping, 13–16 August 2017, Hong Kong
primary craters which can be used for surface dating (Basilevsky et al., 2005). However, studies have shown that one primary impact can create more than 100 secondary craters and that the distance from the source crater may extend more than 1000 km (Bierhaus et al., 2001). T hese secondary craters thus represent a significant part of the spatially random population. In contrast to primary craters, diameters of secondary craters are usually limited by the diameter of their parent craters. T he upper limit of diameters for secondary craters is typically around 5% of the parent crater, as assumed by (Bierhaus et al., 2001, 2005). T he secondary crater population predicted by these studies is proportional to the primary population observed in the small diameter range (McEwen and Bierhaus, 2006). 5. SURFACE AG E ES TIMATIO N Age dating by crater counting is based upon the assumption that a new surface forms without impact craters. Over time, it is bombarded by asteroids and comets, which results in an increase of the impact crater population. The age of a surface can be estimated by assessing the distribution of craters and fitting estimated crater size-frequency distribution (CSFD) to a so-called production function, which depends on the absolute age of the surface (Neukum, 1983). A function to describe the total number of craters with diameters that exceed a given diameter D per unit of area has been introduced by (Neukum, 1983), which was formulated from CSFD data extracted from different lunar areas of various ages according to (1) In Equation (1), is the cumulative crater frequency that expresses the number of craters per km 2 with diameters exceeding D and are the coefficients for the age estimation on the lunar surface. T he logarithm of is thus given in polynomial form (Neukum, 1983). 6. METHO D USED FO R SECO NDARY CANDIDATE DETEC TIO N In this paper, a technique for distinguishing secondary craters is proposed, which can be identified from the surrounding primary population of similar diameter based on their spatial distribution. Our testing area is the T siolkovsky crater as shown in Figure 2, which is located at 20° S and 129° E on the farside of the Moon. It has a diameter of about 180 km. T he crater T siolkovsky is partially filled by lava-filled and has a dark and smooth floor. According to previous studies, ages of the crater T siolkovsky of approximately 3.8 Ga (Walker and El-Baz, 1982) and 3.5 Ga Tyrie, 1988) have been found. A recent age estimation has been performed by (Pasckert et al., 2015), who obtained 3.19 Ga (+0.08 / −0.12) Ga. In this work we use images acquired by the T errain Camera (T C) of the lunar spacecraft Kaguya (Ohtake et al., 2008). T he resolution of the image is 7.4 m/pixel. The determination of secondary crater candidates is a challenging problem. In most studies, secondary craters are removed by hand manually. One of the previous attempts to develop a method for estimation of the secondary crater population was made by (Bierhaus et al., 2005).
To develop an automatic approach to the detection of secondary craters, only well recognised criteria by which secondary craters can be distinguished should be applied. A recent approach of (Michael et al., 2012) is based on the distribution of distances between the craters, in particular the mean 2 nd-closest neighbour distance. They concluded that the crater density obtained from an ideal random distribution is related to this statistical distance value. The main idea of our Secondary Candidate Detection (SCD) algorithm is to detect secondary craters based on deviations of their spatial distribution from the uniform distribution of the surrounding primary craters (which is similar to Michael et al., 2012, but using a different criterion for detecting crater clusters). Hence, the SCD algorithm determines whether the crater population is uniformly distributed or clustered, which allows for removing the secondary crater candidates from a crater population that is used to estimate the age of a surface part. The first step is to obtain craters using the template matching results of the given region. Primary craters are created from a random distribution of small bodies hitting the surface. T heir distribution should appear as uniform and homogeneous. Usually, secondary craters appear as high-density regions. T o separate the secondary crater population from the background population, we developed an algorithm that removes secondary crater candidates in any spatial distribution. T his method combines a Voronoi tessellation, a Monte Carlo simulation of a uniform distribution, and a one-tailed test of clustering which divides the detected craters into two groups based on the probability that t hey exhibit a non-uniform spatial distribution. A Monte Carlo method combined with a hierarchical clustering algorithm has been used by (Bierhaus et al., 2005). Voronoi tessellation has been used to detect non-uniformly distributed craters in the work of (Honda et al., 2014). The SCD algorithm recognizes distal secondary craters from the surrounding primary population based on their clustering with respect to an ideal random distribution. Similar to (Bierhaus et al., 2005), our algorithm generates a new uniformly distributed population which has the same density as the detected craters. Then Voronoi tessellation is applied to each population, and distribution parameters are calculated for each iteration of the simulation process. The Voronoi diagram (Voronoi tessellation) is a method of subdivision of a plane into regions that comprise the part of the plane around each point within a distance that is shorter than the distances to the neighbouring points (Aurenhammer, 1991). Clustering can be inferred based on deviations of the local spatial density from the mean spatial density indicated by variations of the Voronoi cell area. A problem with this approach is that the statistical distribution of the Voronoi cell area for a uniform distribution cannot be derived from the observed spatial crater distribution due to its possible contamination by clustered secondary craters, such that they should be inferred from simulations (Chiu, 2003). The distribution of point is usually registered via a bo unded observation area. This introduces edge effects to the polygons close to the boundary of the observation area. T o avoid these undesirable effects, boundary polygons have to be ignored. A Voronoi diagram part itions an area around the point which represents a relative distance from a point to all its closest neighbours.
This contribution has been peer-reviewed. https://doi.org/10.5194/isprs-archives-XLII-3-W1-125-2017 | © Authors 2017. CC BY 4.0 License.
127
The International Archives of the Photogrammetry, Remote Sensing and Spatial Information Sciences, Volume XLII-3/W1, 2017 2017 International Symposium on Planetary Remote Sensing and Mapping, 13–16 August 2017, Hong Kong
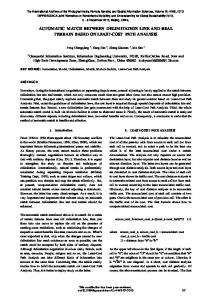
In each iteration, craters are uniformly redistributed on the surface. A new Voronoi tessellation is computed along with the areas of Voronoi polygons. After simulation of n iterations, a distribution model of Voronoi cell areas is obtained and the median and standard derivation is computed. The clustering values, i.e., areas of Voronoi polygons, of the original crater distribution are compared to the threshold value obtained from Monte Carlo simulations of random impacts. Our algorithm detects a crater as a secondary crater candidate if its Voronoi cell area is belo w a threshold value, which resembles a one-tailed test of clustering. We have also applied the SCD algorithm such that the statistical analysis is applied to several diameter intervals separately. T his is expected to provide a better detection performance as the statistical spatial distribution of craters depends on their size. In this work, we have used 8 intervals with limiting diameters of 80, 170, 260, 350, 440, 530, 620, 710 and 800 m. 7. RESULTS AND CO NCLUSIO NS FO R TH E REFER ENCE AREA The SCD algorithm has been then applied to different regions of the crater T siolkovsky in order to analyse impact of the secondary craters on the crater density as well as the difference of the estimated ages obtained for the CSFDs with and without secondary craters. As a first step, t he template-based crater detection algorithm has been applied to a small area in the middle of T siolkovsky crater for which manual crater counts are available as reference data (Pasckert et al, 2015). T his reference area is of 99.867 km 2 (Pasckert et al, 2015) with a total number of 1967 craters, ranging from 23 m to 905 m in diameter. Figure 2 presents the result ing age which has been calculated for craters in the range of 128 to 1000 m for this small test area. Crater detection has been performed using the previously described template matching algorithm to the given region. T he range of 128–1000 m is used for the template matching algorithm, as craters with smaller diameters would result in a large number of false positive detections. Previously, an optimal cross-correlation threshold of 0.6568 had been determined for this area by (Salih et al., 2016). Applying T emplate Matching to the reference area with this threshold resulted in an age estimate of 3.35 Ga. T his previous threshold was determined based on automatic crater detection results without any consideration of changes due to automatic removal of secondary crater candidates. A new template matching threshold value of 0.6525 has been computed based on application of the template-based automatic detection by minimizing the age difference between the age obtained from the reference data and the age resulting from template matching combined with secondary crater removal. The resulting threshold is not far away from the original threshold.
Figure 2. AMA o btained based of the craters in the reference region in the diameter range 128–1000m. To obtain the best clustering threshold, we redistributed the detected craters 1000 times, and the Voronoi tessellation and Voronoi areas for every crater were computed for each iteration. The results of applying our algorithm on the test area are shown in Figure 3.
Figure 3. Visualized results of applying SCD algorithm to Kayguya T C image data of the floor of lunar crater T siolkovsky. Red areas correspond to detected secondary crater candidates, green areas to detected primary crater candidates. To illustrate the effect of the clustering threshold value, we have applied our algorithm with different threshold values to the detected craters. Lower threshold values can detect only a very small number of secondary crater candidates, and its impact on the age estimate is insignificant. Both SCD algorithms (with and without application in bins) correspond well on the number of craters with diameters less than 150 m, while in the range of 150–180 m the number of automatically detected crater is significantly lower without application in bins. T he binned SCD algorithm detects more craters in the larger diameter range, which wo uld probably be considered primary craters by a human expert (Figure 4). Splitting craters in bins by diameter shows an increase in the detection of secondary craters, although most craters with diameters exceeding 500 m due to their more irregular
This contribution has been peer-reviewed. https://doi.org/10.5194/isprs-archives-XLII-3-W1-125-2017 | © Authors 2017. CC BY 4.0 License.
128
The International Archives of the Photogrammetry, Remote Sensing and Spatial Information Sciences, Volume XLII-3/W1, 2017 2017 International Symposium on Planetary Remote Sensing and Mapping, 13–16 August 2017, Hong Kong
distribution resulting from their relatively small number. Hence, the diameter intervals with centre diameters exceeding 500 m were excluded from the AMA estimation applying the binned SCD algorithm (Figure 5).
Figure 4. T op: Craters detected in Kaguya T C image data by the SCD algorithm (top) and the binned SCD algorithm (bottom). The final AMA results are displayed in Figure 5. The binned SCD algorithm shows an age estimate which is closer to the reference value than the SCD algorithm applied to all craters. 8. RESULTS FO R NO N-REFERENC E AREAS For further evaluation for our method, three larger areas on the crater floor of T siolkovsky have been analysed with our algorithm as shown in Figure 6. Each selected region has an area of around 2700 km 2 (52 km by 52 km). Unfortunately there are no reference data for these regions except the small part manually counted by (Pasckert et al., 2015). This part belongs to region A and, consequently, age estimates have to be similar. Because these regions represent parts of the mare-flooded crater floor of T siolkovsky, the previously determined optimal threshold value was applied. We used a 600 by 600 pixel win dow for constructing crater density and age maps with a step width of 10 pixels. Three maps were plotted in Figure 7, representing the densities of detected craters before and after removal of secondary candidates. T here are visible fluctuations of crater density on the maps obtained without SCD algorithm. Applying the SCD algorithm reduces the crater density fluctuations especially for the binned version.
Figure 5. AMA estimation for the reference area, obtained using the template matching algorithm without SCD (top), with SCD algorithm without bins (middle) an d with binned SCD algorithm (bottom). Although the algorithm has a relatively strong effect on the crater density, the SCD algorithm without bins only has a weak effect on the age estimate (around 0.2 Ga), while removing more than 10% of the craters. The estimated ages of the regions before removing secondary candidates range from 3.29 to 3.44 Ga without SCD and from 3.14 to 3.37 Ga with binned SCD (T able 1).
This contribution has been peer-reviewed. https://doi.org/10.5194/isprs-archives-XLII-3-W1-125-2017 | © Authors 2017. CC BY 4.0 License.
129
The International Archives of the Photogrammetry, Remote Sensing and Spatial Information Sciences, Volume XLII-3/W1, 2017 2017 International Symposium on Planetary Remote Sensing and Mapping, 13–16 August 2017, Hong Kong
The SCD and binned SCD remove 12% and 18% percent of craters, respectively (T able 2), but the binned SCD has a much stronger effect on the age estimate as shown in T able 1. T he obtained age estimates are closer to the 3.21 Ga reference value than those obtained using plain template matching. T he estimated fractions of secondary craters appear to be reasonable in comparison with the estimates of 5%– 25% of the population of craters of similar size on Mars for an AMA of 3.2 Ga (Werner et al., 2009) but does not match well with the estimate of 35%–80% for Europa (Bierhaus et al., 2001, 2005; McEwen and Bierhaus, 2006).
Figure 6. T est regions A, B and C in crater T siolkovsky overlaid on LROC WAC mosaic image (Speyerer et al., 2011). Method template matching
A
B
C
3.297±0.002
3.446±0.003
3.371±0.001
with SCD
3.271±0.002
3.435±0.0004
3.353±0.001
with binned SCD
3.149±0.004
3.37±0.0002
3.249±0.001
A
B
craters detected without SCD
C
17571
16292
17938
with SCD
15349 (87%)
14341 (88%)
15633 (87%)
with binned SCD
14441 (82%)
13430 (82%)
14651 (81%)
T able 2. Number of detected craters in test regions A, B and C.
T able 1. Age estimates for test regions A, B and C.
(A) (B) (C) Figure 7. Effect of removal of secondary candidates on the crater densities of test regions A, B and C. First row: Detected craters with template matching. Second ro w: Crater density after applying the SCD algorithm. Third row: Crater density after applying the binned SCD algorithm. 9. AGE MAP O F TSIO LKO VS KY By using the template matching algorithm and the threshold value of 0.6568, the following age map was obtained for the floor of T siolkovsky as shown in Figure 8. A 900 by 900 pixel win dow was used for constructing all age maps with a step width of 10 pixels. The area surrounding crater T siolkovsky consists of rough highland surface that cannot be taken into
account because the template matching threshold has been optimized for the flat basaltic lava surface of T siolkovsky’s floor. Although the T siolkovsky floor region looks homogeneous, patches with a much higher age are clearly visible in Figure 8. Their estimated age is around 3.7 Ga, which is significantly
This contribution has been peer-reviewed. https://doi.org/10.5194/isprs-archives-XLII-3-W1-125-2017 | © Authors 2017. CC BY 4.0 License.
130
The International Archives of the Photogrammetry, Remote Sensing and Spatial Information Sciences, Volume XLII-3/W1, 2017 2017 International Symposium on Planetary Remote Sensing and Mapping, 13–16 August 2017, Hong Kong
higher than the results of age estimation based on manually counted craters (Pasckert et al., 2015). It is to be expected that these age fluctuation occur as a result of distortion of the CSFD of these areas by secondary craters.
All in all, application of the binned SCD algorithm results in an age map that strongly reduces the fluctuations in age of the geologically homogeneous surface of the floor of the crater T siolkovsky.
Figure 8. Age map of the floor of crater T siolkovsky using the CSFD obtained by the template matching method with an optimal threshold value, without the SCD algorithm.
Figure 10. Age map of the floor of crater T siolkovsky using the CSFD obtained by the template matching method with an optimal threshold value in combination with the binned SCD algorithm.
We have applied the template matching algorithm combined with the SCD algorithm using a local threshold derived for each image patch and using a global threshold value as a mean of the threshold values of regions A, B and C. T he global threshold produced more consistent results. After applying the SCD algorithm, we obtained two new age maps as shown in Figure 9 and Figure 10. T he first age map (Figure 9) slightly differs from the original age map of Figure 8. There is some reduction in age within high-age regions but the overall effect on the age map is almost invisible.
Figure 9. Age map of the floor of crater T siolkovsky using the CSFD obtained by the template matching method with an optimal threshold value in combination with the SCD algorithm without bins. In the age map of Figure 10, the binned SCD algorithm has been applied based on the same local threshold value. T he map shows visible changes in the overall age. Especially, the age of the regions with high ages in the original map of Figure 8 is significantly reduced. T he binned SCD algorithm has a strong effect on the densely cratered areas but also some effect on the areas not affected by the SCD without bins.
10. CO NCLUSIO N AND FUTURE WO RK The SCD algorithm for removing secondary crater candidates from the CSFD has been present ed and applied to the floor region of the lunar crater T siolkovsky. It is based on the statistical analysis of the Voronoi diagram of the detected craters. In its binned version, t he SCD algorithm result s in an increased homogeneity of the constructed age map and eliminates local areas of significantly increased apparent age which are characterised by clustered craters. Because of the ambiguous nature of secondary craters, there is no definitive way to validate the actual origin of those craters. Due to the lack of reference data for the whole crater floor region, our algorithm could not be tested more rigorously. Our method does not guarantee the detection of all secondary craters because secondary craters may also be distributed in an unclustered way (Bierhaus et al., 2001). T his means that any algorithm that depends on the detection of unusual spatial crater distributions as a criterion for secondary craters will not be able to detect them completely. Nevertheless, the secondary crater fraction estimated with the binned SCD algorithm of between 12% and 18% is consistent with the estimated range between 5% and 25% of (Werner et al., 2009) for surfaces of similar age and craters of similar diameter on Mars. Furthermore, the result of the binned SCD algorithm bears a high plausibility because it eliminates the spurious high-age anomalies which are apparent without secondary crater removal. REFERENCES Aurenhammer, F., 1991. Voronoi Diagrams – A Survey of a Fundamental Geometric Data Structure. ACM Computing Surveys 23(3), pp. 345-404. Basilevsky, A.T ., Neukum, G., Ivanov, B.A., Werner, S.K., van Gesselt, S., Head, J.W., Denk, T ., Jaumann, R., Hoffmann, H., Hauber, E. and McCord, T ., 2005. Morphology and geological structure of the western part of the Olympus Mons volcano on Mars from the analysis of the Mars Express HRSC imagery. Solar System Research, 39(2), pp. 85-101.
This contribution has been peer-reviewed. https://doi.org/10.5194/isprs-archives-XLII-3-W1-125-2017 | © Authors 2017. CC BY 4.0 License.
131
The International Archives of the Photogrammetry, Remote Sensing and Spatial Information Sciences, Volume XLII-3/W1, 2017 2017 International Symposium on Planetary Remote Sensing and Mapping, 13–16 August 2017, Hong Kong
Bierhaus, E.B., Chapman, C.R., Merline, W.J., Brooks, S.M. and Asphaug, E., 2001. Pwyll secondaries and other small craters on Europa. Icarus, 153(2), pp. 264-276. Bierhaus, E.B., Chapman, C.R. and Merline, W.J., 2005. Secondary craters on Europa and implications for cratered surfaces. Nature, 437(7062), pp. 1125-1127. Brunelli, R., 2009. T emplate matching techniques in computer vision. Wiley Publishers. Chin, G. and 16 coauthors, 2007. Lunar Reconnaissance Orbiter Overview: T he Instrument Suite and Mission. Space Sci. Rev., 129(4), pp. 391-419 Chiu, S.N., 2003. Spatial point pattern analysis by using Voronoi diagrams and Delaunay tessellations–a comparative study. Biometrical Journal, 45(3), pp. 367-376. Cohen, J.P., Lo, H.Z., Lu, T . and Ding, W., 2016. Crater detection via convolutional neural networks. arXiv preprint arXiv:1601.00978. Grumpe, A. and Wöhler, C., 2013, September. Generative template-based approach to the automated detection of small craters. In European Planetary Science Congress (Vol. 8). Hapke, B., 1984. Bidirectional reflectance spectroscopy: 3. Correction for macroscopic roughness. Icarus, 59(1), pp. 41-59.
Pasckert, J.H., Hiesinger, H. and van der Bogert, C.H., 2015. Small-scale lunar farside volcanism. Icarus, 257, pp. 336-354. Robbins, S.J. and Hynek, B.M., 2014. The secondary crater population of Mars. Earth and Planetary Science Letters, 400, pp. 66-76. Salam unićcar, G. and Lončarić, S., 2010. Method for crater detection from Martian digital topography data using gradient value/orientation, morphometry, vote analysis, slip tuning, and calibration. IEEE Transactions on Geoscience and Remote Sensin g 48(5), pp. 2317-2329. Salih, A.L., Mühlbauer, M., Gr umpe, A., Pasckert, J.H., Wöhler, C. and Hiesinger, H., 2016. Mapping of planetary surface age based on crater statistics obtained by an automatic detection algorithm. International Archives of the Photogrammetry, Remote Sensing & Spatial Information Sciences, vol. XLI-B4. Sawabe, Y., Matsunaga, T . and Rokugawa, S., 2006. Automated detection and classification of lunar crat ers using multiple approaches. Advances in Space Research, 37(1), pp. 21-27. Simard, P. Y., Steinkraus, D., Platt, J., 2003. Best practices for convolutional neural networks applied to visual document analysis. Proc. 12th International Conference on Document Analysis and Recognition.
Hapke, B., 2002. Bidirectional reflectance spectroscopy: 5. T he coherent backscatter opposition effect and anisotropic scattering. Icarus, 157(2), pp. 523-534
Shoemaker, E.M., 1965. Preliminary Analysis of the Fine Structure of the Lunar Surface in Mare Co gnitum. In International Astronomical Union Colloquium, vol. 5, pp. 2377.
Honda, C., Kinoshita, T ., Hirata, N. and Morota, T., 2014, April. Detection abilities of secondary craters based on the clustering analysis and Voronoi diagram. In European Planetary Science Congress 2014, EPSC Abstracts, Vol. 9, id. EPSC2014 119 (Vol. 9).
Smith, D.E., Zuber, M.T ., Neumann, G.A., Lemoine, F.G., Mazarico, E., Torrence, M.H., McGarry, J.F., Rowlands, D.D., Head, J.W., Dux bury, T .H. and Aharonson, O., 2010. Initial observations from the lunar orbiter laser altimeter (LOLA). Geophysical Research Letters 37(18).
Kneissl, T ., van Gasselt, S. and Neukum, G., 2011. Map projection-independent crater size-frequency determination in GI S environments—New software tool for ArcGIS. Planetary and Space Science, 59(11), pp. 1243-1254.
Speyerer, E.J., Robinson, M.S., Denevi, B.W., 2011. Lunar Reconnaissance Orbiter camera global morphological map of the Moon. Lunar and Planetary Science Conference XXXXII, abstract #2387. Data download from http://wms.lroc.asu.edu/ lroc/view_rdr/WAC_GLOBAL
McEwen, A. S. and Bierhaus, E.B., 2006. T he importance of secondary cratering to age constraints on planetary surfaces. Annu. Rev. Earth Planet. Sci., 34, pp. 535-567. Michael, G.G. and Neuk um, G., 2010. Planetary surface dating from crater size-frequency distribution measurements: Partial resurfacing events and statistical age uncertainty. Earth and Planetary Science Letters, 294(3), pp. 223-229.
Tyrie, A., 1988. Age dating of mare in the lunar crater T siolkovsky by crater-counting method. Earth, Moon, and Planets, 42(3), pp. 245-264. Walker, A.S. and El-Baz, F., 1982. Analysis of crater distributions in mare units on the lunar far side. Earth, Moon, and Planets, 27(1), pp. 91-106.
Michael, G. G., Platz, T ., Kneissl, T . and Schmedemann, N., 2012. Planetary surface dating from crater size-frequency distribution measurements: Spatial randomness and clustering. Icarus, 218(1), pp. 169-177.
Werner, S.C., Ivanov, B.A. and Neukum, G., 2009. T heoretical analysis of secondary cratering on Mars and an image-based study on the Cerberus Plains. Icarus, 200(2), pp. 406-417.
Neukum, G., 1983. Meteoritenbombardement und datierung planetarer oberflachen. Habilitation Dissertation for Faculty Membership, Ludwig Maximilianis Univ.
Yin, J., Xu, Y., Li, H. and Liu, Y., 2013. A novel method of crater detection on digital elevation models. Proc. IEEE International Geoscience and Remote Sensing Symposium, pp. 2509-2512.
Ohtake, M., Haruyama, J., Matsunaga, T ., Yokota, Y., Morota, T . and Honda, C., 2008. Performance and scientific objectives of the SELENE (KAGUYA) Multiban d Imager. Earth, planets and space, 60(4), pp. 257-264.
This contribution has been peer-reviewed. https://doi.org/10.5194/isprs-archives-XLII-3-W1-125-2017 | © Authors 2017. CC BY 4.0 License.
132