1974
IEEE TRANSACTIONS ON POWER SYSTEMS, VOL. 22, NO. 4, NOVEMBER 2007
Automatic Segmentation of Large Power Systems Into Fuzzy Coherent Areas for Dynamic Vulnerability Assessment Innocent Kamwa, Fellow, IEEE, Ashok Kumar Pradhan, Member, IEEE, and Géza Joós, Fellow, IEEE
Abstract—This paper proposes a technique for partitioning a large power system into a number of coherent electric areas for possible application to dynamic vulnerability assessment. The coherency concept and a fuzzy clustering algorithm grouping of buses are combined to achieve this goal. The clusters are obtained by selecting representative buses from the data set in such a way that the total fuzzy dissimilarity within each cluster is minimized. The initialization problem of the conventional Fuzzy c-means algorithm, which usually leads to multiple solutions, is suitably tackled by incorporating the maximum-dissimilarity based sequential Phasor Measurement Unit (PMU) placement technique. Results of bus grouping for two test systems of three and nine areas demonstrate the potential of the approach. It is observed that such an approach to bus grouping results in a PMU configuration with minimum number of devices and fast data aggregation for a wide-area measurement system. Index Terms—Coherency, coherent area, network partitioning, phasor measurement units (PMU), PMU placement, power system monitoring, power system stability, vulnerability assessment, widearea measurements.
I. INTRODUCTION
I
N RECENT YEARS, Phasor Measurement Unit (PMU)based technology has received significant attention for monitoring, protection, and control of power systems [1]–[12]. Using a dedicated communication system, the PMU signals are forwarded to a central station where the phasors of several buses can be monitored with respect to a selected reference phasor or absolute time. This constitutes a Wide-area Measurement System (WAMS) for monitoring large power systems. However, for real-time applications the data require processing and visualization techniques to be of value to the operators who actually need information (not data). These operations can be simplified (rather effectively) by placing an appropriate set of PMUs with their area identity in a power system.
Manuscript received December 6, 2006; revised April 17, 2007. Paper no. TPWRS-00869-2006. I. Kamwa is with Hydro-Québec/IREQ, Power System Analysis, Operation and Control, Varennes, QC J3X 1S1, Canada (e-mail:
[email protected]). A. K. Pradhan is with Department of Electrical Engineering, Indian Institute of Technology Kharagpur 721302, India (e-mail:
[email protected]. in). G. Joós is with Department of Electrical and Computer Engineering, McGill University, Montreal, QC H3A 2A7, Canada (e-mail:
[email protected]). Color versions of one or more of the figures in this paper are available online at http://ieeexplore.ieee.org. Digital Object Identifier 10.1109/TPWRS.2007.907383
In the case of meter placement for classical state estimation, some important constraints such as topological observability and redundancy in meter units have to be fulfilled at the planning stage in order to derive in real-time all bus voltage and angles of the network giving a reduced set of on-line measurements [13]. Similarly, PMU placement should be carefully planned and optimized to facilitate the real-time processing and interpretation of a huge amount of data arriving at a high sampling speed. The effort invested in planning the monitoring scheme is rewarded by a reduced real-time complexity while aggregating the data for extracting information of tactical value. As demonstrated in [5], the first step in planning a PMUbased dynamic monitoring system consists in identifying the coherent electrical areas forming the grid. The coherency method is founded on the empirical observation that, following a disturbance (line or generating unit outage or sudden change in load), certain groups of generators “swing together,” that is, the generators in each group maintain an almost constant angular difference from each other. Each such coherent group can then be replaced by a single bus. This aggregation procedure applied to all PMUs from the same electrically coherent area greatly simplifies data analysis, making it possible to perform a Dynamic Vulnerability Assessment (DVA) in near real-time, shortly after a contingency is detected, and the resulting wide-area signal responses recorded. DVA readily provides a means of real-time visualization of an oscillating power system following a disturbance. With a little more effort, it can also provide Wide-Area Severity indexes (so-called WASIs) which measure the postcontingency stress quantitatively [4]. This paper constitutes a step toward applying WAMS as a dynamic information platform for DVA of large power systems. For this application, a large number of PMUs could improve the wide-area visibility but at a greater cost and increased complexity of the supporting ICT infrastructure (information, computers and telecommunication). Determining the number of PMUs and their area identity is further complicated when the power system is very large and distributed over a wide geographical area. In this work, the task of area identity of PMUs is formulated as a problem of power system coherency identification. Broadly speaking, two approaches exist for identifying electrical coherent regions in a power system. The first is the slowcoherency approach and related extensions, which require the computation of selected eigenvalues and eigenvectors of the full system [14], [15]. These methods are available in the DYNRED software developed by Ontario Hydro for EPRI in 1993 and later
0885-8950/$25.00 © 2007 IEEE
KAMWA et al.: AUTOMATIC SEGMENTATION OF LARGE POWER SYSTEMS
improved by General Electric [14]. Second, the disturbance simulation approach requires time-domain linear or nonlinear simulation of selected contingencies from which appropriate generator grouping features are extracted [16]–[21]. This approach can be generalized in a probabilistic or statistical way to include simulations of many topologies, contingencies and system parameters in computing the coherency measures between candidate loads and generators busses [5], [18]. This is particularly important when PMUs are being located for DVA, given that their aim is to capture the full nonlinear responses of the grid for all credible configurations, not only the small-signal signature of the participating generators. In this work, we extend the rms-coherency measure [16], [17] to nonlinear signal responses and demonstrate that it is a useful measure of dissimilarity between candidate buses for PMU sitting: the lower the measure the more coherent the buses. It is apparent from this definition that the time variation of all phasors in a coherent group can be satisfactorily approximated by observing a single phasor appropriately selected from the group. Consequently, it may not be required to place PMUs at multiple buses in a coherent group or the data from different PMUs in a group could be aggregated while extracting information. Once appropriate measures of the distance or coherency between busses are obtained, clustering analysis can be applied for region identification. Fuzzy c-means (FCM) is one effective unsupervised clustering approach in which a dataset is grouped into a number of overlapping clusters with every point in the set belonging to each cluster to a certain degree [22]–[24]. This “fuzziness” in the area boundaries is an especially useful concept when dealing with interconnected power systems for which, by definition, every bus is related to all other buses through strong or weak ties. FCM starts with an initial guess for the cluster centers and for each cluster; it assigns every data point a membership grade. By iteratively updating the cluster centers and the membership grades for each data point, so as to minimize the within-clusters distance, FCM moves the cluster centers to the proper location. Considering the bus grouping as a clustering task, FCM is applied to the coherency matrix of the power system, as defined in [5]. However, such grouping is sensitive to random initialization and yields virtual centers which cannot be associated with actual buses on the grid. Furthermore, the iterative process of the algorithm is time-consuming, especially when dealing with a large power system of say 1000 candidate busses. To overcome these drawbacks, we adopted the fuzzy c-medoids algorithm (FCMdd) developed in [25] for large-scale web-mining. A medoid is a representative bus whose average dissimilarity to all buses in the cluster is minimal. The initialization of the medoids is done by the sequential PMU placement
1975
technique as in [5], which uses the principle of maximum additional information (or equivalently, maximum dissimilarity) to add the next bus in the list. Unlike FCM, the proposed method proceeds by searching the medoid within each column of the coherency matrix. Thus, it is able to pinpoint the representative bus of a group, which is important information in the PMU configuration. The validity of the proposed FCMdd-based bus grouping is observed through tests on two power systems: 1) a 3-area IEEE RTS-96 system [26] and 2) a 9-area test system [4]. The results on coherency grouping by this method are provided and discussed. It is observed that the proposed approach is more suitable for grouping busses, in the context of PMU configuration of a large power system, with regard to speed of computation, robust performance, obtaining representative bus for each area and intuitive zone-partitioning. II. DEFINITION AND TECHNIQUE In this section, the coherency concept is defined and the coherency matrix is formulated. The commonly used fuzzy clustering technique is presented followed by its modified version, which is more suitable for large-network segregation and PMU configuration. A. Disturbance-Based Coherency A group of buses is said to be coherent with respect to angle stability when any network disturbance (bus bar or line short-circuit, single- or multiple-line outage, load or generation switching, etc.) applied outside the group results in all incremental time variations and of the bus angle and frequency, respectively, having the same sign within the are coherent group [16], [17]. Consequently, two buses for disturbance d when the following rms-coherency criterion is below a specified threshold [see (1) at the bottom of page] for
with , the number of candidate buses and , the observation time window. The angle coherency matrix is formed as
..
.
..
.
(2)
. where It can be observed that all the diagonal elements of this matrix are zero, meaning that the coherency of a given bus with respect , it to itself is exactly zero. Generalizing this result to
(1)
1976
IEEE TRANSACTIONS ON POWER SYSTEMS, VOL. 22, NO. 4, NOVEMBER 2007
appears that the coherency is “large” when busses and pertain to two distinct coherent groups and “small” when both and busses are members of the same coherent group. Similarly, the disturbance-based voltage coherency criterion [27] can be set using the relation
The conditions that apply in fuzzy clustering are
(6) and (7)
(3)
and the corresponding coherency matrix constructed as in (2).
The FCM clustering algorithm is based on minimization of the objective function
B. Probabilistic Coherency While the nonlinear nature of the power system is taken into account in the above coherency matrices, it has the drawback of relying on a single deterministic disturbance . In a probabilistic framework, multiple operating scenarios should be considered. The signal responses become random variables, making the coherency matrices random variables also. In what follows, we assume that a random variable can capture the stochastic nature of different operating conditions regarding different load-flow patterns, network topologies, and dynamic models. For each disturbances is considered over an scenario, the same set of observation time frame . In addition, let be a set containing all the scenarios considered and let , be the probability (weight) associated with scenario . Then (2) becomes
(8) is a parameter that controls the fuzziness of where is the vector of the clustering process and cluster centers. The algorithm then uses the following steps to obtain a local solution to the nonlinear optimization problem. 1) Random initialization of the membership matrix . 2) Calculation of the center vector
(9)
3) Updating the membership matrix by the relation (4) (10) For each scenario, the statistical coherency measure is averaged (expectation operator) over the disturbances considered in the candidate set. Also, notice that the scenarios are defined according to • seasonal load models and levels, i.e., peak and off-peak load models and levels for different seasons of the year; • varying network topologies for every seasonal load level, as a result of forced and scheduled outages of generators, lines, and transformers. C. Fuzzy -Means Algorithm [22]–[24] Clustering analysis provides a way to organize objects (data) into groups (clusters). Unlike hard clustering, fuzzy clustering allows an object to belong to several clusters simultaneously with different degrees of membership, which is precisely what happen to busses in an interconnected power system. busses of a power system be structured into c Let the groups; all the ’s in (2) are therefore denote the membership to be categorized into groups. Let to the th cluster. Defining grade of
with (11) The iterative process continues until a maximum number of iterations in the range of 1000 is reached or there is no additional reduction of the objective function. In an attempt to find a global solution, the above FCM loop can be improved by using many random trials in step 1): the final set of clustering is selected with minimum objective function throughout. D. Fuzzy Medoids Algorithm (FCMdd) denotes the dissimilarity between object and Let of X and be the vector of medoids. A medoid is a representative bus whose average dissimilarity to all buses in the cluster is minimal [25]. FCMdd algorithm minimizes the objective function
(12) (5)
KAMWA et al.: AUTOMATIC SEGMENTATION OF LARGE POWER SYSTEMS
where given by
and the membership
1977
used in this case is
(13)
is a function of the dissimilarities , it can be Since eliminated from the minimization function. The algorithm then proceeds as follows. 1) Pick initial medoid vector . 2) Compute the memberships using (13). 3) The medoid is updated by
(14) (15) The process continues until the new medoid vector is equal to the old one, which generally happens in less than 10 iterations. Quick comparison of the two clustering approaches indicates that (a) there is a difference in objective function and (b) FCMdd selects the medoids within the matrix columns whereas FCM computes fictitious centers according to (9). Fig. 1. Flow diagram for coherent grouping algorithm.
III. APPLICATION OF THE PROPOSED METHOD TO BUS GROUPING A. Coherency Identification: A Data Clustering Task When performing power system model reduction, generation busses are usually grouped based on the coherency concept. By contrast, PMU configuration for vulnerability assessment requires to group all types of bus, to which a generic coherency concept as in [16] should be applied. The time variation of all phasors in a coherent group can be studied from a single representative phasor selected from the group (indifferently a generator or load bus). Thus, the coherency identification task can be framed as a data clustering problem by suitably using the coherency matrix in (2). An FCM-based solution to data clustering is local and sensitive to the random initialization. It is therefore unsuitable for large power systems where it encounters a long searching process with a large coherency matrix. To overcome this problem, a medoid-based FCMdd algorithm is used. Initialization of the medoid vector is carried out by the computationally efficient sequential “addition” PMU placement algorithm of [5]. This technique uses the principle of maximum additional information (maximum dissimilarity with previous selections) to find the next bus for possible PMU placement. Therefore, the first buses at the top of the list obtained from this placement algorithm provide a good initialization of the medoids necessary for defining the centers of required clusters. The flow diagram of the FCMdd technique is provided in Fig. 1. The
technique has the natural advantages of fast computation and the capability to provide the identity of a highly representative bus in each group. B. Data Aggregation for DVA Application Once a set of PMUs has been configured in a network, the data available through the WAMS has to be analyzed online for DVA application. Depending on the number of PMUs and the signals to be analyzed, the volume of data for a typical system could be enormous. There is hardly any technique available today for DVA application using PMU data. For extracting features from PMU data, selection of proper signals is important. The demonstrating signals in this case include the voltage phasor magnitude and angle of all areas of the system; these signals are then suitably transformed to provide purposeful information for the vulnerability assessment process. The center of inertia (COI) concept as in [4] is applied to the angle of voltage phasor where the inertia of the system is used for equivalency. The formulation of the derived signal is recalled below [4]. For each area , an average angle is found from measurements PMUs in that area through the
(16)
1978
IEEE TRANSACTIONS ON POWER SYSTEMS, VOL. 22, NO. 4, NOVEMBER 2007
where is the angle measurement through th PMU in the area. For a -areas system, the COI signal is defined as
(17) where
is the total inertia of the power system, defined as
(18) The th area signal referred to the COI signal becomes
(19)
IV. POWER SYSTEMS To evaluate the proposed approach, two test systems of three and nine areas, respectively, are considered. These two systems are presented in Figs. 2 and 3. A. Three-Area IEEE RTS-96 System [26] The topology of the three-area IEEE-96 system is shown in Fig. 2. The system is framed by replicating the IEEE RTS-79 network three times and with few interconnections. A 72-mile 230-kV line connects area 2 to area 3 and a 67-mile 230-kV line connects area 1 to area 3. Details on line, load and generator data are available in [26]. In the bus numbering of the system, the first digit represents the area number from 1 to 3. To construct the coherency matrix as in (2), four primary scenarios were considered: the base case and the base case with missing tie-lines between areas 1–2, 1–3, and 2–3, respectively. From these primary configurations, stressed cases with 10% and 15% load increases were generated, resulting in a total of 12 scenarios. Following the suggestion in [28], 18 single contingencies and one double contingency were defined in each area, for a total of 57 contingencies per load-flow scenario. The contingencies involved shedding of the largest generators and loads in each area, as well as bus fault events with outages on lines 1–5, 2–6, 3–9, 4–9, 7–8, 14–11, 15–24, 17–22, 21–22. The coherency matrices from the various disturbances were averaged assuming equi-probability of the events to obtain a single probabilistic coherency matrix as in (4). B. Nine-Area Test System [4], [5] This system consists of two relatively small-size cells of six or nine buses replicated a number of times with different dynamic data and interconnection using tie-lines of different power transfer capability. The overall network has 67 busses, 79 branches, and 23 machines modeled in detail (with speed and voltage regulators, in addition to a few power system stabilizers) and about 7000 MW of nonlinear loads spread over nine geographical areas closely overlapping the underlying
Fig. 2. Topology of the 3-area system.
electrically coherent areas. Fig. 3 illustrates the topology of this network and the details on various data are available in [4].
KAMWA et al.: AUTOMATIC SEGMENTATION OF LARGE POWER SYSTEMS
1979
Fig. 3. Topology of the 9-area system.
Five load-flow scenarios were selected from a previous study [5]: a base system with small inter-area power flows, and four variants with a forced 180-MW power flow from areas 7 to 2, 7 to 8, 6 to 2, and 9 to 3, respectively. Moreover, three dynamic configurations with varying PSS, winter and summer load parameters were considered together with 32 contingencies evenly spread over the nine areas, for a total of 480 simulations. In evaluating the probabilistic coherency matrix, all contingencies were considered to offer the same likelihood. V. RESULTS A. Bus Grouping The FCMdd algorithm illustrated in Fig. 1 is applied to group the busses. The value of in the fuzzy membership function is selected as 1.25 for the algorithm throughout. Picking the set achieving the smallest value of the objective function, the algorithm provides the optimal grouping of buses, with their membership value for each group and the medoid bus (representative bus) of that group. The group identity of a bus is decided on the basis of the maximum membership value of that bus to clusters. Thus, for a power system, the group identity of each bus is obtained along with its group representative bus. With consideration for a large
system, the results shown below are with random bus ordering provided initially to the FCMdd. While grouping the buses of the 3-area system using a coherency approach, an initial study reveals that buses 107, 207, and 307 are special ones where load and generation match. To avoid confusion in the end result on grouping, these buses are excluded (otherwise they would result as a single-bus area.) The number of groups that the system has to be partitioned into is not known a priori for a practical system. Furthermore, the number of areas should be a trade-off between the level of detail required (i.e., good geographical dispersion of the zones and associated PMU) and the obvious need for the minimum number of areas possible (i.e., principle of parsimony). Therefore, several runs are performed for different orders of grouping. The grouping results for the 3-area system are provided in Table I where the second column gives the results from FCMdd with three clusters requested. In each cluster, the first digit of the bus number is the same, indicating the accuracy of the approach. The medoid bus of each group is marked with bold letters. It is the last bus and its mates are sorted with a decreasing order of dissimilarity. Another run was made with 6-area partitioning, the result is shown in the third column. It is observed that, in each cluster, the first digit of each bus number is the same. The
1980
IEEE TRANSACTIONS ON POWER SYSTEMS, VOL. 22, NO. 4, NOVEMBER 2007
TABLE I BUS GROUPING RESULTS FOR 3-AREA SYSTEM
Fig. 5. FCM grouping for 3-area system, six clusters.
Fig. 4. FCM grouping for 3-area system, 3 clusters.
six clusters are achieved by dividing each area into two; and symmetry is also observed in the partitioning. The above two sets of results are shown with bar plots in Figs. 4 and 5 with their corresponding membership values. The grouping is obtained by assigning a bus to that cluster for which its corresponding membership value is optimum. The high membership values of each bus in its respective group indicate the strength of the approach in clustering data appropriately. The FCMdd approach has the advantage of partitioning the power system efficiently and in finding the cut-sets. For example, when seeking the necessary cut-sets for splitting each area of the 3-area system into two and three zones (or sub-areas), the result obtained from the method is shown in Fig. 6. The figure shows two-zone partition of a single area delineated by a solid line. For the three-zone partition, the zone within a solid line is further divided into two, as shown by the dashed line. Thus, for automatic partitioning of area (to find minimum cut-
Fig. 6. Zone partitioning of an area though FCMdd (2 and 3 partitions).
sets), the method does not require any of the additional steps involved in other approaches [15]. For the 9-area power system, simulations are carried out for different numbers of clusters. Table II provides the bus grouping results for six and nine clusters. The 9-cluster result in third column is accurate when compared with the network connection diagram of Fig. 3. Few buses connected through a tie line are grouped in the adjacent area, which is obvious.
KAMWA et al.: AUTOMATIC SEGMENTATION OF LARGE POWER SYSTEMS
1981
TABLE II BUS GROUPING RESULTS FOR 9-AREA SYSTEM
Fig. 8. FCMdd grouping of the 9-area system into 9 clusters.
Fig. 7. FCMdd grouping of the 9-area system into 6 clusters.
For example, bus 46 (of area 4 in the diagram) connected by a tie line to area 3 in the diagram is included in the third cluster, which is correct as far as the definition of coherency is concerned. Similarly the 6-cluster result in column 2 is accurate. The bus grouping shown in Figs. 7 and 8 along with the corresponding membership values confirm the robustness of the proposed approach. B. Coherency Matrix Plot The coherency matrix as defined in (2) is indicative of the dissimilarity index among different buses. Initially, when such a matrix is formed, it is difficult to interpret. However, with FCMdd-based grouping of busses, the matrix row and columns can be sorted so that each cluster covers a distinct region along the diagonal. Fig. 9 shows the plot of the coherency matrix for a three-cluster grouping of the 3-area system busses. The plots are obtained through “imagesc” command in Matlab.
Fig. 9. The coherency matrix plot of 3-area system as obtained by FCMdd algorithm for (a) the initial grouping and (b) the final grouping into three clusters.
The color bar indicates that “blue” denotes a strong association among buses (with negligible dissimilarity) and “red” denotes weak association. The first plot of the matrix is obtained when it was formed while randomly incorporating the busses, which may be the usual case for large power systems. After sorting the matrix in order of the clusters obtained by the clustering method, the matrix plot clearly indicates that the blue patches represent the coherent groups. Thus, a plot such as this provides evidence of the proper grouping by the algorithm. It is understood that such a plot will be also useful in fixing the number of areas of a large system. The sorted angle and voltage
1982
IEEE TRANSACTIONS ON POWER SYSTEMS, VOL. 22, NO. 4, NOVEMBER 2007
Fig. 11. Time variation plot of voltage frequency and angle for the medoid buses of the 9-area system (angles are referred to the average angle). Fig. 10. The coherency matrix plot of 3-area system for (a) angle and (b) voltage based on the FCMdd three-cluster grouping.
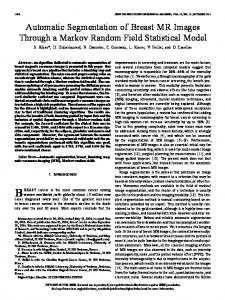
coherency matrices are plotted similarly and shown in Fig. 10. as The angle here refers to the bus voltage angle deviation mentioned in the bus coherency definition in Section II-A. The result shown is in agreement with the definition of coherency and also as found in earlier grouping. C. Verifying Coherency Grouping The medoid bus information as obtained from FCMdd based grouping is another important aspect in a PMU configuration. To see the performance in this respect, a test case involving a 6-cycle fault in area 9 is observed with the angle plots of all center buses, as shown in Fig. 10. The diversity in the figure indicates that each center bus which should be the representative bus for its area is properly identified. The diversity in the plot is also indicative of the proper grouping performance of the applied FCMdd technique. To further investigate the coherency of the center buses in the main natural modes present in the contingency of Fig. 11, a parametric fitting method [29] very similar to the well-known Prony analysis was applied simultaneously to the nine medoids bus frequency signals after the system average frequency was subtracted. The resulting frequency and relative damping of the four dominant modes are
Fig. 12. Ranking the observability of four natural modes at the nine medoidbuses. Magnitude and shape of the observability measure are normalized (to 1 and 0, respectively) with respect to the bus with maximum observability.
based bus placement is wider in scope than eigenvalue based-coherency and related methods [20] since it can deal automatically with buses participating significantly in more than a single mode, as evidenced by the rms-coherency formula in (1). where the natural frequencies are in Hz. According to the phase shape mapping in Fig. 12, medoids 1, 3, and 9 are coherent at 0.49 Hz and in opposition to all other medoids. However, medoids 1 and 3 are not coherent with medoid 9 at 0.26 Hz, which explains why areas 1 and 3 are distinct electrical regions even if coherent in one mode. Generally speaking, FCMdd-
D. Data Aggregation for DVA As mentioned earlier, data screening for a large power system is cumbersome due to volume and grouping requirements. Particularly in a DVA context, it is hard to decide which PMU-data should be processed for a particular task (angle or voltage instability indices). This can be observed from Fig. 13, which shows
KAMWA et al.: AUTOMATIC SEGMENTATION OF LARGE POWER SYSTEMS
1983
Fig. 14. Area-wise angle and voltage features for DVA application (same contingency as in Fig. 11).
Fig. 13. Plots of the 67 bus 9-area system (a) voltage and (b) angle (same contingency as in Fig. 11).
the magnitude and angle plots of all bus voltages for a disturbance in the 9-area system. The area-wise PMU configuration as obtained through FCMdd provides a solution which is demonstrated by means of a case from the 9-area system. Assuming that this system is monitored using a WAMS equipped with 38 PMUs located as in [5], the results in Fig. 13 are grouped on the basis of the area-identity of each PMU, together with (16)–(19). The COI referred angle curve of each area is thus obtained, with area inertia and MVA ratings described in [4]. Fig. 14 shows the aggregation results, where the clear separation among the curves, the sharpness of the swing and the elimination of low-frequency trends are indicative of the proper group formation. These results can be further processed for possible decision or control action [6]. The second plot in the figure presents the area-wise voltage information and the separation among curves clearly underscores the strength of the approach.
Fig. 15. Coherency matrix plot of 3-area system as obtained by FCM algorithm for (a) the initial grouping and (b) the final three-cluster grouping. TABLE III FCM-BASED BUS GROUPING RESULT FOR 9-AREA SYSTEM
VI. COMPARATIVE ASSESSMENT Although FCM-based clustering is widely used in different fields of science and technology [24], it has the inherent problem of initialization and a time challenge for a large-size power system. The random initialization poses further questions such as: how many trials? However, its simplicity and readiness (in
Matlab for instance) may favor this technique for smaller systems and the results may be reasonably good, as observed on the 3-area system (Fig. 15). However, with a larger system size, the inherent limitations of FCM are increased, as illustrated in Table III, showing the results of a 9-cluster grouping of the 9-area system. The clustering
1984
IEEE TRANSACTIONS ON POWER SYSTEMS, VOL. 22, NO. 4, NOVEMBER 2007
partitioning with a minimal number of cut-sets, as enumerated in the last section, for which there is no extra computational requirement. VII. CONCLUSIONS
Fig. 16. Normalized (with respect to the maximum) error plot for the FCMdd algorithm applied to the nine area test system.
Applying the coherency concept, an algorithm is devised for segregating a power system into different areas which can be effectively used for vulnerability assessment. The FCMdd algorithm, combined with the fuzzy membership concept and based on the principle of dissimilarity, has the efficient capability to group the buses into the required number of areas. Its performance is judged on the basis of various test results for two power systems. A feasible application to data aggregation, for a vulnerability assessment, is demonstrated. Its strength in representative bus identification and zone partitioning is also assessed. Over recent years, the proposed approach has been successfully applied to the Hydro-Quebec’s system [1], [4], [5]. REFERENCES
Fig. 17. Normalized (with respect to the maximum) error plot for the FCM algorithm applied to the nine area test system.
is unsuitable; for example, cluster 3 includes buses (51, 52, 25 and 23) from different areas, as evident from the network diagram. The normalized error plots as a function of the iterations index for the 9-area system (9 clusters), are shown in Figs. 16 and 17 for FCMdd and FCM, respectively. It is observed from these plots that the variation in error is significantly high in the case of the latter approach, raising doubts as to its robustness. On the other hand, the plots show that the error variability of the former and the number of iterations it requires are significantly reduced. Moreover in the computation process of bus grouping, for wide-area measurement applications, knowledge about the representative bus of each area is important. This is not possible to obtain by means of FCM. As seen from the equations of the algorithm, it proceeds by selecting a fictitious center which is not taken from the coherency matrix column. On the other hand, the proposed approach is based on the medoids, which are always selected from the coherency matrix column. These medoids are ultimately the representative bus of different groups. The other important advantage of the proposed method is efficient zone
[1] I. Kamwa, J. Béland, G. Trudel, R. Grondin, C. Lafond, and D. McNabb, “Wide-area monitoring and control at Hydro-Québec: Past, present and future,” in Proc. IEEE/Power Eng. Soc. General Meeting, Panel Session PMU Prospective Applications, 2006, Montreal, QC, Canada, Jun. 18–22, 2006. [2] “Steps to establish a real-time transmission monitoring system for transmission owners and operators within the eastern and western interconnection,” in DOE-FERC Rep. Congr. Pursuant Sect. 1839 Energy Policy Act 2005, Feb. 2006. [Online]. Available: http://www.oe.energy.gov/DocumentsandMedia/final_1839.pdf. [3] , CIGRÉ WG C4.6.01, Task Force on Wide Area Monitoring and Control for Transmission Capability Enhancement Final Cigré tech. rep. (C. Rehtanz, Convener), Dec. 2006. [4] I. Kamwa, R. Grondin, and L. Loud, “Time-varying contingency screening for dynamic security assessment using intelligent-systems techniques,” IEEE Trans. Power Syst., vol. 16, no. 3, pp. 526–536, Aug. 2001. [5] I. Kamwa and R. Grondin, “PMU configuration for system dynamic performance measurement in large, multiarea power systems,” IEEE Trans. Power Syst., vol. 17, no. 2, pp. 385–394, May 2002. [6] I. Kamwa, A. K. Pradhan, and G. Joos, “Extracting features for power system vulnerability assessment from wide-area measurements,” in Proc. 1st CIGRE-Canada Conf. Power Syst., Montreal, QC, Canada, Oct. 2006. [7] K. E. Martin, “Phasor measurement systems in the WECC,” in Proc. IEEE/Power Eng. Soc. General Meeting Panel Session PMU Prospective Applications, 2006, Montreal, QC, Canada, Jun. 18–22, 2006. [8] J. Bertsch, C. Carnal, D. Karlson, J. McDaniel, and V. Khoi, “Widearea protection and power system utilization,” Proc. IEEE, vol. 93, no. 5, pp. 997–1003, May 2005. [9] X. Xiaorong, X. Yaozhong, X. Jinyu, W. Jingtao, and H. Yingdao, “WAMS applications in Chinese power systems,” IEEE Power Energy Mag., vol. 4, no. 1, pp. 54–63, Jan.-Feb. 2006. [10] J. Y. Cai, H. Zhenyu, J. Hauer, and K. Martin, “Current status and experience of WAMS implementation in north America,” in Proc. IEEE/ Power Eng. Soc. Transmission Distribution Conf. Exhib.: Asia Pacific, 2005, 2005, pp. 1–7. [11] M. Donnelly, M. Ingram, and J. R. Carroll, “Eastern interconnection phasor project,” in Proc. 39th Annu. Hawaii Int. Conf. Syst. Sci. (HICSS’06), Kauia, HI, Jan. 4–7, 2006, vol. 10, pp. 245a–245a. [12] M. G. Adamiak et al., “Wide area protection—technology and infrastructures,” IEEE Trans. Power Del., vol. 21, no. 2, pp. 601–609, Apr. 2006. [13] G. N. Korres and G. C. Contaxis, “A tool for the evaluation and selection of state estimator measurement schemes,” IEEE Trans. Power Syst., vol. 9, no. 2, pp. 1110–1116, May 1994. [14] W. W. Price, A. W. Hargrave, and B. J. Hurysz, “Large-scale system testing of a power system dynamic equivalencing program,” IEEE Trans. Power Syst., vol. 13, no. 3, pp. 768–774, Aug. 1998. [15] H. You, V. Vittal, and X. Wang, “Slow coherency-based islanding,” IEEE Trans. Power Syst., vol. 19, no. 1, pp. 483–491, Feb. 2004.
KAMWA et al.: AUTOMATIC SEGMENTATION OF LARGE POWER SYSTEMS
[16] S. Sastry and P. Varaiya, “Coherency for interconnected power systems,” IEEE Trans. Autom. Control, vol. AC-26, no. 1, pp. 218–226, Feb. 1981. [17] J. S. Lawler and R. A. Schlueter, “Computational algorithms for constructing modal-coherent dynamic equivalents,” IEEE Trans. Power App. Syst., vol. PAS-101, no. 5, pp. 1070–1080, 1982. [18] L. Wehenkel, “A statistical approach to the identification of electrical regions in power systems,” presented at the Proc. IEEE/KTH Stockholm Power Conf., Stockholm, Sweden, Jun. 22–28, 1995, Paper SPT PS 17-03-0237, unpublished. [19] H. H. Wilfert, K. Voigtländer, and I. Erlich, “Dynamic coherency identification of generators using self-organising feature maps,” Control Eng. Pract., vol. 9, no. 7, pp. 769–775, 2001. [20] M. Jonsson, M. Begovic, and J. Daalder, “A new method suitable for real-time generator coherency determination,” IEEE Trans. Power Syst., vol. 19, no. 3, pp. 1473–1482, Aug. 2004. [21] M.-H. Wang and H.-C. Chang, “Novel clustering method for coherency identification using an artificial neural network,” IEEE Trans. Power Syst., vol. 9, no. 4, pp. 2056–2062, Nov. 1994. [22] S.-C. Wang and P.-H. Huang, “Fuzzy c-means clustering for power system coherency,” in Proc. Int. Conf. Syst., Man, Cybern., Waikoloa, HI, Oct. 10–12, 2005, vol. 3, pp. 2850–2855. [23] A. V. Machias, J. L. Souflis, and B. C. Papadias, “Fuzzy clustering applied to transient stability evaluation of electric power systems,” in Proc. IEEE Conf. Syst., Man, Cybern., 1988, pp. 63–65. [24] F. Höpner, F. Klawonn, R. Kruse, and T. Runkler, Fuzzy Cluster Analysis. New York: Wiley, Jan. 2000. [25] R. Krishnapuram, A. Joshi, and O. Nasraoui, “Low-complexity fuzzy relational clustering algorithms for web mining,” IEEE Trans. Fuzzy Syst., vol. 9, no. 4, pp. 595–607, Aug. 2001. [26] “The IEEE reliability test system—1996,” IEEE Trans. Power Syst., vol. 14, no. 3, pp. 1010–1020, Aug. 1999. [27] M. M. Begovic and A. G. Phadke, “Voltage stability assessment through measurement of a reduced state vector,” IEEE Trans. Power Syst., vol. 5, no. 1, pp. 198–203, Feb. 1990. [28] Y. Ou and C. Singh, “Assessment of available transfer capability and margins,” IEEE Trans. Power Syst., vol. 17, no. 2, pp. 463–468, May 2002. [29] I. Kamwa, R. Grondin, E. J. Dickinson, and S. Fortin, “A minimal realization approach to reduced-order modelling and modal analysis for power system response signals,” IEEE Trans. Power Syst., vol. 8, no. 3, pp. 1020–1029, Aug. 1993.
1985
Innocent Kamwa (S’83–SM’98–F’05) received the Ph.D. degree in electrical engineering from Laval University, Quebec City, QC, Canada, in 1988. Since then, he has been with the Hydro-Québec Research Institute, Varennes, QC, where he is at present a Principal Researcher with interests broadly in bulk system dynamic performance. Since 1990, he has held an Associate Professor position in electrical engineering at Laval University. Dr. Kamwa is a member of CIGRÉ. He is recipient of the 1998 and 2003 IEEE PES Prize Paper Awards and is currently serving on the System Dynamic Performance Committee AdCom. He is also the acting Standard Coordinator of the PES Electric Machinery Committee and an associate editor of the IEEE TRANSACTIONS ON POWER SYSTEMS.
Ashok Kumar Pradhan (M’94) received the Ph.D. degree in electrical engineering from Sambalpur University, India. He has been with the Department of Electrical Engineering, Indian Institute of Technology, Kharagpur, since 2002. He was with the Department of Electrical Engineering, University College of Engineering Burla, India, from 1992 to 2002. He visited McGill University in 2006. His research interest includes power system dynamics and relaying. Dr. Pradhan is a recipient of the Young Engineer Award, Indian National Academy of Engineering, India.
Géza Joós (F’06) received the M.Eng. and Ph.D. degrees from McGill University, Montreal, QC, Canada. His employment experience includes ABB, the Ecole de Technologie Supérieure, Concordia University, and McGill University. He is involved in fundamental and applied research related to the application of high-power electronics to power conversion and power systems. Dr. Joós was chair (2004–2005) of the Industrial Power Converter Committee of the IEEE Industry Applications Society (IAS) and is active in a number of IEEE Power Engineering Society working groups. He is a member of the Executive Committee of the CIGRE Canadian National Committee.