to predict material weaknesses in a firm's internal control system after the ... Keywords: Sarbanes-Oxley, data mining, material weakness, multiple criteria linear ...... published in the Contemporary Accounting Research, Abacus, the ...
The Journal of Applied Business Research – November/December 2009
Volume 25, Number 6
Predicting Material Weaknesses In Internal Control Systems After The Sarbanes-Oxley Act Using Multiple Criteria Linear Programming And Other Data Mining Approaches Wikil Kwak, University of Nebraska at Omaha, USA Susan Eldridge, University of Nebraska at Omaha, USA Yong Shi, Graduate University of the Chinese Academy of Science, China and University of Nebraska at Omaha, USA Gang Kou, University of Electronic Science and Technology of China, China
ABSTRACT Our study proposes a multiple criteria linear programming (MCLP) and other data mining methods to predict material weaknesses in a firm’s internal control system after the Sarbanes-Oxley Act (SOX) using 2003-2004 U.S. data. The results of the MCLP and other data mining approaches in our prediction study show that the MCLP method performs better overall than the other data mining approaches using financial and other data from the Form 10-K report. Consistent with prior research, firms that disclosed material weaknesses in their SOX Section 302 disclosures were more complex (based on the existence of foreign currency translations), more often used Big 4 auditors, and had lower operating cash flows-to-total assets ratios than the non-material weakness control firms. Because of mixed results on several profitability measures and marginal predictive ability for the MCLP and other methods used, more research is needed to identify firm characteristics that help investors, auditors, and others predict material weaknesses. Keywords: Sarbanes-Oxley, data mining, material weakness, multiple criteria linear programming
1.
INTRODUCTION
T
he Sarbanes-Oxley Act (SOX) of 2002 was introduced to improve the quality of financial reporting and minimize corporate fraud in the U.S., but opponents have been concerned that the costs of implementing the provisions of SOX may outweigh the benefits. Two sections of the SOX in particular, Section 302 and Section 404, focus on required reporting on the effectiveness of and any material weaknesses in internal controls over financial reporting by companies’ managements and certifications by specific corporate officers. SOX Section 404 requires management to report to shareholders acknowledging its responsibility to detect and prevent material weaknesses in internal controls over financial reporting and indicating the effectiveness of these internal controls. In addition, auditors are required to report on client assertions regarding the effectiveness of these internal controls and the existence or absence of material weaknesses in their internal control systems (SOX 2002). Based on research by Eldridge and Kealey (2005), the new SOX Section 404 audit, first required for years ending on or after November 15, 2004, was the primary contributor to the average audit fees increase of $2.3 million from 2003 to 2004 for their sample of Fortune 1000 companies. That research also indicated that smaller firms had higher SOX audit unit costs than did larger firms, and this may result from smaller firms spending less resources on internal control systems and thereby being more susceptible to having internal control weaknesses. Because of public concern about the high cost of implementing SOX requirements, the Securities and Exchange Commission (SEC) held roundtable discussions in 2005 and 2006, has issued various proposals and discussion documents soliciting public 105
The Journal of Applied Business Research – November/December 2009
Volume 25, Number 6
comments, and has worked closely with the Public Company Accounting Oversight Board (PCAOB) to understand the challenges of implementing the internal control reporting requirements of the SOX and to try to ease the SOX 404 burden. Although SOX Sections 302 and 404 require companies to report on material weaknesses in internal controls, an interesting research question is whether certain firm characteristics, other than size, are associated with firms having internal control weaknesses so that such characteristics may be used to identify or predict material weakness firms prior to the reporting of such information. This issue is important for auditors in their audit planning in order to structure more rigorous auditing of the internal control systems of firms that may appear more likely to have internal control problems and could help these auditors better estimate their audit fees. In this study, we address this research question by proposing a multiple criteria linear programming (MCLP) and other data mining approaches for the post-SOX prediction of internal control weaknesses using firm characteristics. Our findings also will be important for regulators for implementing public policy. Investors may be interested in our findings to better assess companies’ risk when they make portfolio decisions. Data mining has been applied in the modern business world with powerful computing capabilities. Even small and mid-sized firms are using these affordable analytical tools (Spinelli 2005). More applications have been used in accounting areas where accountants deal with large amounts of computerized operational as well as financial databases, and there are higher potential payoffs for data mining applications for prediction studies such as bankruptcy prediction, fraud detection, detection of tax evasion, and risk-profiling as a SOX-audit planning tool for assessing internal control weaknesses of a firm. Our paper is organized as follows: The next section presents the background and prior research relevant to our study. The third section presents our MCLP data mining model. The fourth section describes our sample data and reports our empirical results using MCLP and other data mining tools. The last section concludes with a summary of our findings and future research avenues. 2.
BACKGROUND AND PRIOR RESEARCH
Even though SEC statistics from 1991 through 2001 document allegations of financial fraud among SEC registrants to be less than three percent in any given year (Dooley 2002), major financial fraud, such as the fraudulent acts committed by Enron and WorldCom, has severely damaged investor confidence in the financial markets. Therefore, the SOX was introduced to minimize financial fraud and reestablish investor confidence by improving corporate governance mechanisms and requiring certain management assertions, officer certifications, and audits of firms’ systems of internal controls over financial reporting. Section 404 of the SOX included two objectives that focused on internal controls over financial reporting. The first objective, the inclusion in a firm’s annual report of a report by management stating its responsibility for internal controls over financing reporting and its assessment of the effectiveness of these internal controls (SOX 2002, Sec. 404(a)), has been effectuated by the addition of Item 308 to Regulations S-B and S-K (SEC 2003a). Item 308(a) requires management to include an internal control report in its annual statement filing and states that this required internal control report must include four items: management’s statement of responsibility for internal controls over financial reporting, identification of the framework used by management to evaluate the effectiveness of these internal controls, management’s conclusion regarding the effectiveness of these controls and disclosure of any material weaknesses, and management’s confirmation that its auditors have issued their required attestation report on these controls. Item 308(b) requires firms to include the auditor’s internal control attestation report in their annual report filings, and Item 308(c) requires firms to disclose on a quarterly basis any material changes to these internal controls. The second objective, requiring the firm’s independent auditors to attest to management’s internal control assessment as part of the annual audit engagement (SOX 2002, Sec. 404(b)), has been effectuated by the SEC’s (2003a) amendment to Rule 2-02 of Regulation S-X to require the accountants auditing the annual financial statements to also attest to and report on management’s assessment of its internal control effectiveness. According to the SEC’s Release No. 33-8392 (SEC 2004a), these changes in SEC rules and regulations in accordance with the SOX Section 404 were effective for accelerated filers with fiscal years ending on or after November 15, 2004. Even with these SOX provisions in place, recent significant events such as the meltdown of the sub-prime mortgage housing market, bankruptcies and/or mergers of major financial institutions, and potential U.S. government bailout plans for major industries (e.g. auto industry) have had an extreme negative impact on investor confidence. 106
The Journal of Applied Business Research – November/December 2009
Volume 25, Number 6
These issues of financial fraud and other events that decrease investor confidence are not only a U.S. problem; the global economy and capital markets have experienced declines due to corporate fraud and recent problems in the financial services industry. So, our study is a timely attempt at understanding risk factors for weaknesses in internal controls over financial reporting because a better understanding of such factors can help to rebuild investor confidence. The SOX Section 302 increases disclosure requirements through officer certifications regarding the reporting by officers on the effectiveness of a firm’s internal control system and on significant changes of its internal control system (Ge and McVay 2005). In the SEC’s Release No. 33-8124 (SEC 2002), the SEC adopted “new Exchange Act Rules 13a-14 and 15d-14 (that) require an issuer's principal executive officer or officers and the principal financial officer or officers, or persons performing similar functions, each to certify in each quarterly and annual report, including transition reports, filed or submitted by the issuer under Section 13(a) or 15(d) of the Exchange Act that … he or she and the other certifying officers have indicated in the report whether or not there were significant changes in internal controls or in other factors that could significantly affect internal controls subsequent to the date of their evaluation, including any corrective actions with regard to significant deficiencies and material weaknesses.” These certifications are required in filings for periods ending after August 29, 2002. We apply the MCLP and other data mining approaches in our prediction study using Section 302 disclosures made in 2003 and 2004 to propose an efficient and effective assessment of internal control weaknesses of a firm after the SOX. Artificial neural networks and a fuzzy set approach have both been used in management fraud and internal controls research. Fanning et al. (1995) used artificial neural networks to detect management fraud. Using Loebbecke et al.’s (1989) approach which provides analytical procedure for detecting the risk of management fraud, Fanning et al. further developed the discriminant function that provides a set of questions to detect management fraud. Deshmukh et al. (1997) proposed a fuzzy set approach that provides guidelines to measure and combine red flags, and it can be used to build fuzzy reasoning systems that assess the risk of management fraud. Cooley and Hicks (1983) previously used a similar approach by using a combination of linguistic approaches of a questionnaire to assess internal control weaknesses. Korvin et al. (2004) recently proposed a pragmatic approach to assess risks of internal control using the fuzzy set theory. Their approach is useful for the computer-based accounting information system’s internal control. The above fuzzy set approaches can be a useful solution if managers can develop the logics or questionnaires of their internal control systems. However, this could be expensive and time consuming, and King (2005) even proposes applying 20:80 rules for the property, plant, and equipment account control for effective SOX compliance. Because our study focuses on prediction of firms with material weaknesses in internal controls, prior bankruptcy prediction studies provide support for our approach in this paper. Using the log-linear logistic regression model, Senteney et al. (2006) empirically document that qualified auditor opinions and auditor changes are associated with increasing probability of bankruptcy in addition to six common financial ratio variables (covering three dimensions – liquidity, leverage, and return on assets) previously used by other firm bankruptcy prediction studies such as Altman et al. (1977) and Zmijewski (1984). Ohlson (1980) used a logit model that does not require any assumptions about the prior probability of firm financial distress with nine independent variables, including five financial ratios, for predicting bankruptcy, and six of the nine variables had statistically significant coefficients. Although we know of no studies that have tested for an association between material weaknesses in internal control and firm bankruptcy, firms with internal control weaknesses may be more susceptible to firm failure than those without such weaknesses. Therefore, financial ratios relevant to predicting firm distress may also be useful in predicting the existence of internal control weaknesses in a firm, and we use a number of financial ratios used in prior bankruptcy prediction studies in our internal control weakness prediction models. These variables are described in section four of this paper. Ge and McVay (2005) investigate five firm characteristics, business complexity, firm experience, size, profitability, and auditor, of firms that disclosed material weaknesses in Section 302 disclosures from August 2002 through November 2004 versus all other Compustat firms with 2003 data, and they find that all of these characteristics except for firm experience appear to be associated with firms that disclose internal control weaknesses. We also include their variables in our study. Several recent research studies have investigated the relationship between audit fees and internal control problems reported through Section 302 and/or Section 404 disclosures. Hogan and Wilkins (2008) find evidence that auditors charge higher audit fees when internal control deficiencies exist. Similarly, Hoitash et al. (2008) not only 107
The Journal of Applied Business Research – November/December 2009
Volume 25, Number 6
document the strong association between audit fees and internal control problems disclosed in SOX reports but also provide evidence that audit fees are higher for more severe internal control weaknesses. Both of these studies use a standard audit fees model in which they control for factors other than internal control weaknesses or deficiencies that affect audit fees, such as firm size, complexity, leverage, profitability (including a separate indicator for firms reporting losses), liquidity, and large auditors, and we include similar variables in our study. Ettredge et al. (2007) estimate a logistic regression with the dependent variable being one if the firm dismissed its auditors and zero otherwise and find that audit clients paying higher fees were more likely to dismiss their auditors immediately after the passage of the SOX. They also document that auditor dismissals are associated with subsequent reporting of material weaknesses in internal controls. Because of this empirical relationship between auditor changes and material weaknesses, we include two auditor change variables (one for the auditor change for the year and the other for the auditor changes within five years) in our analysis. Beneish et al. (2008) find that Section 302 disclosures provide information to investors, but Section 404 disclosures have no effect on stock prices or firms’ cost of capital. In addition, auditor quality (measured using an indicator variable equal to one if the audit firm is a Big 4 firm, and zero otherwise) reduced the negative abnormal returns surrounding Section 302 disclosures and larger firms (using an indicator variable for accelerated and non-accelerated filers) had less negative abnormal returns surrounding Section 404 disclosures of material weaknesses. Therefore, auditor quality is an important factor and is included in our study. Hammersley et al. (2008) find similar results using the stock price reaction to the SOX Section 302 disclosures. They find that the information content of internal control weaknesses disclosed in Section 302 disclosures depends on the factors of internal control weaknesses, such as their severity and auditability, and the vagueness of disclosures. The results of both of these studies indicate that investors react to information about the existence of internal control weaknesses, so the results of our study may indeed benefit investors by providing them with ways to predict material weaknesses. Generally, a prediction study such as ours or firm bankruptcy prediction studies as we discussed previously do not have a clear theory. However, this lack of theory is not a major problem in prediction studies since we are more interested in prediction of internal control weaknesses of a firm. Prediction models to assess internal control weaknesses of a firm should attempt to establish criteria that will address the motivation for management assessment of risk factors (Jones, 1987). We also are interested in firm characteristics of material weakness firms vs. those of non-material weakness firms. There are two types of errors (Type-I and Type-II) involved in prediction studies. Type-I error refers to false rejection error. For example, in a bankruptcy prediction study, we reject the null hypothesis that a firm is a bankruptcy firm even though the firm is actually a bankruptcy firm. In terms of material weaknesses in internal control, a Type-I error occurs when we incorrectly predict that a firm has no material weaknesses when, in fact, it does have material weaknesses in internal control. This type of error will be very costly for a decision maker. A Type-II error is a false acceptance error. For example, we predict a firm to be a bankrupt firm, or in the case of our study, a firm with material weaknesses in internal control, thereby accepting the null hypothesis that the firm is a bankruptcy firm, or in our case a material weakness firm, even though the null is false. In the Type-II error case, the cost of misclassification is not as severe as in the Type-I error case. For our study, we focus on Type-I error because the cost of misclassifying can be significant. We propose using a multiple criteria linear programming model (MCLP) for material weakness prediction (as discussed in the following section) because this MCLP and other prediction models have been used in previous bankruptcy prediction studies. Kwak et al. (2006a) and Kwak et al. (2006b) both used this same MCLP model with U.S. and Japanese firms, respectively, for predicting bankruptcy, and Kwak et al. (2006b) results were better (had lower Type I errors) using this model with Japanese firms than the Kwak et al. (2006a) results using this model with U.S. firms. Sung et al. (1999) used the decision tree approach to develop bankruptcy prediction models for normal and crisis economic conditions. They found different ratios are significant in different economic conditions using Korean data from 1991 to 1998. We also use the decision tree approach in this study for comparison.
108
The Journal of Applied Business Research – November/December 2009 3.
Volume 25, Number 6
MODELS OF MULTIPLE CRITERIA LINEAR PROGRAMMING CLASSIFICATION
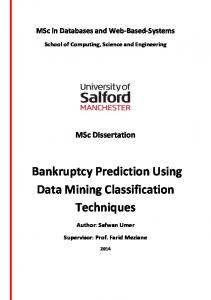
The data mining algorithms can be implemented by several methods of mathematical techniques. For example, classification or prediction methods can be constructed by neural networks, statistics, and decision tree as used in previous studies (Shi et al., 2002). Kou et al. (2003) developed a general approach to data classification by using multiple criteria linear programming (MCLP). The basic concept of the formulation can be shown by the following models. Given a set of k variables about the material-weakness or non-material-weakness sample firms in database a = (a1 , …, ak), let A i = (A i1 , …, A ik ) Rk be the sample observations of data for the variables, where i = 1, . . ., n and n is the sample size. We want to determine the coefficients of the variables, denoted by X = (x1, . . ., xk) T, and a boundary value of b to separate two classes: M(Material weakness) and N (Non-material weakness); that is, (a)
A i X b, A i M (Material weakness) and A i X > b, A i N (Non-material weakness).
Figure 1: A Two-class MCLP Model Ai X = b
i
i i
i
Non-material weakness
Material weakness
Ai X = b -
Ai X = b +
Consider now two kinds of measurements for better separation of material-weakness and non-material-weakness firms. Let i be the overlapping degree with respect to A i , and i be the distance from A i to its adjusted boundary. In addition, we define to be the maximum overlapping of two-class boundary for all cases Ai (i < ) and to be the minimum distance for all cases Ai from its adjusted boundary (i >). In Figure 1, we use (star) to represent Ai of non-material-weakness firms and (dot) to represent Ai of material-weakness firms. Figure 1 shows that our goal is to minimize the sum of i and maximize the sum of i simultaneously. By adding α i into (a), we have: (b)
A i X b + α i , A i M and A i X > b - α i , A i N.
However, by considering βi, we can rewrite (b) as: (c)
A i X = b + α i - βi , A i M and A i X = b - α i + βi , A i N. 109
The Journal of Applied Business Research – November/December 2009
Volume 25, Number 6
Our two-criterion linear programming model is stated as: (d)
Minimize i α i and Maximize i βi Subject to A i X = b + α i - βi , A i M, A i X = b - α i + βi , A i N, where A i are given, X and b are unrestricted, α i and βi 0 (Shi et al., 2001, p. 429).
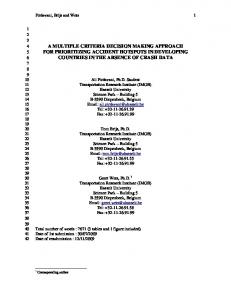
The above MCLP model can be solved in many different ways. One method is to use the compromise solution approach (Shi and Yu, 1989; Shi, 2001) to reform the model (d) by systematically identifying the best trade-offs between -i α i and i βi. To show this graphically, we assume the ideal value of -i α i is α* > 0 and the ideal value of i βi is β* > 0. Then, if -i α i > α*, we define the regret measure as -dα+ = i α i + α*; otherwise, it is 0. If -i α i < α*, the regret measure is defined as dα- = α* + i α i ; otherwise, it is 0. Thus, we have (i) α*+ i α i = dα-dα+, (ii) α*+ i α i = dα- -dα+, and (iii) dα- , -dα+ 0. Similarly, we derive β* - i βi = dβ- - dβ+, β* - i βi = dβ- + dβ+, and dβ- , dβ+ 0 (See Figure 2). An MCLP model has been gradually evolved as: (e)
Minimize dα + dα+ + dβ- + dβ+ Subject to α*+ i α i = dα- - dα+, β* - i βi = dβ- - dβ+, A i X = b + α i - βi , A i M, A i X = b - α i + βi , A i N, where A i , α*, and β* are given, X and b are unrestricted, α i , βi ,dα- ,dα+, dβ-, dβ+ 0.
Figure 2: Compromise formulation Min d- + d+ + d- + d+
i (*, *)
- i 110
The Journal of Applied Business Research – November/December 2009
Volume 25, Number 6
The data separation of the MCLP classification method is determined by solving the above problem. Two versions of actual software have been developed to implement the MCLP method on large-scale databases. The first version is based on the well-known commercial SAS platform (SAS/OR 1990). In this software, the SAS codes, including SAS linear programming procedure, are used to solve (e) and produce the data separation. The second version of the software uses C++ language running on Linux platform (Kou and Shi, 2002). The reason for developing the Linux version of the MCLP classification software is that the majority of database vendors, such as IBM, are aggressively moving to Linux-based system development. This Linux version goes along with the trend of information technology. Because many large companies currently use the SAS system for data analysis, the SAS version is also useful to conduct data mining analysis in a SAS environment. 4.
SAMPLE DATA, VARIABLES, AND EMPIRICAL RESULTS
In this paper, we used DirectEDGAR (2008) to identify 1,158 firms that reported material weaknesses in SOX Section 302 disclosures for the years 2003 and 2004 and to collect disclosure details (material weakness sample firms). DirectEDGAR is an efficient and effective research tool that is designed to facilitate searches of documents in the SEC’s EDGAR database. We then identified an equal number of control firms that had no material weakness disclosures (non-material-weakness matching firms). Our control firms were matched with our material-weakness firms using size and two-digit industry codes. Our final sample is composed of 2,316 firm-year observations that have available financial and other data in Form 10-K filings using DirectEDGAR and Compustat. In selecting variables that may help predict material weaknesses in internal control over financial reporting, we included Altman et al.’s (1977) variables and Ohlson’s (1980) variables because these variables are proven to be useful for bankruptcy prediction in previous studies, as discussed in section two of this paper. Altman’s five variables are Working Capital-to-Total Assets (WCA/TA), Retained Earnings-to-Total Assets (RE/TA), Earnings before Interest and Taxes-to-Total Assets (EBIT/TA), Market Value of equity-to-book value of Total Debt (MKV/TD) and Sales-to-Total Assets (SALE/TA). Ohlson (1980) describes his nine variables in two categories – financial state variables and performance variables. The financial state variables are Size (measured using the log of the ratio of total assets to gross domestic products), Total Liabilities-to-Total Assets (TL/TA), Working Capital-to-Total Assets (WCA/TA) and Current Liabilities-to-Current Assets (CL/CA). TL/TA measures financial structure or leverage, and WCA/TA and CL/CA are short-term liquidity measures. Ohlson’s (1980) performance variables are Net Income-to-Total Assets (NI/TA), Funds from Operations-to-Total Liabilities (FU/TL), a dummy variable equal to one if net income was negative for the last two years (INTWO)1, a dummy variable equal to one if TL/TA is greater than one (OENEG), and change in net income (CHIN) from year t – 1 to year t, where year t is the most recent year. The only variable common to both models is WCA/TA. In addition to the above bankruptcy prediction variables, we included other variables discussed in section two of this paper that have been found to be associated with material weaknesses, audit fees, auditor changes, or management fraud. As in Ge and McVay (2005), we include an indicator variable, Firm Age, to capture firm experience; Firm Age equals 1 for firms with more than 15 years in business and zero otherwise. 2 Older or more experienced firms may have better internal control systems. Because more complexity or complex transactions may offer opportunities for internal control weaknesses, we include two complexity variables, Segnm and Currency. Currency is an indicator variable equal to one for firms reporting non-zero foreign currency translation adjustments and zero otherwise as in Ge and McVay (2005), Hogan and Wilkins (2008), and Hoitash et al. (2008). We follow Ge and McVay (2005) to measure Segnm as the number of operating segments disclosed in the Form 10-K.3 In addition to Size, using Ohlson’s (1980) definition of the log of the ratio of total assets to gross domestic products, we use another variable used by Ge and McVay (2005) to proxy for size, BV (book value of assets from Form 10-K). We have two return-on-asset variables, NI/TA as in Ohlson (1980), Senteney et al. (2006), and Hogan and Wilkins (2008) and CRE/TA (earnings before extraordinary items divided by total assets) as in Ge and McVay (2005). We included 1
Both Hoitash et al. (2008) and Hogan and Wilkins (2008) include a similar loss variable in their internal control studies. Ge and McVay (2005) measure Firm Age as the estimated number of years a firm has been publicly traded, winsorized at 30 based on price data being available on Compustat. 3 Hoitash et al. (2008) use the square root of the number of segments, and Hogan and Wilkins (2008) use the natural log of the number of segments. 2
111
The Journal of Applied Business Research – November/December 2009
Volume 25, Number 6
CRE/TA in our study because many firms reported significant losses after the September 11, 2001 terrorist event. We also include two additional profitability measures, OpEgs (Operating EPS times Common Shares Outstanding) and CFO/TA (cash flow from operations divided by average total assets). Ge and McVay (2005) include CFO/TA, and this is similar to FU/TL (one of Ohlson’s (1980) variables previously mentioned). We include three auditor variables, BigAu (to indicate auditor quality as in Beneish et al. (2008)), Auditor Ch, and Auditor Ch5. BigAu is an indicator variable equal to one if the firm’s auditor is a Big 4 auditing firm and zero otherwise as in Hoitash et al. (2008) and Beneish et al. (2008).4 Auditor Ch is an indicator variable equal to one if the auditor changed for the year, and Auditor Ch5 is an indicator variable equals to one if a firm changed auditors within five years. Both auditor change variables are included because Ettredge et al. (2007) find an association between auditor dismissals and internal control problems and Senteney et al. (2006) document that auditor changes are associated with an increasing probability of bankruptcy. Table 1 shows the descriptive statistics for material weakness firms (Panel A) and non-material weakness firms (Panel B). The t-test statistics for tests of differences in means between the two groups included in Panel B indicate that about half of our firm characteristics variables are significantly different between material weakness and non-material weakness firms. Consistent with the findings in Ge and McVay (2005), our univariate tests indicate that material weakness firms are more complex (based on Currency but not Segnm) and more often use Big Four auditors (BigAU) than non-material weakness firms, and there is no difference in experience (Firm Age) between the two groups of firms. The relationship between profitability and material weakness disclosure is interesting. Our material weakness firms have significantly lower, but positive, mean Operating Earnings (OpEgs) than their non-material weakness counterparts, but mean NI/TA, CRE/TA, and EBIT/TA are all significantly less negative for material weakness firms than for non-material weakness firms. Mean CHIN (change in income) is positive and smaller for material weakness firms that for non-material weakness firms at a marginal level of significance. In contrast, Ge and McVay (2005) document mean CRE/TA that is more negative for material weakness firms than for their comparison group, and they do not evaluate change in income even though they state that this variable may be one to include in future research. It is important to note that our non-material weakness group consists of firms matched with our material weakness firms based on size and industry while Ge and McVay’s (2005) comparison group encompasses all 2003 CompuStat firms not included in their material weakness disclosure group of firms. 5 This highlights two important issues for decision-makers and researchers. First, profitability components such as operating earnings and other items that comprise net income may provide more insights than the summary measures of net income, earnings before extraordinary items, and earnings before interest and taxes. Second, the composition of comparison groups may result in different findings and conclusions. Significant differences also exist for three liquidity variables, CFO/TA, CL/CA, and WCA/TA. Material weakness firms have lower mean CFO/TA (consistent with Ge and McVay’s (2005) findings) and higher mean CL/CA and mean WCA/TA than non-material weakness firms. Although these results for CFO/TA and CL/CA reflect short-term liquidity constraints for material weakness firms relative to non-material weakness firms, there is no significant difference in leverage (TL/TA). Altman et al.’s (1977) cumulative profitability variable, RE/TA (retained earnings/total assets), actually has a negative mean for both groups in our study and is significantly less negative for the material weakness firms than for the non-material weakness firms. This negative mean value for RE/TA is difficult to interpret because one typically expects positive retained earnings. Mean MKV/TL (market value of equity/total liabilities) is smaller for the material weakness firms than for non-material weakness firms, and this may reflect investors’ perception of greater risk for firms that disclosed material weaknesses. Because we matched the control (non-material-weakness) firms with the material weakness firms using size and industry, we did not expect a difference in Size. In addition, mean BV (book value of total assets) is not significantly different between the material weakness and control firms. Missing values cause differences in the sample sizes (n) for certain variables.
4
Ge and McVay (2005) use 6 firms for their Big Auditor indicator variable, the Big 4 plus BDO Seidman and Grant Thornton. In their Table 4, Ge and McVay (2005) report using a maximum of 238 material weakness firms and a maximum of 5,995 comparison firms in their tests of differences. 5
112
The Journal of Applied Business Research – November/December 2009 Table 1: Descriptive statistics Panel A: Material weakness disclosure firms Mean Std. Deviation Minimum Firm Age 0.1125 0.3160 0.0000 Segnm 2.2283 1.5720 1.0000 Currency 0.9985 0.0254 0.0000 BV in Millions 656.1661 605.7703 0.0000 OpEgs in Millions 75.6577 723.0485 -1901.5200 CRE/TA -0.40748 6.4686 -17.1826 CFO/TA 0.1089 1.3303 -0.9227 BigAU 0.6730 0.2940 0.0000 Size 3.8170 4.7823 0.0000 TL/TA 0.2551 0.5388 0.0000 WCA/TA 0.1692 0.9074 -15.0911 CL/CA 6.5403 128.152 0.0123 NI/TA -0.1599 1.5676 -40.5508 FU/TL -0.0063 0.4748 -7.9301 INTWO 0.5026 0.5000 0.0000 OENEG 0.0216 0.1453 0.0000 CHIN 0.0955 0.5637 -1.0000 RE/TA -2.3218 21.7783 -665.9089 EBIT/TA -0.0452 0.5998 -11.1971 MKV/TL 182.2696 1208.203 0.04065 SALE/TA 0.9964 0.8706 0.0000 Auditor Ch 0.1039 0.3053 0.0000 Auditor Ch5 0.3447 0.4755 0.0000 Panel B: Non-material weakness disclosure firms Mean Std. Deviation Firm Age 0.0766 0.2659 Segnm 2.1921 1.5982 Currency 0.9462 0.2257 BV in Mil 642.1957 561.4744 OpEgs in Mil 91.1901 552.0946 CRE/TA -0.7385 2.4517 CFO/TA 0.6879 20.7081 BigAU 0.5572 0.4352 Size 3.8077 4.7493 TL/TA 0.2727 0.4219 WCA/TA -0.2242 12.4574 CL/CA 0.7913 1.3200 NI/TA -0.8257 24.5365 FU/TL -0.0530 2.1128 INTWO 0.4706 0.4991 OENEG 0.0268 0.1614 CHIN 0.1481 0.5258 RE/TA -18.2174 572.3597 EBIT/TA -0.7827 24.7171 MKV/TL 525.36 5264.23 SALE/TA 1.0109 0.9479 Auditor Ch 0.0792 0.2702 Auditor Ch5 0.3714 0.4834 * : p< 0.10 ** : p < 0.05 *** : p < 0.001
Minimum 0.000 1.000 0.0000 0.0010 -4136.67 -0.0001 -13.3653 0.0000 -3.0000 0.0000 -376.0000 0.0073 -815.0000 -65.0000 0.0000 0.0000 -1.0000 -1881.00 -821.00 0.0012 0.0000 0.0000 0.0000
113
Maximum 1.000 10.000 1.0000 10095.69 8972.5 5.1858 660.00 1.0000 6.0041 7.1134 0.9646 19.6337 1.6807 0.6070 1.0000 1.0000 1.0000 0.9895 0.5558 1289.54 10.2917 1.0000 1.0000
Volume 25, Number 6
Maximum 1.0000 10.0000 1.0000 11572.48 11913.2399 21.5250 39.1864 1.0000 6.0634 12.7978 0.9717 3136.00 0.7562 2.5020 1.0000 1.0000 1.0000 0.9946 0.4367 1933.273 7.2954 1.0000 1.0000
N 640 937 1003 1107 1034 1101 1016 1158 1107 1107 914 911 1104 1018 1158 1158 1074 1079 1104 799 1104 976 976
N 622 1003 1025 1127 1117 1125 1040 1158 1127 1124 960 958 1125 1041 1158 1158 1120 1116 1125 927 1125 986 986
t-test 1.18 0.63 ***3.31 0.40 ***-14.29 ***15.64 ***-3.93 ***4.63 0.10 -0.60 ***3.26 ***15.63 ***4.33 1.59 1.09 -0.32 *-1.67 ***21.43 ***4.87 ***-122.13 -0.36 1.02 -0.85
The Journal of Applied Business Research – November/December 2009
Volume 25, Number 6
Table 1 Variable Descriptions: Firm Age=1 for firms with more than 15 years in business; 0 otherwise; Segnm= Number of operating segments from 10-K; Currency=1 for firms with foreign currency translations; 0 otherwise; BV=Book value of assets from 10-K; OpEgs=Operating Earnings Per Share * Common Shares Outstanding; CRE/TA=Earnings before extraordinary items/Total Assets; CFO/TA=Cash flow from operation/Total assets; BigAu=1 for Big 4 auditors; 0 otherwise; Size =Log (Total Assets/Gross Domestic Products); TL/TA=Total Liabilities/Total Assets; WCA/TA=Working Capital Divided by Total Assets; CL/CA=Total Current Liabilities/Total Current Assets; NI/TA=Net Income/Total Assets; FU/TL=Funds from Operations/Total Liabilities; INTWO= if Net Income