County-level vehicle crash records and roadway data from Texas are used to ... These models are illustrated and compared again with the Texas crash data.
BAYESIAN MULTIVARIATE SPATIAL MODELS AND THEIR APPLICATIONS
A Dissertation by JOON JIN SONG
Submitted to the Office of Graduate Studies of Texas A&M University in partial fulfillment of the requirements for the degree of DOCTOR OF PHILOSOPHY
August 2004
Major Subject: Statistics
BAYESIAN MULTIVARIATE SPATIAL MODELS AND THEIR APPLICATIONS
A Dissertation by JOON JIN SONG Submitted to Texas A&M University in partial fulfillment of the requirements for the degree of DOCTOR OF PHILOSOPHY
Approved as to style and content by:
Bani K. Mallick (Chair of Committee)
Jeffrey D. Hart (Member)
Marina Vannucci (Member)
Yalchin Efendiev (Member)
Shaw-Pin Miaou (Member)
Michael T. Longnecker (Head of Department) August 2004 Major Subject: Statistics
iii
ABSTRACT
Bayesian Multivariate Spatial Models and Their Applications. (August 2004) Joon Jin Song, B.S., Yeungnam University M.S., Kyungpook National University Chair of Advisory Committee: Dr. Bani K. Mallick
Univariate hierarchical Bayes models are being vigorously researched for use in disease mapping, engineering, geology, and ecology. This dissertation shows how the models can also be used to build model-based risk maps for area-based roadway traffic crashes. County-level vehicle crash records and roadway data from Texas are used to illustrate the method. A potential extension that uses univariate hierarchical models to develop network-based risk maps is also discussed. Several Bayesian multivariate spatial models for estimating the traffic crash rates from different types of crashes simultaneously are then developed. The specific class of spatial models considered is conditional autoregressive (CAR) model. The univariate CAR model is generalized for several multivariate cases. A general theorem for each case is provided to ensure that the posterior distribution is proper under improper and flat prior. The performance of various multivariate spatial models is compared using a Bayesian information criterion. The Markov chain Monte Carlo (MCMC) computational techniques are used for the model parameter estimation and statistical inference. These models are illustrated and compared again with the Texas crash data. There are many directions in which this study can be extended. This dissertation concludes with a short summary of this research and recommends several promising extensions.
iv
To My Parents, Parents-in-Law, and My Lovely Wife, Wonjeong
v
ACKNOWLEDGEMENTS There are many people who through their generosity and knowledge have made important contributions to this dissertation. It would be impossible to list everyone who contributed or to adequately list the extent of the contributions for those who are mentioned. First and foremost, I am extremely grateful to my advisor, Dr. Bani K. Mallick, for his guidance and support throughout my graduate study. I especially thank him for giving me the opportunity to participate in several of his research projects which deal with many challenging statistical issues. I wish to thank my committee members, Dr. Jeffrey D. Hart, Dr. Marina Vannucci, and Dr. Yalchin Efendiev for their insightful suggestions and help. I would like to extend a special thank you to Dr. Shaw-Pin Miaou, who has been a committee member and a great mentor and friend to me. I cannot express my thanks in writing for his endless encouragement, concern, and support in my study and life. I also wish to acknowledge my friends, Ho-Jin Lee, Jeesun Jung, and Deukwoo Kwon, with whom I shared my joy, complaints, and laughter through these past years. Finally, I would like to thank my parents, Jong-Chool Song and Nam-Soon Lee, and my parents-in-law, Soo-Hwan Kim and Gyo-Sook Jeong, for their constant encouragement and support. I also thank my sister, Won-Suk Song, and brother-in-law, Wonjo Kim, for their emotional support during the difficult time of this long journey. To all people, I am most thankful to my wife, Wonjeong, who is definitely the main contributor to all my significant accomplishments, including this dissertation. I thank God for having her as my wife, best friend, and soul companion.
vi
TABLE OF CONTENTS
Page ABSTRACT . . . . . . . . . . . . . . . . . . . . . . . . . . . . . . . . . . . .
iii
DEDICATION . . . . . . . . . . . . . . . . . . . . . . . . . . . . . . . . . . .
iv
ACKNOWLEDGEMENTS . . . . . . . . . . . . . . . . . . . . . . . . . . . .
v
TABLE OF CONTENTS . . . . . . . . . . . . . . . . . . . . . . . . . . . . .
vi
LIST OF FIGURES . . . . . . . . . . . . . . . . . . . . . . . . . . . . . . . .
viii
LIST OF TABLES . . . . . . . . . . . . . . . . . . . . . . . . . . . . . . . . .
x
CHAPTER I
II
INTRODUCTION . . . . . . . . . . . . . . . . . . . . . . . . . .
1
1.1 1.2 1.3 1.4
. . . .
1 4 4 5
LITERATURE REVIEW . . . . . . . . . . . . . . . . . . . . . .
7
2.1 2.2 2.3 III
IV
Spatial Data . . . . . . . . . . . . . . . . . Research Problems, Objectives and Scope Research Contributions . . . . . . . . . . . Organization of Dissertation . . . . . . . .
. . . .
. . . .
. . . .
. . . .
. . . .
. . . .
. . . .
. . . .
Conditional Autoregressive (CAR) Models . . . . . . . . . Multivariate Conditional Autoregressive (MCAR) Models . Posterior Propriety . . . . . . . . . . . . . . . . . . . . . .
7 9 11
UNIVARIATE HIERARCHICAL SPATIAL MODELS . . . . . .
14
3.1 3.2 3.3 3.4 3.5 3.6
. . . . . .
14 20 24 37 40 47
MULTIVARIATE HIERARCHICAL SPATIAL MODELS . . . .
51
4.1 4.2 4.3
51 53 54
Introduction . . . . . . . . . . . . . Description of Data . . . . . . . . . Bayesian Hierarchical Models . . . Deviance Information Criterion and Results . . . . . . . . . . . . . . . . Discussion . . . . . . . . . . . . . .
. . . . . . . . . . . . . . . Variants . . . . . . . . . .
. . . . . .
. . . . . .
. . . . . .
. . . . . .
. . . . . .
. . . . . .
. . . . . .
Introduction . . . . . . . . . . . . . . . . . . . . . . . . . . Univariate Hierarchical Model . . . . . . . . . . . . . . . . Multivariate Hierarchical Model . . . . . . . . . . . . . . .
vii CHAPTER
Page 4.4
Data Analysis . . . . . . . . . . . . . . . . . . . . . . . . .
62
CONCLUSIONS . . . . . . . . . . . . . . . . . . . . . . . . . . .
73
REFERENCES . . . . . . . . . . . . . . . . . . . . . . . . . . . . . . . . . . .
75
APPENDIX A . . . . . . . . . . . . . . . . . . . . . . . . . . . . . . . . . . .
84
APPENDIX B . . . . . . . . . . . . . . . . . . . . . . . . . . . . . . . . . . .
88
APPENDIX C . . . . . . . . . . . . . . . . . . . . . . . . . . . . . . . . . . .
90
APPENDIX D . . . . . . . . . . . . . . . . . . . . . . . . . . . . . . . . . . .
92
VITA . . . . . . . . . . . . . . . . . . . . . . . . . . . . . . . . . . . . . . . .
95
V
viii
LIST OF FIGURES
FIGURE
Page
1
Geographic Districts, Counties, and Urbanized Areas in Texas. . . . .
21
2
The Number of KAB Crashes on Rural, 2-Lane, Low-Volume, OnSystem Roads in Each Texas County: 1999. . . . . . . . . . . . . . .
22
Vehicle-Miles Traveled on Rural, 2-Lane, Low-Volume, On-System Roads in Each Texas County: 1999. . . . . . . . . . . . . . . . . . . .
24
”Raw” Annual KAB Crash Rates in Crashes per MVMT by County: 1992-1999. . . . . . . . . . . . . . . . . . . . . . . . . . . . . . . . . .
25
Proportion of KAB Crashes That Occurred on Sharp Horizontal Curves in Each County: 1992-1999. . . . . . . . . . . . . . . . . . . .
26
Proportion of KAB Crashes That Occurred under Wet Pavement Conditions for Each County: 1999. . . . . . . . . . . . . . . . . . . .
27
Proportion of KAB Crashes That Were Intersection, Intersection Related, or Driveway Access Related for Each County: 1999. . . . . .
28
Proportion of KAB Crashes Involving Vehicles That Ran Off Roads and Hit Fixed Objects on the Roadside for Each County: 1999. . . .
29
Estimated KAB Crash Rates in Crashes per MVMT by County from Model 27: 1999. . . . . . . . . . . . . . . . . . . . . . . . . . . .
48
Locations of KAB Crashes on the State-Maintained Highway Network of a Texas County in 1999. . . . . . . . . . . . . . . . . . . . . .
49
Plot of the Posterior Distributions of the Covariates for Interaction Crash. . . . . . . . . . . . . . . . . . . . . . . . . . . . . . . . . . . .
67
Plot of the Posterior Distributions of the Covariates for InteractionRelated Crash. . . . . . . . . . . . . . . . . . . . . . . . . . . . . . .
68
3
4
5
6
7
8
9
10
11
12
13
Plot of the Posterior Distributions of the Covariates for Driveway Crash. 69
ix FIGURE 14
15
16
Page
Plot of the Posterior Distributions of the Covariates for NonInteraction Crash. . . . . . . . . . . . . . . . . . . . . . . . . . . . . .
70
Plot of the Posterior Distributions of the Correlation Coefficients between the Responses. . . . . . . . . . . . . . . . . . . . . . . . . . .
71
Predicted Map for Different Types of Crash. . . . . . . . . . . . . . .
72
x
LIST OF TABLES
TABLE 1
Page Deviance Information Criterion and Related Performance Measures for Models of Various Complexities. . . . . . . . . . . . . . . . .
43
2
Example MCMC Simulation Output for Model 27. . . . . . . . . . . .
46
3
DIC and pD Values for Various Multivariate Spatial Models. . . . . .
65
1
CHAPTER I
INTRODUCTION
Statistical spatial models have been used in diverse applications, such as engineering, geology, ecology, and public health, for analyzing geographically referenced data. Advances in computing power, Geographic information system (GIS), and computational techniques, such as the Markov Chain Monte Carlo (MCMC), allow sophisticated spatial models to be developed. In biostatistical field, spatial models have particularly been increasingly employed to analyze disease rates and develop disease maps. This chapter is organized as follows. First, a brief review of spatial data is given. The research objectives and contributions are then presented. Finally, the organization of this dissertation is outlined. 1.1
Spatial Data Spatial data can be viewed as realizations as a spatial stochastic process {Y (s) : s ∈ D},
where s is the location from which the data is observed and D is a random set in ddimensional Euclidean space. A realization of an underlying spatial stochastic process is denoted by {y(s) : s ∈ D}. Spatial data are generally categorized into three types; (1) geostatistical or pointreferenced data, (2) lattice or areal data, and (3) point pattern data. A brief review The format and style follow that of Journal of the American Statistical Association.
2
for these types of data and the associated spatial models is provided in following subsections. 1.1.1
Geostatistical Data
The basic principle for geostatistical data analysis is based on a stochastic process {Y (s) : s ∈ D}, where D is assumed to be a fixed subset of Rd . Let Y (s) = (Y (s1 ), · · · , Y (sn ))T denote n observations at sites s1 , · · · , sn in a region of interest D ∈ Rd . The observed data are used to predict some unknown observations at unobserved sites. Kriging is the most popular method for spatial prediction which is a optimal least squares interpolation. This prediction method depends on the secondorder properties of the spatial process Y (s). The spatial process Y (s) is often assumed to follow Gaussian process. The basic model is developed by means of the following model Y (s) = m(s) + ²(s)
(1.1)
where m(s) is the mean function of the process and ²(s) is a random process. The total variation in (1.1) is divided into large-scale variation (the mean function m(s)) and small-scale variation (the residual random process ²(s)). Residual process is associated with a covariance function, which expresses covariance of two values of ²(si ) and ²(sj ). The several approaches for the analysis have been developed, such as plug-in approach under a Gaussian process (Kitanidis 1983; Mardia and Marshall 1984; Kitanidis and Lane 1985), nonparametric regression methods for spatial prediction (Laslett 1994; Journel 1983), median polishing kriging for nonstationary mean (Cressie 1986, 1993), and nonparametric estimation of nonstationary spatial covariance (Sampson and Guttorp 1992). For further methods in detail, see Cressie (1993).
3
1.1.2
Lattice Data
Analogous to geostatistical data, denote that Ys1 , · · · , Ysn are lattice data observed at n sites. The apparent difference between geostatistical data and lattice data is that the latter are observed at every site. In addition, D is a fixed subset of Rd and it is partitioned into a finite number of lattices (or areal units), while site index s in geostatistical data varies continuously over D. In practice, the lattices (or areal units) are irregular such as zip codes or counties and the data are regularly sums or average of quantities of interest over these lattices. Spatial association over the lattices are introduced by a neighborhood structure and there are two popular models, the simultaneously autoregressive (SAR) and the conditional autoregressive (CAR) models, that incorporate such neighborhood structure. Whittle (1954) proposed the SAR model which has the advantage in computation when likelihood methods are used, while the CAR model is developed by Besag (1974) and this model is computationally convenient for Gibbs sampling in Bayesian framework. The general approach in Bayesian hierarchical spatio-temporal models is to embed spatial random effect with the CAR prior and time effect in generalized linear model. This approach is commonly used in disease mapping studies and is also utilized in Chapter III and IV. 1.1.3
Point Pattern Data
Recall that {s1 , · · · , sn } is a set of the locations in a region of interest. A quantity of interest to be analyzed in point pattern data is the locations of n events in a region D. The objective of the analysis is to investigate whether the pattern of data shows complete spatial randomness, clustering, or regularity. For example, consider residences of persons with a particular disease or locations of a certain species
4
of tree in a forest. In contrast to previous two types of data, a quantity of interest, occurrence of events, is usually fixed and the locations si are random. The studies on spatial point pattern can be found in Pielou (1959, 1977), Getis and Boots (1978), Marquiss et al. (1978), Ripley (1981), Diggle (1983), and Upton and Fingleton (1985). 1.2
Research Problems, Objectives and Scope Spatial data is frequently multivariate. For example, incidences of several dis-
eases, such as leukemia, pediatric asthma, and lung cancer, would be generally collected at county or census tract level in public health. In such case, we expect not only the dependence between incidences of different diseases at a given areal unit, but also spatial association between the incidences across areal units. The main objective of this dissertation is to explore multivariate spatial modeling for multivariate measurements over areal units. For areal-based data, we propose several types of multivariate extension based on general univariate conditional autoregressive (CAR) model. The second goal is to ensure posterior propriety for proposed models with improper prior, vague flat prior. Finally, the multivariate spatial models are applied to real data, Texas crash data and risk maps are generated based on estimated crash risk rate. 1.3
Research Contributions Statistical methodologies in transportation safety community play an important
role to investigate traffic crash rate and to improve roadway safety. However, research on spatial models for roadway traffic crashes has not conducted much. One of contribution of this research is to introduce model-based statistical approach to the community and to illustrate this by vehicle crash records and roadway inventory data
5
at county level in Texas. A variety of spatial models for univariate data have been developed in the past decade. As indicated earlier, it is often necessary to have spatial models to analyze multivariate data. Recently, Carlin and Banerjee (2003) proposed multivariate conditional autoregressive (MCAR) model for spatially and temporally correlated survival data. We also propose several spatial models for multivariate data based on general univariate conditional autoregressive (CAR) model. Vague flat prior is usually adopted for fixed effect, such as regression parameters. Though this prior is a simple and convenient choice, it can lead a improper joint posterior distribution, so that the resulting posterior distribution make Bayesian inference impossible. Therefore, it is imperative to ensure that the joint posterior is proper under vague flat prior. The studies to obtain sufficient condition on posterior propriety were found in Chen et al. (2002), Hobert and Casella (1996), and Chen et al. (2003). Ghosh et al. (1998) provided sufficient conditions to gain a proper joint posterior with a univariate CAR prior for spatial random effect. Since vague flat prior is assigned to regression parameters in multivariate model setup proposed here, theorems to obtain proper posteriors corresponding to each spatial prior are provided. These multivariate models are applied to Texas crash data and inferential results and crash risk map are shown. 1.4
Organization of Dissertation This dissertation is composed of five chapters. In Bayesian framework, all mod-
els and methodologies proposed in this dissertation are developed and the analyses of real data are carried out. In Chapter II, we briefly review selective literature and topics concerning about univariate CAR model, multivariate CAR model, and posterior propriety.
6
Chapter III shows how hierarchical Bayes models, which are being vigorously researched for use in disease mapping, can also be used to build model-based risk maps for area-based traffic crashes. Country-level vehicle crash records and roadway data from Texas are used to illustrate the method. A potential extension that uses hierarchical models to develop network-based risk maps is also discussed. We consider several Bayesian multivariate spatial models for estimating the crash rates from different types of crashes in Chapter IV. Conditional autoregressive (CAR) model is considered for the spatial effect model and is generalized for the multivariate case. A general theorem for each case is provided to ensure that posterior is proper under vague flat prior. The different models are compared according to some Bayesian criterion. Markov chain Monte Carlo (MCMC) is used for computation. We illustrate these methods with Texas crash data. Finally, Chapter V concludes this dissertation with a short summary and some suggestions for future study. The Appendices include proofs for the theorems proposed in Chapter IV.
7
CHAPTER II
LITERATURE REVIEW 2.1
Conditional Autoregressive (CAR) Models Conditional autoregressive (CAR) models are introduced by Besag (1974). In
recent, the models have been increasingly used in broad application for spatial data analysis because these models allow to model fitting using a Gibbs sampler. CAR models have been implemented by two ways to model spatial association with areal data. Firstly, Geman and Geman (1984) showed direct spatial modeling of observations and the second approach is hierarchical modeling. Spatial association in areal data is commonly described by spatial random effect in hierarchical model and CAR models are employed as the priors of the random effect in Bayesian framework. The full conditional distributions of CAR models are defined as à ! X p(ηi |ηj6=i ) ∼ N cij ηj , τi2 , i = 1, · · · , n.
(2.1)
j
From Brook’s Lemma, the joint distribution is uniquely determined by f (η) ∼ N(0, (I − C)−1 D),
(2.2)
where I is identity matrix, C = {cij }, and D = Diag(τ12 , · · · , τn2 ). The covariance matrix in (2.2) must be symmetric, and the conditions are obtained, cji cij = 2, 2 τi τj
(2.3)
for all i and j. In practice, a proximity matrix W is usually constructed to describe neighborhood relationship between areal unit. Suppose we set cij = wij /wi+ and τi2 = ση2 /wi+ ,
8
where W = {wij } and wi+ =
P j
wij . Then the full conditionals (2.1) and the joint
distribution (2.2) are rewritten by à p(ηi |ηj6=i ) ∼ N
X
! wij ηj /wi+ , ση2 /wi+
(2.4)
j
and ( f (η) ∝ exp
) 1 T − 2 η (D W − W )η , 2ση
(2.5)
where D W is a diagonal matrix with entries wi+ . Note that the distribution in (2.5) is improper because of (D W − W )1 = 0. To remedy this problem, Sun et al. (2000) introduced a propriety parameter ρ into mean specification in (2.3). The parameter ρ −1 can be interpreted as a measure spatial association over areal unit. If λ−1 1 < ρ < λk , −1/2
−1/2
where λ1 < · · · < λn are the eigenvalues of D W W D W , D W − ρW becomes nonsingular. Let W ∗ = Diag(1/wi+ )W denote the scaled adjacency matrix. This matrix allows the propriety parameter to be |α| < 1 . In Chapter IV, the propriety parameter is denoted by α to distinguish from ρ. Carlin and Banerjee (2003) proved that the precision matrix with the propriety parameter α corresponding to the scaled adjacency matrix is symmetric and diagonally dominant. It indicates that the precision matrix is nonsingular because a symmetric and diagonally dominant matrix is positive definite. Although the introduction of the propriety parameter obviously overcomes impropriety of CAR specification, improper CAR model is still often implemented in spatial modeling. Banerjee at el. (2004) discussed a few reasons why improper CAR models are often used instead of proper CAR models. Firstly, the mean of ηi is intended to be an average of its neighbors in original concept of CAR models, but the mean becomes some proportion of the average of its neighbors by adding the
9
propriety parameter. They also conducted some simulations in order to examine the performance of calibration of ρ. It is found that a descriptive spatial association measure is not enough to indicate strong spatial correlation even though the propriety parameter ρ is almost equal to 1. This suggests that the parameter which is usually interpreted as ”strength of spatial association” can misinform about the strength of association. Finally, proper CAR models can make the range of spatial pattern restricted. Therefore, the choice between two types of CAR models is ambiguous and can be determined by data or researchers. Besag et al. (1991) proposed the pairwise difference specification which is the most popular formulation in CAR models, ) ( 1 X wij (ηi − ηj )2 . f (η) ∝ exp − 2 2ση i6=j
(2.6)
This specification is referred to the intrinsic autoregressive (IAR) model. The general approach in Bayesian hierarchical spatio-temporal models is to embed spatial random effect and time effect in generalized linear model. At the first level of hierarchy, conditional mean of observations, measurement of interest are assumed to be mutually independent and the spatial modeling is accomplished in the second level of hierarchy. 2.2
Multivariate Conditional Autoregressive (MCAR) Models Mardia (1988) developed the fundamental theory for multivariate Gaussian Markov
random field (GMRF). Based on his work, Carlin and Banerjee (2003) formulated multivariate conditional autoregressive (MCAR) models. Consider η T = (η T1 , · · · , η Tp ), where η i is a n × 1 vector, and a multivariate normal distribution, η ∼ N(0, B −1 ),
(2.7)
10
where B is a precision matrix with blocks Bij . Similar to univariate CAR models, the full conditionals of η i given η j , j 6= i are obtained by à ! X p(η i |η j6=i ) ∼ N Cij η j , Σi ,
(2.8)
j
where Cij = −Bii−1 Bij and Σi = Bii−1 are n × n matrices. The joint distribution is also uniquely determine by Brook’s Lemma, f (η) ∼ N(0, (I − C)−1 Σ),
(2.9)
where C and Σ are block diagonal matrices with entities Cij and Σi , respectively. The propriety parameter could be included in (2.9) to avoid the impropriety problem. Kim et al. (2001) proposed twofold conditional autoregressive model for bivariate data analysis. The model allows different diseases to share information each other. But, the model is limited to bivariate data and it is infeasible to generalize the model for a number of diseases. Gelfand and Vounatsou (2003) provided a class of multivariate proper conditional autoregressive models. A new parametric linear transformation is also proposed for an extension which gives fascinating interpretation. In recent, Jin, et al. (2004) point out the difficulty to specify covariance matrix in multivariate spatial models in areal data. The above studies (Carlin and Banerjee 2003; Gelfand and Vounatsou 2003) are concerned about the precision matrix , instead of the covariance matrix. The key drawback of precision matrix specification approach in multivariate areal models results in obscure interpretation. To overcome this difficulty, they proposed a new class of generalized multivariate conditional autoregressive (GMCAR) models for areal data. The joint distribution for the multivariate spatial process is defined through simple conditional and marginal forms.
11
These multivariate conditional autoregressive models are also often used as spatial prior of spatial random effect in the generalized linear mixed model framework. Although several approaches have been proposed, there is no attempt to check posterior propriety with improper prior. As indicated earlier, impropriety of CAR prior could be resolved by plugging in the propriety parameter, but it is still necessary to check posterior propriety unless proper priors for all parameter in the models are specified. 2.3
Posterior Propriety Once there is no faithful information about parameter θ or an inference only
based on data is desired, a noninformative prior which has no information about parameter θ is an appropriate choice. For example, if a parameter space is a bounded continuous, Θ = [a, b], the uniform distribution is often selected as noninformative prior for θ, p(θ) =
1 , (b − a)
a < θ < b.
Suppose that a parameter space is unbounded, Θ = (−∞, ∞). Then a suitable prior could be p(θ) = c, where c > 0 is any constant. However, this prior is improper,
R
p(θ)dθ = ∞, so that
it seems that the prior is not acceptable in Bayesian inference. Nevertheless, the prior make Bayesian inference possible if the integration of the likelihood function f (x|θ) with respect to θ results in a finite value K. It indicates that there exists some finite normalizing constant and Bayesian inference could be carried out, p(θ|x) = R
f (x|θ) f (x|θ) · c = . K f (x|θ) · cdθ
12
However, we need to pay attention to ensure whether the resulting posterior is proper under improper prior because the prior does not always lead proper posterior. For example, in high-dimensional models, the data do not contain sufficient information in order to identify all parameters in models, so that it is required that some priors for parameters should be informative. Hobert and Casella (1996) warned the users of hierarchical linear mixed models with improper priors not to implement MCMC without ensuring that the resulting posterior is proper. Generally, improper priors are elicited for variance components in hierarchical linear mixed models because of the reasons for the choice in the beginning of this chapter. By dealing with conjugate priors in the prior specification, the full conditionals required for the Gibbs sampling are easily derived and it seems that there is no problem in general Bayesian inference. However, the Gibbs sampler itself could not point out whether the posterior is proper or not. Although the resulting posterior is improper, the output from a Gibbs sampler can behave perfectly. But, the posterior inference based on the output is worthless because it is from a nonexistent posterior distribution. They showed this situation with real data analysis and provided the theorems to give sufficient conditions for posterior propriety under improper priors. Ibrahim and Laud (1991) provide two theorems that allow Jeffrey’s priors to be used in generalized linear models with fixed scale parameters. The theorems also give sufficient and necessary conditions for the propriety of the posterior and prior. Ghosh et al. (1998) present the theorem to ensure posterior propriety in hierarchical Bayes generalized linear mixed models with spatial random effect. Sun et al. (2001) examined necessary and sufficient conditions for posterior propriety in hierarchical linear mixed models with the improper priors for the fixed effects and variance components.
13
Chen et al. (2002) investigated the posterior propriety for generalized linear mixed model when an improper prior is placed on the regression parameters. The propriety is considered under a general link function and a general covariance structure for random effects.
14
CHAPTER III
UNIVARIATE HIERARCHICAL SPATIAL MODELS 3.1
Introduction Transportation-related deaths and injuries constitute a major public health prob-
lem in the United States. Injuries and fatalities occur in all transportation modes, but crashes involving motor vehicles account for almost 95% of all transportation fatalities and most injuries. Despite the progress made in roadway safety in the past several decades, tens of thousands of people are still killed and millions of people are injured in motor vehicle crashes each year. For example, in 1999 nearly 42,000 people were killed in traffic crashes and over 3.2 million more were injured. Motor vehicle fatalities are the leading cause of unintentional injury deaths, followed by falls, poisonings, and drownings (about 16,000, 10,000, and 4,400 deaths per year, respectively) (NSC 2002). They are also responsible for as many pre-retirement years of life lost as cancer and heart disease, about 1.2 million years annually. In fact, motor vehicle crashes are the leading cause of death for people aged 1 to 33. Societal economic losses from these crashes are huge, estimated by the National Highway Traffic Safety Administration to exceed $230 billion in 2000. Thus, much work remains to be done to develop a better understanding of the causes of vehicle crashes-their chains of events and operating environments-and to develop countermeasures to reduce the frequency and severity of these crashes (USDOT 1996-1999). Safety is one of the U.S. Department of Transportation’s (USDOT’s) five current strategic goals, and Rodney Slater, a former Transportation Secretary stated: ”Safety is a promise we keep together.” Indeed, roadway safety intersects with all five core functional areas within conventional highway engineering (planning, design, construc-
15
tion, operation, and maintenance) and crosscuts the boundaries of other engineering (vehicle and material) and nonengineering areas (human factors, public health, law enforcement, education, and other social sciences). Thus, research in roadway safety requires interdisciplinary skills and essential cooperation from various engineering and social science fields. In 2002, a series of conferences was hosted by the Bureau of Transportation Statistics under the general title of ”Safety in Numbers: Using Statistics to Make the Transportation System Safer.” These conferences supported the top strategic safety goal of promoting public health and safety ”by working toward the elimination of transportation-related deaths, injuries, and property damage” (USDOT 2002). 3.1.1
Contributing Factors, Countermeasures, and Resources
Motor vehicle crashes are complex events involving the interactions of five major factors: drivers, traffic, roads, vehicles, and the environment (e.g., weather and lighting conditions) (e.g., Miaou 1996). Among these factors, driver error has been identified as the main contributing factor to a great percentage of vehicle crashes, and many research efforts are being undertaken to better understand human and other synergistic factors that cause or facilitate crashes. These factors include operator impairment due to the use of alcohol and drugs, medical conditions, or human fatigue and the operator’s interaction with new technologies used on the vehicle. Countermeasures to reduce the number and severity of vehicle crashes are being sought vigorously through various types of community, education, and law enforcement programs and improved roadway design and vehicle safety technology. However, many of these programs have limited resources and need better tools for risk assessment, prioritization, and resource scheduling and allocation. Recognizing that ”to err is human” and that driver behavior is affected by vir-
16
tually all elements of the roadway environment, highway engineers are constantly redesigning and rebuilding roadways to meet higher safety standards. This includes designing and building roadways and roadsides that are more ”forgiving” when an error is made, more conforming to the physical and operational demands of the vehicle, and that better meet drivers’ perceptions and expectations in order to reduce the frequency of human errors (TRB 1987). The relatively low fatality rate on the Interstate Highway System (about half the fatality rate of the remainder of the nation’s highways) is evidence of the impact of good design on highway safety (Evans 1991). Many impediments keep highway engineers from achieving their design and operational goals, including a lack of resources and a vast highway system that needs to be built, operated, maintained, audited, and improved. They must make incremental improvements over time and make difficult decisions on the tradeoffs among cost, safety, and other operational objectives. Consequently, knowing where to improve and how to prioritize and schedule improvements is as important as knowing which roadway and roadside features and elements to add or improve. Tools for identifying, auditing, ranking, and clinically evaluating problem sites; developing countermeasures; and allocating resources are essential for highway engineers who make these decisions. 3.1.2
Disease Mapping and Methods Using Spatial Models
In recent years, a multiplicity of the studies for disease mapping and ecological analysis has been conducted using spatial(-temporal) models in Bayesian framework. This model-based approach has yielded a dramatic gain in the number and scope of applications in public health studies of risks from disease such as leukemia, pediatric, asthma, and lung cancer (Carlin and Louis 1996; Knorr-Held and Besag 1998; Xia et al. 1997; Ghosh et al. 1999; Lawson et al. 1999; Zhu and Carlin 1999; Dey et al.
17
2000; Sun et al. 2000; Lawson 2001; Green and Richardson 2001). A special issue of ”Statistics in Medicine” entitled ”Disease Mapping with a Focus on Evaluation” was also published to report the development of this approach (vol. 19, Issues 17-18, 2000). Among other applications, disease mapping have been used to: • describe the spatial variation in disease incidence for the formulation and validation of etiological hypotheses; • identify and rank ares with potentially elevated risk and time trends so that action may be taken; • provide a quantitatively informative map of disease risk in a region to allow better risk assessment, prioritization, and resource allocation in public health. Clearly, roadway traffic safety planning has similar requirements and can potentially benefit from these kinds of maps. Studies have shown that risk estimation using hierarchical Bayes models has several advantages over estimation using classical methods. One important point that has been stressed by almost all of these studies is that individual incidences of diseases of concern are relatively rare for a typical analysis unit such as census tract or county. As a result, estimates based on simple aggregation techniques may be unreliable because of large variability from one analysis unit to another. This variability makes it difficult to distinguish chance variability from genuine differences in the estimates and is sometimes misleading for analysis units with a small population size. Hierarchical Bayes models, however, especially those Poisson-based generalized linear models with spatial random effects, have been shown to have the ability to account for the high variance of estimates in low population areas and at the same time clarify overall geographic trends and patterns (Ghosh et al. 1999; Sun et al. 2000).
18
Note that in the context of sample surveys the type of problem described above is commonly referred to as a small area, local area, or small domain estimation problem. Ghosh and Rao (1994) conducted a comprehensive review of hierarchical Bayes estimations and found them favorable for dealing with small area estimation problems when compared with other statistical methods. Hierarchical models are also gaining enormous popularity in fields such as education and sociology, in which data are often gathered in a nested or hierarchical fashion: for example, as students within classrooms within schools (Goldstein 1999). In these fields, hierarchical models are often called multilevel models, variance component models, or random coefficients models. The overall strength of the Bayesian approach is its ability to structure complicated models, inferential goals, and analyses. Among the hierarchical Bayes methods, three are most popular in disease mapping studies: empirical Bayes (EB), linear Bayes (LB), and full Bayes methods. These methods offer different levels of flexibility in specifying model structures and complexity in computations. As suggested by Lawson (2001): ”While EB and LB methods can be implemented more easily, the use of full Bayesian methods has many advantages, not least of which is the ability to specify a variety of components and prior distributions in the model set-up.” To many statistical practitioners, it is fair to say that the challenges they face dealing with real-world problems come more often from the difficulties of handling nonsampling errors and unobserved heterogeneity (because of the multitude of factors that can produce them) than from handling sampling errors and heterogeneity due to observed covariates. One potential advantage of using the full Bayes model is the flexibility that it can provide in dealing with and adjusting for the unobserved heterogeneity in space and time, whether it is structured or unstructured.
19
3.1.3
Objectives and Significance of Work
Mapping transforms spatial data into a visual form, enhancing the ability of users to observe, conceptualize, validate, and communicate information. Research efforts in the visualization of traffic safety data, which are usually stored in large and complex databases, are quite limited at this time because of data and methodological constraints (Smith et al. 2001). As a result, it is common for engineers and other traffic safety officials to analyze roadway safety data and make recommendations without actually ”seeing” the spatial distribution of the data. This is not an optimal situation. To the best of our knowledge, unlike the public health community, which has developed models for disease mapping, the roadway safety research community has not done much to develop model-based maps for traffic crash data. One of the objectives of the study presented here was to initiate development of model-based mapping for roadway traffic crashes. Vehicle crash records and roadway inventory data from Texas were used to illustrate the nature of the data, the structure of models, and results from the modeling. Overall, TxDOT maintains nearly 80,000 centerline-miles of paved roadways, serving about 400 million vehicle-miles per day. Over 63% of the centerline-miles are rural two-lane roads that, on average, carry fewer than 2,000 vehicles per day. These low volume rural roadways carry only about 8% of the total vehicle-miles on state-maintained (or on-system) highways and have less than 7% of the total reported on-system vehicle crashes. Due to the low volume and relatively low crash frequency on these roads, it is often not deemed cost-effective to upgrade these roads to the preferred design standards. However, vehicles on these roadways generally travel at high speeds and thus tend to have relatively more severe injuries when vehicle crashes
20
occur. For example, in 1999, about 26% of the Texas on-system crashes were fatal (K), incapacitating injury (A), and nonincapacitating injury (B) (or KAB) crashes, compared with over 40% of the crashes on rural, two-lane, low volume on-system roads (Fitzpatrick et al. 2001). As a result, we have chosen to focus this study on crashes occurring on rural, two-lane, low-volume, on-system roads. This paper is organized as follows: the next section briefly describes the sources and nature of the data analyzed in this study, followed by a quick review of modeling and computational techniques and a discussion of Poisson-based hierarchical Bayes model with space-time effects and possible variants. Results from models of various levels of complexities are then presented and compared, and we conclude with a discussion of future work. 3.2
Description of Data The Texas Department of Transportation (TxDOT) maintains highway develop-
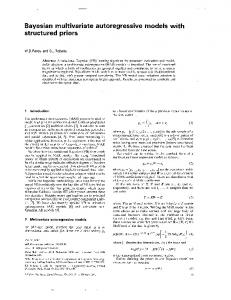
ment with 25 geographic districts and each of them includes 6 to 17 counties. District offices divide their work into area offices and area offices into local maintenance offices. Design and maintenance, right-of-way acquisition, construction oversight, and transportation planning are mainly administrated and accomplished locally due to the diversity of climates and soil conditions in Texas. Figure 1 is a map to show geographic districts, counties, and urbanized areas in Texas.
21
4 AMARILLO
25 CHILDRESS
5
3
LUBBOCK
WICHITA FALLS
2
8 23
24
ATLANTA
10 TYLER
9
BROWNWOOD
6
19
18
FORT WORTHDALLAS
ABILENE
ODESSA
1 PARIS
11
WACO
7
LUFKIN
17
SAN ANGELO
BRYAN
14
EL PASO
20
AUSTIN
BEAUMONT
12 15
13
SAN ANTONIO
HOUSTON
YOAKUM
22 LAREDO
16 CORPUS CHRISTI
21 PHARR
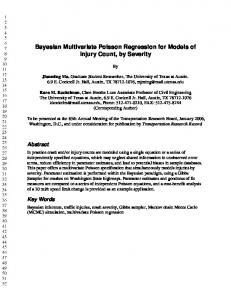
Figure 1: Geographic Districts, Counties, and Urbanized Areas in Texas. The measurements of interest in this study are Annual KAB crash frequencies for rural, two-lane, low volume on-system roads at the county level from 1992 to 1999. The number of reported KAB crashes by county in 1999 is shown in Figure 2. Lowvolume roads refer to road segments carrying fewer than 2,000 vehicles per day and 4,824 KAB crashes were occurred on the roads of interest in 1999. Figure 3 shows total vehicle-miles for the same year (in millions of vehicle-miles traveled, or MVMT). The highest, lowest, and average of the ”raw” annual KAB crash rates by county are displayed by a bubble plot in Figure 4 and the rate represents in number of crashes per MVMT. In Figure 4, raw crash rate is expressed in terms of the diameter of the ball. The three balls on the lowest left corner indicate 1.0, 0.5, and 0.25 crashes per
22
4
9
11
4
2
6
8
9
4
6
2
10
7
7
6
12
10
3
9
6
1
4 11
4
8
8 13
7
4
5
18
12
7
6
2
5 3
6
24
28
10
2
3
5
10
10
11
2
3
5
9
4
9
1
15
8
19
9
5
4
5
10
24
7 2
4 5
26
4 14
10
6
20 5
3
2
5
6
9
15
15 1
11
5
5 4 20
18
5
4 15
21 23
5 3
7 3
6
20
16
31
12
0
16
19 32
49 35 30 15 1 20 18 35 16 45 62 35 15 109 46 30 6 55 12 40 0 34 6 16 46 25 0 67 57 62 9 20 30 49 45 13 16 76 37 11 64 27 45 22 24 41 56 50 15 33 23 58 13 35 50 15 12 37 17 31 24 39 11 62 15 12 12 28 41 29 16 56 28 30 22 30 6 34 36 41 22 34 36 28 31 26 12 17 17 36 48 19 25 21 29 20 12 37 20 37 8 32 0 40 6 21 23 44 41 20 33 18 1 36 31 43 15 29 27 17 18 19 7 38 12 17 9 5 11 25 13 3 15 11 4 8 13 27 10 15
0
18
7 13
24
31
42
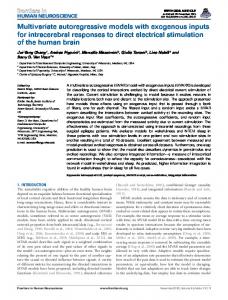
Figure 2: The Number of KAB Crashes on Rural, 2-Lane, Low-Volume, On-System Roads in Each Texas County: 1999. MVMT, respectively. The rate of county average over 8 years is 0.45 crashes/MVMT. Note that two of the urban counties and one rural county are excluded from this study because these counties have almost no rural two-lane roads with the level of traffic volumes of interest. Figure 3 shows total vehicle-miles for the same year (in millions of vehicle-miles traveled, or MVMT). The highest, lowest, and average of the ”raw” annual KAB crash rates by county are displayed by a bubble plot in Figure 4 and the rate represents in number of crashes per MVMT. In Figure 4, raw crash rate is expressed in terms of the diameter of the ball. The three balls on the lowest left corner indicate 1.0, 0.5,
23
and 0.25 crashes per MVMT, respectively. The rate of county average over 8 years is 0.45 crashes/MVMT. Note that two of the urban counties and one rural county are excluded from this study because these counties have almost no rural two-lane roads with the level of traffic volumes of interest. Figure 4 shows that crash rates in most counties over the eight-year period are stable, whereas remarkable differences between the highest and the lowest rates are found in several counties. It is clear that eastern counties have considerable higher rates and east-west is divided in terms of the KAB crash rates. Rural roadways in the eastern counties are limited by the rolling terrain and tend to have less driver-friendly characteristics, with more horizontal and vertical curves (Figure 5), restricted sight distance, and less forgiving roadside development (e.g., trees closer to the travelway and steeper side slopes). Besides, rural roads in more and larger urbanized areas in the east tend to have higher roadside development scores, higher access density, and narrower lanes and/or shoulders (Fitzpatrick et al. 2001). Figure 6 shows that the proportions related to wet-weather crashes are generally higher in northern and eastern counties. In addition, it is found in Figure 7 that eastern counties have more crashes at intersections than western counties. The National Highway System Designation Act of 1995 repealed the national maximum speed limit and returned authority to set speed limits to the states. Speed limits for daylight on many highways in Texas were increased from 55 mph to 70 for passenger vehicles and to 60 for trucks in early 1996. Griffin et al. (1998) investigated relationship between speed limit raising and the number of KAB crashes increased using monthly time series data from January 1991 to March 1997. The study indicated that the number of KAB crashes on the roads whose speed limits were raised increased in five out of the six highway categories considered during the post-invention periods. Furthermore, the speed limit raising resulted in increases in both the number of
24
20
47
46
22
21
35
35
22
25
11
18
28
40
35
24
8
14
28
35
37 39 28
54
67
33 43
19 42
17 24
29 28
17 22
35
42 43
58
55
54
69 60 65 18 26 63 92 58 38 30 20 45 42 34 17 18 30 39 25 67 84 24 18 21 91 40 0 34 17 44 49 63 19 49 70 44 1 59 49 69 88 77 24 75 20 40 90 53 44 29 24 28 40 29 67 67 10 76 51 102 69 78 85 4 35 32 38 29 17 31 57 52 51 53 86 94 52 67 31 53 80 62 35 34 29 29 47 31 34 56 40 44 72 30 24 54 57 53 59 49 44 24 46 56 53 40 16 17 100 66 46 58 53 52 42 49 23 56 48 36 32 59 52 59 16 45 29 9 40 37 36 23 29 40 32 42 22 51 37 20 47 54 28 23 52 64 15 61 0 47 63 31 10 35 38 53 50 37 24 63 2 55 66 61 9 50 18 56 59 52 58 58 46 75 28 13 22 38 28 29 40 18 36 37 31 47 11 28 65 29 33 20 30
17
61
48
68
25
18
23
39
33
15
46
47 44
25
0
71
37
74
68
89
69
Figure 3: Vehicle-Miles Traveled on Rural, 2-Lane, Low-Volume, On-System Roads in Each Texas County: 1999. injuries and fatalities related to speed, 3.3% for incapacitating injuries, 7.0% for nonincapacitating injuries, and 14% for fatalities from 1995 to 1996. Hence, a change in KAB crash rates in 1996 is expected in this study. 3.3
Bayesian Hierarchical Models As part of our modeling efforts, we developed a Poisson hierarchical Bayes model
for traffic crash risk mapping at the county level for state-maintained rural, two-lane, low volume roads (fewer than 2,000 vehicles per day) in Texas. In general, the model consists of six components:
25
Figure 4: ”Raw” Annual KAB Crash Rates in Crashes per MVMT by County: 19921999 (Highest, Average, and Lowest in the 8-Year Period). The Diameter of the Dark Outer Circle Represents the Highest Crash Rate; the Light Gray Intermediate Band Represents the Average Crash Rate; and the Medium Gray Inner Circle Represents the Lowest Crash Rate. • an offset term: the amount of travel occurring on state-maintained rural, twolane, low volume roads (fewer than 2,000 vehicles per day) • a fixed TxDOT district effect • a fixed or random covariate effect term • a random spatial effect component using conditional autoregressive prior in which the inverse of the Great Circle distance between the centroid of counties
26
13
11
8
11
9
9
9
8 9 6
14
7
10 10
8
12
11
8
10
8
9
13
12
13 14
10
17 17 18
15
10 12
14
16
14
18
16
16
24 19 18 17 21 27 13 10 14 15 19 17 9 5 5 25 18 18 2019 20 26 21 20 20 10 12 13 18 18 20 18 21 21 3 6 20 21 28 21 22 22 27 25 18 19 10 14 19 19 21 20 2 5 23 22 22 21 20 22 24 25 2 6 10 16 18 16 20 21 2 3 22 2 23 21 21 24 24 21 22 4 24 13 2 3 13 25 25 6 25 13 11 11 18 22 24 27 11 20 31 24 27 20 18 9 9 26 24 22 24 7 23 10 23 31 33 29 13 24 22 21 23 15 26 36 26 20 37 32 22 26 24 9 19 17 23 39 27 25 13 26 26 17 23 19 19 22 13 32 32 24 15 20 22 19 20 16 16 22 19 23 25 14 12 16 17 13 16 12 12 12 12 14 17 14 11 7 7 17 17 15 6 15 15 4 10 14 16 15 5
14
8 10
12
8
10
13
19
13
15
15
7
14
7 8
23
25
25
9 11
11 11
Figure 5: Proportion of KAB Crashes That Occurred on Sharp Horizontal Curves in Each County (In Percent; Averaged over the 1992-1999 Period and 6 Neighboring Counties). is employed as the weights for structuring spatial association • a fixed or random time effect term to represent year-to-year changes • an exchangeable random effect component representing a pure independent random local spatio-temporal variation that is independent of all other components in the model In this chapter, we consider a fixed effect as an effect that is subject only to the uncertainty associated with an unstructured noninformative prior distribution with no unknown parameters and the sampling variation.1 A fixed effect can, however, vary
27
13
15
12
13
10
15
13
6
11
14
14
14
11
6
8
7 7
10
10 6
12
6
7
11
8
7
0
8 8
11
11
5
8
9
11
8
10
18
11
11
8
11
10
8
4 2
7
14
10
7
5
3
5
11
7
8
7
8
10 8
0
7
9
5
9
10
3
6 8
6
9
8 9
7 9
9 6
17
9 4
11
11
19
13
15
18 20
10 8
7 9
9 8
8
6
11 14 117 9 13 11 8 10 8 8 11
5 8 6 13 15 7 6 14 9 10 15 16 12 11 18 7 7 16 5 10 9 17 11 15 8 4 13 3 8 6 15 5 16 14 9 6 14 9 8 4 14 9 7 11 11 13 10 13 13 8 6 9 10 10 16 14 11 9 14 5 8 10 11 9 10 6 8 12 9 17 10 12 10 5 13 15 18 4 9 14 15 11 15 13 5 11 16 15 12 14 13 15 11 12 9 11 9 12 11 6 12 11 9 3 12 9 4 11 13 11 10 11
9
6
6 8
13
6
14
6 6
16
10
4
16
18
15
10
15
17
12
10
15
13
7
17
10 9
10
10 10
10 10
Figure 6: Proportion of KAB Crashes That Occurred under Wet Pavement Conditions for Each County: 1999 (In Percent; Averaged over 6 Neighboring Counties). by individual districts, counties, and time periods (see the discussion of model hierarchy). Note also that unlike the traditional traffic crash prediction models (Maher and Summersgill 1996; Miaou 1996; and Hauer 1997), which were concerned principally with modeling the fixed effects for individual sites (e.g., road segments or intersections), this study focuses more on exploring the structure of the random component of the model for area-based data. The rediscovery by statisticians in the last 15+ years of the Markov chain Monte Carlo (MCMC) methods and new developments, including convergence diagnostic statistics, are revolutionizing the entire statistical field (Besag et al. 1995; Gilks et al. 1996; Carlin and Louis 1996; Roberts and Rosenthal
28
50
33
9
75
17
38
33
25
33
0
40
57
14
0
60
33
33
0
33 33
40
0 0
0
25
14
50
39
50
14
0
17
46
25
30
100 33
38 8
50
0
0
25
22
0
40
38
0
20
50
40
30
27
20
43
50
0
0
0
20
0
0
12
0
14 20
40
30
25
25
40
50
11 27 0
18
40 25 15
6
0 20 67
20 0
50
35
13
48
17
26
40 35 43 43 40 42 22 0 20 4050 22 37 40 40 63 83 36 8 39 36 0 47 17 6 47 43 36 39 45 40 47 20 36 56 38 46 13 47 15 30 55 41 36 32 8 27 47 27 33 23 38 35 24 23 17 30 13 25 32 35 26 0 33 33 27 19 33 17 25 21 34 31 50 40 34 43 53 27 43 17 29 28 29 27 32 28 32 19 25 31 42 18 29 33 35 26 52 43 14 25 33 32 10 32 13 28 50 19 4 67 33 34 39 40 24 28 0 35 31 68 42 40 24 22 29 39 29 58 57 37 33 29 89 67 0 64 32 31 0 20 36 25 50 54 67 20 60
7
0
33
29 15
25
23
50
25 38
53 59
Figure 7: Proportion of KAB Crashes That Were Intersection, Intersection Related, or Driveway Access Related for Each County: 1999 (In Percent). 1998; Robert and Casella 1999). At the same time, improved computer processing speed and lower data-collection and storage costs are allowing more complex statistical models to be put into practice. These complex models are often hierarchical and high dimensional in their probabilistic and functional structures. Furthermore, many models also need to include dynamics of unobserved and unobservable (or latent) variables; deal with data distributions that are heavily tailed, highly overdispersed, or multimodal; and work with datasets with missing data points. MCMC provides a unified framework within which model identification and specification, parameter estimation, performance evaluation, inference, prediction, and communication of
29
65
67
68
59
61
65
63
64
54
54
59
59
60
48
50
58
60
62
48 50 53
62
53
51 48
55 57
62 64 63
65
61 62
61
60
60
58
61
59
57 60 57 53 57 54 63 61 52 69 64 64 65 65 65 51 53 55 5754 52 52 55 55 54 66 64 63 63 62 64 67 64 60 59 61 52 52 58 55 53 62 62 61 53 53 54 56 61 61 56 55 63 66 59 57 64 61 57 61 61 61 57 60 57 53 56 63 54 56 60 64 66 60 60 62 62 64 60 60 60 58 57 67 69 58 58 61 54 68 63 57 58 68 60 63 59 60 67 69 68 59 58 60 62 65 71 59 56 59 59 71 62 75 70 70 67 62 72 62 61 61 58 81 65 75 61 53 72 69 64 62 59 76 51 53 61 73 63 58 72 78 64 80 61 52 63 61 73 72 68 59 48 63 60 54 60 65 47 64 60 56 64 57 51 55 63 56 59 58 52 53 60 59 58 61 54 59 59 57 58 60 58 49 58 63 54 49 49 48 57
62
49
67
50
53
49
69
68
67
61
61
62 50 46
55
56
55
49 41
41 41
Figure 8: Proportion of KAB Crashes Involving Vehicles That Ran Off Roads and Hit Fixed Objects on the Roadside for Each County: 1999 (In Percent; Averaged over 6 Neighboring Counties). complex models can be conducted in a consistent and coherent manner. With today’s desktop computing power, it is relatively easy to sample the posterior distributions using MCMC methods that are needed in full Bayes methods. The advantage of full Bayesian treatment is that it takes into account the uncertainty associated with the estimates of the random-effect parameters and can provide exact measures of uncertainty. Maximum likelihood methods, on the other hand, tend to overestimate precision, because they ignore this uncertainty. This advantage is especially important when the sample size is small. Other estimation meth-
30
ods for hierarchical models are also available, e.g., iterative generalized least squares (IGLS), expected generalized least squares (EGLS), and generalized estimating equations (GEE). These estimation procedures tend to focus on obtaining a consistent estimate of the fixed effect rather than exploring the structure of the random component of the model (Goldstein 1999). For some problems, existing software packages such as WinBUGS (Spiegelhalter et al. 2000) and MLwiN (Yang et al. 1999) can provide Gibbs and other MCMC sampling for a variety of hierarchical Bayes models. For the models presented in this paper, we relied solely on the WinBUGS codes. At present, however, the type of spatial and temporal models available in WinBUGS is somewhat limited and will be discussed later. 3.3.1
Notations
We let the indices i, j, and t represent county, TxDOT district, and time period, respectively, where i = 1, 2, · · · , I; j = 1, 2, · · · , J; and t = 1, 2, · · · , T . For the data analyzed, we have 251 counties, divided among 25 districts, and 8 years of annual data (i.e., I = 251, J = 25, and T = 8). As indicated earlier, each district may include 6 to 17 counties, which will be represented by county set Dj , where j = 1, 2, · · · , 25. That is, Dj is a set of indices representing counties administered by TxDOT district j. We define variable Yit as the total number of reported KAB crashes on the rural road of interest in county i and year t. We also define νit as the observed total vehiclemiles traveled (VMT) in county i and year t for the roads in discussion, representing the size of the population at risk. In addition, we define xitk as the kth covariate associated with county i and year t. Three covariates were considered.
31
3.3.2
Covariates
The first covariate xit1 is a surrogate variable intended to represent the percentage of time that the road surface is wet due to rain, snow, etc. Not having detailed weather data, we chose to use the proportion of KAB crashes that occurred under wet pavement conditions as a surrogate variable. In addition, we do not expect general weather characteristics to vary much between neighboring counties. Therefore, the proportion for each county is computed as the average of this and six other neighboring counties that are close to the county in terms of their Great Circle distances. We do, however, expect weather conditions to vary significantly from year to year. Thus, for each county i, we have xit1 change with t. The second covariate xit2 is intended to represent spatial differences in the number of sharp horizontal curves in different counties. The actual inventory of horizontal curves on the highway network is not currently available. However, when a traffic crash occurs, site characteristics including the horizontal curvature are coded in the traffic crash database. We chose to use the proportion of KAB crashes that occurred on sharp horizontal curves in each county as a surrogate variable, and we define a sharp horizontal curve as any road segment having a horizontal curvature of 4 or higher degrees per 100-foot arc. Given that this roadway characteristic is mainly driven by terrain variations, we do not expect this characteristic to vary much between neighboring counties. Therefore, as in the first covariate, the proportion for each county is computed as the average of this and six other neighboring counties that are close to the county in terms of their Great Circle distances. Furthermore, for this type of road, we did not expect the proportion to vary in any significant way over the eight-year period in consideration. Thus, the average proportion from 1992 to 1999 was actually used for all t. In other words, for each county i, xit2 are the same for all
32
t. The third covariate xit3 is a surrogate variable intended to represent degrees of roadside hazards. As in the second covariate, the actual inventory of hazards (ditches, trees, and utility poles), available clear zones, and geometry and surface type of roadsides are not available. Similar to the first covariate, a surrogate variable was devised to indicate the proportion of KAB crashes that ran off roads and hit fixed objects on the roadside. We also do not expect this characteristic to vary much between neighboring counties over the eight-year period in consideration. Again, the average proportion from 1992 to 1999 was used for all t, i.e., for each county i, xit3 are the same for all t. Figure 8 shows the spatial distribution of this variable. The use of these surrogate variables is purely data driven (as opposed to theory driven) and empirical in nature. We use the proportion of wet crashes (xit1 ) as an example to explain the use and limitation of such surrogate measures in practice. First, variables such as ”percentage of wet crashes” and ”wet crashes to dry crashes ratio” are commonly used in wet-weather accident studies. Examples in the literature include Coster (1987), Ivey and Griffin (1990), and Henry (2000). These authors reviewed various wet-weather accident studies, and the relationships between 1) skid numbers (or friction values) of pavement and percentage of wet weather accidents, and 2) skid numbers and wet/dry pavement surfaces were quite well documented. Although they were conducted with limited data, these wet weather accident studies also suggest that crash rates are higher during wet surface conditions than under dry surface conditions, and some indicate that traffic volumes are reduced by about 10% to 20% during wet weather in rural areas (no significant reduction was found in urban areas). Second, the use of percentage of wet crashes as a surrogate variable in this study to explain the variation of crash rates by county mixes several possible relationships
33
and has limited explanatory power. A positive correlation of percentage of wet crashes and crash rate mixes has at least two possible relationships: 1) the effect of wet surface conditions on crash rates, and 2) the effect of rainfall (or other precipitation) on traffic volumes. Everything else being equal, if the wet surface crash rate is the same as the dry surface crash rate, then we do not expect this positive correlation to be statistically significant in the model regardless of the relative traffic volumes during wet or dry surface conditions. We interpret a positive correlation as an indication that a higher crash rate is indeed experienced during wet surface conditions than during dry conditions. However, because of the lack of data on traffic volumes by wet and dry surface conditions, we are not able to quantify the difference in crash rates under the two surface conditions. This is the main limitation in using such a surrogate measure. 3.3.3
Probabilistic and Functional Structures
The space-time models considered in this study are similar to the hierarchical Bayes generalized linear model used in several disease mapping studies cited earlier. At the first level of hierarchy, conditional on mean µit , Yit values are assumed to be mutually independent and Poisson distributed as Yit ∼ Poisson(µit ).
(3.1)
The mean of the Poisson is modeled as µit = νit λit ,
(3.2)
where total VMT νit is treated as an offset and λit is the KAB crash rate. The rate, which has to be non-negative, is further structured as log(λit ) =
T X J X t=1 j=1
αjt I(i ∈ Dj ) +
X k
βk xitk + δt + ηi + eit ,
(3.3)
34
where I(S) is the indicator function of the set S. This makes the first term on the right hand side of equation (3.3) the intercept representing district effects at different years; xitk are covariates discussed earlier and their interactions; δt represents yearto-year time effects due, e.g., to speed limit, weather, and socioeconomic changes; ηi is a random spatial effect; eit is an exchangeable, unstructured, space-time random effect; and αjt and βk are regression parameters to be estimated from the data. As defined earlier, Dj is a set of indices representing counties administered by TxDOT district j. Many possible variations of equation (3.3) were and could potentially be considered in this study. For each component that was assumed to have a fixed effect, the second level of hierarchy was chosen to be an appropriate noninformative prior. On the other hand, for each component that was assumed to have a random effect, the second level of hierarchy was a prior with certain probabilistic structure that contained unknown parameters. The priors for these unknown parameters (called hyperpriors) constitute the third level of the hierarchy. What follows are discussions of the variation of models considered by this study, some limitations of the WinBUGS software, and possible extensions of the models considered. The intercept term, which represents the district effect over time, was assumed to have fixed effects with noninformative normal priors. For the covariates xitk , we considered both fixed and random effects. That is, βk was assumed to be either a fixed value or random variable. The three covariates discussed earlier and three of their interactive terms, xit4 = xit1 xit2 , xit5 = xit1 xit3 , and xit6 = xit2 xit3 , were included in the model. It is important to note that the values of these covariates were centered for better numerical performance. Noninformative normal priors were also assumed for fixed-effect models. For the random-effect model, βk , k = 1, 2, · · · , 6, are assumed to be independent and normally distributed with mean µβk and variance σβ2k , expressed
35
as N(µβk , σβ2k ). Noninformative normal and inverse gamma priors (or more precisely hyperpriors) were assumed for µβk and σβ2k , respectively. With 251 counties and 8 years of data, the data are considered to be quite rich spatially but rather limited temporally, as are data in many disease mapping studies. Because of this limitation, we only considered two simple temporal effects for δt : fixed effects varying by t (or a year-wise fixed-effect model) and an order-one autoregressive model (AR(1)) with the same coefficient for all t. Again, noninformative priors were used for both models. For the model to be identifiable, in the fixed-effect model, δ1 was set to zero, and in the AR(1) model, δ1 was set to be an unknown fixed constant. From the fixed effect, we expected to see a change in δt at t = 5 (1996), due in part to the speed limit increase in that year. Recent disease mapping research has focused on developing more flexible, yet parsimonious, spatial models that have attractive statistical properties. Based on the Markov random field (MRF) theory, Besag’s conditional autoregressive (CAR) model (Besag 1974, 1975) and its variants are by far the most popular ones adopted in disease mapping. We considered several Gaussian CAR models, all of which have the following general form ( p(ηi |η−i ) ∝ rη1/2 exp
) X rη − wii∗ (ηi − ηi∗ )2 , 2 i∗ ∈C
(3.4)
i
where η−i represents all η except ηi , Ci is a set of counties representing ”neighbors” of county i, wii∗ is a positive weighting factor associated with the county pair (i, i∗ ). This equation is shown to be equivalent to p(ηi |η−i ) ∼ N(µηi , ση2i ), where µηi =
P
i∗ ∈Ci∗ (wii∗ /wi+ )ηi∗ ,
ση2i = 1/(rη wi+ ), and wi+ =
P i∗ ∈Ci∗
wii∗ . In our
study, we had wii∗ = 1/dcii∗ , where dii∗ is the Great Circle distance between the
36
centroid of county i and i∗ , and c is a constant parameter equal to 1 or 2 (note that dii∗ ranges roughly from 30 to 700 miles.) With regard to the number of neighbors, we adopted a more generous definition by allowing every other county i∗ (6= i) to be a neighbor of county i. In theory, we could treat the constant c as an unknown parameter and estimate it from the data. However, in the current version of WinBUGS, the weights of the builtin CAR spatial model do not allow unknown parameters (Spiegelhalter et al. 2000), which we found to be a limitation for our application. In a separate attempt to find a good range of the decay constant for the inverse distance weight in the CAR model, we adopted a simpler model that included only the offset, the yearwise time effect, and the Gaussian CAR components. We estimated the same model with different c values between 0 and 4 and found that model performance was best achieved when the decay constant was set between 1 and 2 (based on the deviance information criterion to be discussed shortly). Weights with an exponential form wii∗ = exp(−cdii∗ ) were also examined but are not reported in this paper. We also explored the L-1 CAR models of the following form: ( ) X p(ηi |η−i ) ∝ rη exp − rη wii∗ |ηi − ηi∗ | ,
(3.5)
i∗ ∈Ci
where rη is a fixed-effect parameter the same for all i. Weights with the same c as in the Gaussian CAR models were considered. WinBUGS constrains the sum of ηi to zero to make both the Gaussian CAR and L-1 CAR spatial models identifiable. A non-informative gamma distribution was used as hyperpriors for rη in equations (3.4) and (3.5). The spatial correlation structure represented by equations (3.4) and (3.5) is considered global in the sense that the distribution functions and associated parameters (c and rη ) do not change by i. More sophisticated models allowing spatial correla-
37
tion structure to be adaptive or location specific are being actively researched (e.g., Lawson 2000; Green and Richardson 2001). Still, computational challenges seem to be keeping researchers from exploring more flexible, yet parsimonious, space-time interactive effects, and more research in this area needs to be encouraged (Sun et al. 2000). For the exchangeable random effects, we considered two commonly used distributions. One distribution assumed eit to be independent and identically distributed (iid) as eit ∼ N(0, σe2 ).
(3.6)
Another distribution assumed an iid one-parameter gamma distribution as exp(eit ) ∼ G(ψ, ψ),
(3.7)
which has a mean equal to 1 and a variance 1/ψ. The use of a one-parameter gamma distribution (instead of a two-parameter gamma) ensures that all model parameters are identifiable. Again, non-informative inverse gamma and gamma distributions were used as hyperpriors for σe2 and ψ, respectively. 3.4
Deviance Information Criterion and Variants The deviance information criterion (DIC) has been proposed to compare the
fit and complexity (measured by the effective number of parameters) of hierarchical models in which the number of parameters is not clearly defined (Spiegelhalter et al. 1998; Spiegelhalter et al. 2002). DIC is a generalization of the well-known Akaike Information Criterion (AIC) and is based on the posterior distribution of the deviance statistic D(θ) = −2 log(p(y|θ)) + log(f (y)),
38
where p(y|θ) is the likelihood function for the observed data vector y given the parameter vector θ, and f (y) is some standardizing function of the data alone. For the Poisson model, f (y) is usually set as the saturated likelihood, i.e., f (y) = p(y|µ = y) where µ is a vector of the statistical means of vector y. DIC is defined as a classical estimate of fit plus twice the effective number of parameters, which gives ¯ + 2pD = D ¯ + pD , DIC = D(θ)
(3.8)
¯ is the deviance evaluated at θ, ¯ the posterior means of the parameters where D(θ) ¯ is the of interest; pD is the effective number of parameters for the model; and D posterior mean of the deviance statistics D(θ). As with AIC, models with lower DIC values are preferred. From equation (3.8), we can see that the effective number of parameters pD is defined as the difference ¯ and the deviance at the posterior between the posterior mean of the deviance D ¯ means of the parameters of interest D(θ) ¯ ¯ − D(θ). pD = D It was shown that in nonhierarchical models (or models with negligible prior information) DIC is approximately equivalent to AIC. It has also been emphasized that the quantity of pD can be trivially obtained from an MCMC analysis by monitoring both θ and D(θ) during the simulation. For the random-effect model considered in equations (3.1) through (3.3), the parameter vector θ should include αjt , βk , δt , ηi and eit for all i, j, k, and t. ¯ and pD , we also used ¯ D(θ), In addition to DIC values and associated quantities D, some goodness-of-fit measures that attempted to standardize DIC in some fashion.
39
2 This includes DIC divided by sample size n and RDIC , which defined as 2 RDIC =1−
DICmodel − DICref DICmax − DICref
(3.9)
where DICmodel is the DIC value for the model under evaluation, DICmax is the maximum DIC value under fixed one-parameter model, DICref is a DIC values from a referenced model that, ideally, represents some expected lower bound of the Poisson hierarchical model for a given dataset. 2 Clearly, RDIC is devised in the spirit of the traditional r2 goodness-of-fit measure
for regression models. Through simulations, Miaou (1996) evaluated several similar measures using AIC for overdispersed Poisson models. Since DIC is known to be noninvariant with respect to the scale of the data (Spiegelhalter et al. 1998; Spiegelhalter et al. 2002), an analytical development of DICref is difficult. However, we know that ¯ should be close to sample size n (Spiegelhalter et al. for a model with a good fit, D 2002). We, therefore, chose DICref = n as a conservative measure for computing 2 RDIC ; that is, the effective number of parameters was essentially ignored.
Another goodness-of-fit indicator considered is 1/ψ, which is the variance of exp(eit ) under the gamma model, indicating the extent of overdispersion due to exchangeable random effect. In theory, this value could go to zero when such effects 2 vanish. Thus, similar to RDIC , we can devise the following measure:
Rψ2 = 1 −
(1/ψ)model , (1/ψ)max
where (1/ψ)model is the variance of exp(eit ) for the model under consideration, and (1/ψ)max is the amount of overdispersion under the simplest model. In essence, (1/ψ)ref , the expected lower bound, is set to zero.
40
3.5
Results Table 1 lists 42 models of various complexities examined by this study. These
models include simplified versions of the general model presented in equations (3.2) and (3.3), as well as models for reference purposes, e.g., models 1 to 3. Model 1 is a saturated model, in which the estimates of the Poisson means µˆit are equal to yit . Model 2, expressed as α0∗ , is a one-parameter Poisson model without the offset, and model 3 is another one-parameter model with the offset. Essentially, model 2 focuses on traffic crash frequency and model 3 on traffic crash rate. In Table 1, the following symbols are used: • αj stands for fixed district effects. • βF and βN respectively represent fixed covariate effects and random covariate effects with independent normal priors. • δF and δAR respectively stand for fixed time and AR(1) time effects. • For the random spatial effects, ηN 1 and ηL1 , represent the Gaussian and L-1 CAR models shown in equations (3.4) and (3.5), respectively, and both have a decay constant c equal to 1. • ηN 2 and ηL2 represent similar spatial models with a decay constant c equal to 2. • The components eN and eG represent exchangeable random effects as presented in equations (3.6) and (3.7), respectively. We experienced some computational difficulties for the models that included the βN component when we tried to include all six main and interactive effects. Therefore, for all models with the βN component, we only included the three main effects.
41
2 In computing RDIC , DICmax is defined as the maximum DIC value under a fixed
one-parameter model, which is model 2 in the table when crash frequency is the focus and model 3 when crash rate is the focus. Similarly, in computing Rψ2 , (1/ψ)max is set as the amount of overdispersion under the simplest model with an eG error component, which is model 11 for models focusing on the crash rate. As a rule, in our development we started with simpler models, and the posterior means of the estimated parameters of these simple models were then used to produce initial values for the MCMC runs of more complex models. In general, the models presented in the table are ordered by increasing complexity: intercepts only, intercepts + covariate effect, intercepts + covariate effect + exchangeable effect, intercepts + covariate effect + exchangeable effect + spatial/temporal effects, and so on. Models 7 to 9 and the last eight models include a more complex fixed-effect intercept term. The models are presented in the table in line with the order in which they were estimated with the WinBUGS codes. The MCMC simulations usually reached convergence quite quickly. Depending on the complexity of the models, for typical runs, we performed 10,000 to 20,000 iterations of simulations and removed the first 2,000 to 5,000 iterations as burn ins. As in other iterative parameter estimation approaches, good initial estimates are always the key to convergence. For some of the models, we have hundreds of parameters and MCMC monitoring plots based on the Gelman-Rubin statistics (which are part of the output from the WinBUGS codes). Because estimated parameters usually converge rather quickly, their convergence plots, which are not particularly interesting to show, are not presented here. From DIC and other performance measures in Table 1, several observations can be made:
42
• For the exchangeable random effect, models with a gamma assumption (equation 3.6) are preferred over those with a normal assumption (equation 3.5). This is observed by comparing the performance of, e.g., model 15 with model 14, model 18 with model 17, and model 27 with model 26. • Models with fixed covariate effects are favored over their random-effect counterparts. This is seen by comparing, e.g., model 25 with model 24 and model 33 with model 34. • Models with fixed time effects (e.g., model 23) performed better than those with AR(1) time effects (e.g., model 22). • Models with separate district and time effects (αj and δt ) are preferred over those with joint district time effects (αj ). For example, we can compare the performance of model 27 with model 42 and model 40 with model 24. • For comparable model structures, adding a spatial component decreases the DIC value quite significantly, which indicates the importance of the spatial component in the model. As an example, we can compare model 17 with model 20. Except for the spatial component, these two models have the same structures (in intercept terms, covariate effects, and the error component). Model 17 does not have any spatial component, while model 20 includes a normal CAR model. The DIC value drops from 3,287 for model 17 to 2,755 for model 20, a very significant reduction when compared with the differences in DIC values for various models presented in Table 1. Other comparisons that would give the same conclusion include model 19 vs. model 22 or model 38 with models 40 and 42. • No particular spatial CAR models considered by this study, i.e., ηN 1 , ηL1 , ηN 2 , or ηL2 , were clearly favored over other CAR models.
Table 1: Deviance Information Criterion and Related Performance Measures for Models of Various Complexities: Notes i: County, j: District, t: Time Period, and n = 2, 008: Sample Size. Model 1 is the Saturated Model, Model 2 is the Constant Frequency Model, and Model 3 is the Constant Rate Model. 2 2∗ ¯ ¯ No. Model D D(θ) pD DIC DIC/n RDIC RDIC 1/ψ Rψ2 ∗ 1 αit 2026 61 1965 3991 1.99 0.91 0.77 ∗ 2 α0 23416 23414 1 23417 11.66 0 – 3 ν + α0 10706 10701 5 10710 5.33 0.59 0 4 ν + α 0 + βF 6716 6713 2 6718 3.35 0.78 0.46 5 ν + α 0 + βF + δ F 6686 6676 10 6695 3.33 0.78 0.46 6 ν + α j + βF 5126 5090 36 5161 2.57 0.85 0.64 7 ν + αj,t 5316 5113 202 5518 2.75 0.84 0.6 8 ν + αj,t + βF 4816 4608 208 5024 2.5 0.86 0.65 9 ν + αjt + βF + δF 4816 4623 193 5009 2.49 0.86 0.66 10 α0 + eN 2116 350 1765 3881 1.93 0.91 0.78 11 ν + α0 + eG 2086 582 1504 3590 1.79 0.93 0.82 0.263 0 12 ν + α0 + eN 2146 611 1534 3680 1.83 0.92 0.81 13 ν + α0 + ηN 1 2846 2473 373 3218 1.6 0.94 0.86 14 ν + αj + eN 2156 988 1168 3324 1.66 0.94 0.85 15 ν + αj + eG 2136 978 1158 3294 1.64 0.94 0.85 0.103 0.61 16 ν + αj + ηN 1 2846 2483 362 3208 1.6 0.94 0.86 17 ν + α j + βF + e N 2186 1085 1101 3287 1.64 0.94 0.85 18 ν + α j + βF + e G 2156 1046 1110 3266 1.63 0.94 0.86 0.089 0.66 19 ν + αj + βF + δAR + eN 2176 1080 1096 3272 1.63 0.94 0.85 20 ν + αj + βF + ηN 1 + eN 2066 1376 689 2755 1.37 0.97 0.91 21 ν + αj + βF + ηL1 + eN 2066 1375 691 2757 1.37 0.97 0.91 22 ν + αj + βF + ηN 1 + δAR + eN 2066 1380 686 2751 1.37 0.97 0.91 23 ν + αj + βF + ηN 1 + δF + eN 2056 1377 679 2735 1.36 0.97 0.92 24 ν + αj + βF + ηN 1 + δF + eG 2026 1342 684 2709 1.35 0.97 0.92 0.022 0.92 Continued on next page
43
No. 25 26 27 28 29 30 31 32 33 34 35 36 37 38 39 40 41 42
Model ν + αj + βN + ηN 1 + δF + eG ν + αj + βF + ηN 2 + δF + eN ν + αj + βF + ηN 2 + δF + eG ν + αj + βN + ηN 2 + δF + eG ν + αj + βF + ηL1 + δF + eN ν + αj + βF + ηL1 + δF + eG ν + αj + βN + ηL1 + δF + eG ν + αj + βF + ηL2 + δF + eN ν + αj + βF + ηL2 + δF + eG ν + αj + βN + ηL2 + δF + eG ν + αjt + eN ν + αjt + eG ν + αjt + βF + eN ν + αjt + βF + eG ν + αjt + βF + ηN 1 + eN ν + αjt + βF + ηN 1 + eG ν + αjt + βF + ηN 2 + eN ν + αjt + βF + ηN 2 + eG
Table 1 continued ¯ ¯ D D(θ) pD DIC 2036 1327 709 2744 2046 1360 686 2731 2016 1329 687 2703 2026 1318 708 2733 2056 1375 681 2736 2026 1339 687 2712 2036 1330 706 2742 1966 1181 785 2751 2016 1327 689 2704 2026 1317 709 2735 2166 917 1249 3415 2126 886 1240 3365 2156 965 1191 3347 2136 962 1174 3310 1956 1103 853 2808 1936 1091 845 2781 1946 1086 860 2806 1926 1072 854 2780 DIC/n 1.37 1.36 1.35 1.36 1.36 1.35 1.37 1.37 1.35 1.36 1.7 1.68 1.67 1.65 1.4 1.38 1.4 1.38
2 RDIC 0.97 0.97 0.97 0.97 0.97 0.97 0.97 0.97 0.97 0.97 0.93 0.94 0.94 0.94 0.96 0.96 0.96 0.96
2∗ RDIC 0.92 0.92 0.92 0.92 0.92 0.92 0.92 0.91 0.92 0.92 0.84 0.84 0.85 0.85 0.91 0.91 0.91 0.91
Rψ2 0.92 0.92 0.92 0.92 0.92
0.92 0.59 0.66 0.9 0.9
1/ψ 0.02 0.021 0.02 0.022 0.02
0.02 0.108 0.089 0.027 0.027
44
45
2 • Despite the empirical nature of the two goodness-of-fit measures RDIC and Rψ2 ,
seeing some of the better models that have values exceeding 0.9 provides some comfort as to the general explanatory capability of these models. Table 2 shows some statistics of the estimated posterior density of a selected number of parameters for model 27, which was one of the best models in terms of the DIC value and other performance measures discussed above. Also, Figure 9 presents estimated posterior mean crash rates, as well as their 2.5 and 97.5 percentiles, in a bubble plot for 1999 by county. From Table 2, one can see that the fixed-time effect δt jumps from about 0 in previous years to about 0.05 in t = 4 (1995) and has another increase to about 0.09 at t = 5 (1996). The value comes down somewhat (about 0.06) in 1998 (t = 7) and 1999 (t = 8) but is still significantly higher than those in the preintervention periods. It has been suggested that the jump in 1995 was perhaps due to higher driving speeds by drivers in anticipation of a speed limit increase, and higher crash rates in 1996 were due in part to the speed limit increase and less favorable winter weather (Griffin et al. 1998). Lower δt values in 1998 and 1999 may suggest that drivers had adjusted themselves and become more adapted to driving at higher speeds. From the same model (model 27), estimates of αj , i.e., district effects, range from about -0.5 to -1.5, indicating significant district-level variations in crash risk. The covariate effects βk indicate that the horizontal curve variable is the most influential and statistically significant variable in explaining the crash rate variations over space. Wet pavement condition is the second-most significant variable. The ran-off-road fixed-object variable is not a statistically significant variable, which suggests that ran-off-road fixed-object crash risk is correlated with and perhaps exacerbated by the presence of sharp horizontal curves and wet pavement conditions.
46
Table 2: Example MCMC Simulation Output for Model 27: Some Statistics of the Estimated Posterior Density for a Selected Number of Parameters. Set δ1 to 0 as Baseline. Parameter α1 α2 α3 α4 α5 α6 α7 α8 α9 α10 α11 α12 α13 α14 α15 α16 α17 α18 α19 α20 α21 α22 α23 α24 α25 δ1 δ2 δ3 δ4 δ5 δ6 δ7 δ8 β1 β2 β3 β4 β5 β6 ψ 1/ψ
Mean -0.963 -0.639 -1.131 -1.240 -1.288 -1.427 -1.376 -1.218 -0.984 -0.582 -0.610 -0.498 -0.919 -0.668 -0.770 -0.893 -0.754 -0.630 -0.649 -0.877 -1.005 -1.561 -1.189 -1.114 -1.401 0 0.0132 -0.0156 0.0508 0.0929 0.0886 0.0632 0.0603 0.00286 0.00723 -0.00057 -0.00004 0.00009 -0.00015 46.52 0.0023
Standard error 0.154 0.148 0.162 0.183 0.155 0.182 0.128 0.130 0.158 0.162 0.156 0.208 0.149 0.137 0.139 0.165 0.139 0.170 0.171 0.208 0.308 0.224 0.147 0.378 0.156 0 0.026 0.027 0.027 0.027 0.027 0.027 0.026 0.0018 0.0019 0.0014 0.0002 0.0002 0.0002 5.04 0.0002
2.5% -1.269 -0.929 -1.450 -1.595 -1.595 -1.768 -1.629 -1.479 -1.283 -0.889 -0.924 -0.918 -1.232 -0.943 -1.045 -1.216 -1.030 -0.966 -0.975 -1.282 -1.656 -1.980 -1.483 -1.831 -1.712 0 -0.0380 -0.0677 -0.0009 0.0418 0.0365 0.0111 0.0089 -0.00079 0.0035 -0.00346 -0.00050 -0.00028 -0.00045 37.83 0.0019
Median -0.964 -0.635-1.128 -1.237 -1.283 -1.429 -1.375 -1.215 -0.986 -0.584 -0.602 -0.489 -0.914 -0.668 -0.772 -0.891 -0.756 -0.621 -0.645 -0.880 -0.981 -1.566 -1.187 -1.127 -1.396 0 0.0129 -0.0156 0.0508 0.0926 0.0886 0.0631 0.0601 0.0029 0.00721 -0.00057 -0.00004 -0.00010 -0.00015 46.18 0.0023
97.5% -0.662 -0.356 -0.823 -0.882 -0.993 -1.066 -1.127 -0.978 -0.666 -0.260 -0.321 -0.097 -0.634 -0.398 -0.503 -0.551 -0.495 -0.294 -0.326 -0.459 -0.442 -1.114 -0.901 -0.379 -1.094 0 0.0645 0.0376 0.1034 0.1453 0.1408 0.1155 0.1123 0.00648 0.01103 0.00229 0.0004 0.00048 0.00014 57.41 0.0028
47
3.6
Discussion Most of the methodologies developed in disease mapping were intended for area-
based data, e.g., number of cancer cases in a county or census tract during a study period. While we demonstrate the use of some of these methodologies for roadway traffic crashes at the county level, we recognize that, fundamentally, traffic crashes are network-based data, whether they are intersection, intersection-related, driveway access-related, or nonintersection crashes. Figure 10 gives an example of the locations of KAB crashes on the state-maintained highway network of a Texas county in 1999. Thus, an obvious extension of the current study is to develop risk maps for traffic crashes on road networks. The problem is essentially one of developing hierarchical models for Poisson events on a network (or a graph). We expect that, in different applications, these maps may need to be developed by roadway functional classes, vehicle configurations, types of crashes (e.g., those involving drunk drivers), and crash severity types (e.g., fatal, injury, and noninjury crashes). We also expect these network-based maps to be useful for roadway safety planners and engineers to 1) estimate the cost and benefit of improving or upgrading various design and operational features of the roadway, 2) identify and rank potential problem roadway locations (or hotspots) that require immediate inspection and remedial action, and 3) monitor and evaluate the safety performance of improvement projects after the construction is completed. Such maps need to be constructed from quality accident-, traffic-, and roadway-related databases and with scientifically grounded data visualization and modeling tools. Modeling and mapping of traffic crash risk need to face all the challenges just as in the field of disease mapping, i.e., multilevel data and functional structures, small areas of occurrence of studied events at each analysis unit, and strong unobserved
48
Figure 9: Estimated KAB Crash Rates in Crashes per MVMT by County from Model 27: 1999 (97.5 Percentile Mean, and 2.5 Percentile of the Posterior Density). The Diameter of the Dark Outer Circle Represents the 97.5 Percentile Estimates; the Light Gray Intermediate Band Represents the Mean; and the Medium Gray Inner Circle Represents the 2.5 Percentile Estimates. heterogeneity. The hierarchical nature of the data can be described as follows: In a typical roadway network, other than the fact that roadway networks are connected or configured in specific ways, individual road entities are classified by key geometric characteristics (e.g., segments, intersections, and ramps), nested within roadway functional or design classifications, further nested within operational and geographical units, and subsequently nested within various administrative and planning organizations. Strong unobserved heterogeneity is expected because of the unobserved driver
49
��
NO
�
¶·
�� �
JK
LM
ö÷
./
ÐÑ
vw
äå èé
àá,��
lm lm
@A
!
¾¿
PQ
ðñ
¸¹º»
èé
îï\]
ÌÍ
:; |}
VW
Þß
HI
øùPQ Ö×��ÜÝ ÈÉ
ÊË hi
òó
¢£ �� ÄÅ��
ÆÇ
þÿ p + q. Then, if Z
∞
exp{yij θ − ψ(θ)}dθ < ∞ −∞
for all yij , the joint posterior pdf of the θij given y is proper. The proof of the theorem is deferred to Appendix A. Direct evaluation of the posterior of the θij given y involves high-dimensional numerical integration and is not computationally feasible. Instead the Gibbs sampler is used requiring generation of samples from the full conditional distributions of the parameters. These conditionals are given by à à ! ! X 1 n + b rη |θ, β, η, Σe , y ∼ Gamma wil (ηi − ηl )2 + a , ; 2 1≤i q, n + γ > 0, and
R
p(yij |θ)dθ < ∞ for all (i, j).
Then the posterior is proper. The proof is provided in Appendix D. For Gibbs sampling, the full conditionals are given by à ! n X Σe |θ, β, η, α, Λ, y ∼ IW A + (θ i − η i − X i β)(θ i − η i − X i β)T , n + γ ; i=1
β|θ, η, Σe , α, Λ, y ∼ M N (µβ , Σβ );
η i |θ, β, η −i , Σe , α, Λ, y ∼ N (µ∗η , Σ∗η ); π(α|θ, β, η, Σe , Λ, y) ∝ |D − αW |q/2 αc−1 (1 − α)d−1 ;
Λ|θ, β, η, Σe , α, y ∼ Wishat(B, n + s);
π(θ i |θ j(j6=i) , β, η, Σe , V , y) ∝
Y j
( p(yij |θij ) exp
) 1 2 − (θ i − K 2i )t Σ−1 e (θ i − K i ) , 2
62
Pn Pn T −1 T −1 −1 −1 X Ti Σ−1 e X i) ( i=1 X i Σe (θ i −η i )), Σβ = ( i=1 X i Σe X i ) , 1X ∗ −1 −1 ∗ = Σ [Σ (θ − X β + (αwij )Ληij ]. Σ∗η = [Σ−1 + (m − αw )Λ] , and µ i i i ii η η e e 2
where µβ = (
Pn
i=1
j(6=i)
4.4
Data Analysis The data for the illustration for proposed multivariate spatial models also comes
from county-level vehicle crash records and roadway data in Texas. The TXDOT has maintained the traffic crash data by separating four types of crash based on a location in which a traffic crash occurs: • Intersection crash: a traffic crash which occurs within the limits of an intersection. • Intersection-related crash: a traffic crash which (1) occurs on an approach to or exit from an intersection and (2) result from an activity, behavior or control related to the movement of traffic units through the intersection. • Driveway access crash: a traffic crash occurs a driveway access or involves a road vehicle entering or leaving another roadway by way of on a driveway access. • Non-intersection crash: a traffic crash that is not intersection crash, intersectionrelated crash, and driveway access crash. The same covariates in Chapter III are considered here: • Wet: a surrogate variable intended to represent the percentage of time that the road surface is wet due to rain, snow, and so forth. Not having detailed weather data, we chose to use the proportion of KAB crashes that occurred under wet pavement conditions.
63
• Curve: a surrogate variable to capture spatial variations in the number of sharp horizontal curves in different counties. Since actual inventory of horizontal curves on the highway network is not available, we chose to use the proportion of KAB crashes that occurred on sharp horizontal curves in each county as a surrogate variable. • Obj: a surrogate variable to represent degree of roadside hazards. The proportion of KAB crashes that ran off roads and hit fixed objects on the roadside is used as a surrogate variable due to similar reason to the first covariate. Refer to Chapter III or Miaou et al. (2003) for more detail background and description of the data. The interaction terms between covariates are involved in the model. In additional, note that two of the urban counties and on rural county were removed from the analysis for having no rural two-lane roads with the level of traffic volume of interest, i.e., fewer than 2,000 vehicles per day on average. Let Yij be the number of jth type of reported KAB crashes in county i, i = 1, · · · , n(= 251), j = 1, · · · , q(= 4). At the first level of hierarchy, conditional on mean µij , Yij are assumed to be mutually independent and Poisson distributed as Yij ∼ Poisson(µij ).
(4.10)
The mean of the Poisson is modeled µij = νij λij
(4.11)
where νij is an offset (in million of vehicle-miles traveled, or MVMT) and λij is the KAB crash rate. Since the rate has to be nonnegative, it is structured as θij = log(µij ) = log(λij ) + log(νij ) = log(νij ) + xTi β j + ηij + eij ,
(4.12)
64
where xi is covariates, β j is regression coefficient vector, ηij is spatial random effect, and eij is exchangeable random effect. For simplicity of notation, we can rewrite the expression as θ i = X i β + η i + ei ,
(4.13)
where X i = I q ⊗ xTi , β = (β T1 , · · · , β Tq )T , and xTi is a p × 1 row vector for county i. θ i ’s can be expressed as a N (= n × q) × 1 column matrix θ = (θ T1 , · · · , θ Tn )T and the model is given by θ = Xβ + η + e,
(4.14)
where X T = (X T1 , · · · , X Tn )T , η = (η T1 , · · · , η Tn )T , and e = (eT1 , · · · , eTn )T . Prior distributions of all parameters in the model are specified as those in previous section and four types of spatial priors for multivariate models are considered in this analysis. Posterior propriety for each proposed spatial prior is ensured through the theorems with the integrability of the likelihood. Let θij = log(µij ) and ψ(θij ) = exp(θij ). Then, the integral in the theorems is replaced by Z
∞ 0
y −1
ξijij
exp(−ξij )dξij < ∞,
which hold when yij = 1, 2, · · · . Therefore, all proposed theorems hold for poisson models with additional requirement yij = 1, 2, · · · . As mentioned earlier, posterior inference is carried out by MCMC and Gibb sampler is implemented for most of the parameters whose full conditionals are available in closed form. The rest of them are sampled using Metropolis-Hastings algorithm. It is only necessary to replace exponential family by poisson density in the full conditionals and note that sampling step for θ is only depend on likelihood function. Hyperparameters which are satisfied with the conditions suggested in the theorems
65
Table 3: DIC and pD Values for Various Multivariate Spatial Models: Model 1=Model with Same Spatial Effect. Model 2=Model with Independent CAR. Model 3=Model with Correlated CAR. Model 4=Model with Multivariate CAR and Different Choices of α. PD DIC Model 1 516.8 1480.3 Model 2 481.1 1399.6 Model 3 455.0 1385.2 Model 4 (with fixed α=1) 462.8 1391.0 Model 4 (with single, unknown α) 459.6755 1391.2 Model 4 (with multiple, unknown α) 457.5247 1385.9 are specified. We have used all of our models to fit the data and made model comparison based on the DIC values have been presented in the Table 3. It is clear that correlated CAR and multivariate CAR with unknown α is performing well. We will present other results based on the correlated CAR model. We plot the posterior distribution of the regression parameters corresponding to the covariates and their interactions for each of the responses in Figures 11, 12, 13 and 14. From Figure 11 it is clear that the covariates curve and obj has significant effect on intersection crashes. Also the intersection between wet-curve and curve-obj is significant. From Figures 12 and 13, we reach to the similar conclusion for intersection related crashes and driveway crashes. For the non-intersection crashes the main significant variables remain same except this time the covariate obj assign significant mass towards 0 from Figure 14. Altogether the covariate wet is not significant for all the responses but the other two covariates curve and obj and their interactions have significant effect. We have also plotted the posterior distributions of the correlation of the spatial scale parameters ρ in Figure 15. All of the parameters have significant positive correlations which is expected. Higher correlation has been seen among intersec-
66
tion, intersection related and driveway crashes. All these responses have lower but significant positive correlation with non-intersection crash. The predicted maps based on our model is presented in Figure 16. Form the map it is clear that east Texas has higher crash risk than the west. By further investigation we found the high risk sites for each type of crashes are rural areas near to the big cities like Dallas, Austin, San Antonio, and Fort Worth. Limited by the rolling terrain in the eastern counties, roadways in rural area tend to have less driverfriendly characteristics with, e.g., more horizontal and vertical curves, restricted sightdistance, and less forgiving roadside development (e.g. tree closer to the travelway and steeper side-slopes). In additional, with more and larger urbanized areas in the ease, rural roads tend to have higher roadside development scores, higher access density, and narrow lanes and/or shoulder(Fitzpatrick et al. 2002).
67
(a)
(b)
3000
3000
2000
2000
1000
1000
0 −0.2
−0.1
0
0.1
0.2
0.3
0 −0.1
0
0.1 (d)
0.2
0.3
−0.04
−0.02 (f)
0
0.02
−0.03
−0.02
−0.01
0
(c) 4000
3000
3000
2000
2000 1000
1000 0 −0.3
−0.2
−0.1 (e)
0
0.1
4000
0 −0.06 3000
3000
2000
2000 1000
1000 0 −0.06 −0.04 −0.02
0
0.02
0.04
0 −0.04
Figure 11: Plot of the Posterior Distributions of the Covariates for Interaction Crash. Regression Parameters Corresponding to (a) Wet, (b) Curve, (c) Obj, and the Interactions (d) Wet.Curve, (e) Wet.Obj, (f) Curve.Obj.
68
(a)
(b)
3000
4000 3000
2000
2000 1000 0 −0.2
1000 0
0.2 (c)
0.4
0.6
0 −0.1
4000
4000
3000
3000
2000
2000
1000
1000
0 −0.3
−0.2
−0.1 (e)
0
0.1
4000
0 −0.08
0
0.1 (d)
0.2
0.3
−0.06
−0.04 (f)
−0.02
0
3000
3000
2000
2000 1000
1000 0 −0.1
−0.05
0
0.05
0.1
0 −0.04 −0.03 −0.02 −0.01
0
0.01
Figure 12: Plot of the Posterior Distributions of the Covariates for Interaction-Related Crash. Regression Parameters Corresponding to (a) Wet, (b) Curve, (c) Obj, and the Interactions (d) Wet.Curve, (e) Wet.Obj, (f) Curve.Obj.
69
(a)
(b)
4000
4000
3000
3000
2000
2000
1000
1000
0 −0.4
−0.2
0 (c)
0.2
0.4
0 −0.1 4000
3000
3000
2000
2000
1000
1000 −0.3
−0.2
−0.1 (e)
0.1
0.2
0.3
0.4
(d)
4000
0 −0.4
0
0
0.1
4000
0 −0.1
−0.05
0 (f)
0.05
0.1
3000
3000
2000
2000 1000
1000 0 −0.1
−0.05
0
0.05
0.1
0 −0.05 −0.04 −0.03 −0.02 −0.01
0
Figure 13: Plot of the Posterior Distributions of the Covariates for Driveway Crash. Regression Parameters Corresponding to (a) Wet, (b) Curve, (c) Obj, and the Interactions d) Wet.Curve, (e) Wet.Obj, (f) Curve.Obj.
70
(a)
(b)
3000
3000
2000
2000
1000
1000
0 −0.2
−0.1
0 (c)
0.1
0.2
0
4000
4000
3000
3000
2000
2000
1000
1000
0 −0.1
−0.05
0 (e)
0.05
0.1
4000 3000
0
0.05
0.1 (d)
0.15
0.2
0
0.01
0 −0.04 −0.03 −0.02 −0.01 (f) 3000 2000
2000 1000
1000 0 −0.04
−0.02
0
0.02
0.04
0 −15
−10
−5
0
5 −3
x 10
Figure 14: Plot of the Posterior Distributions of the Covariates for Non-Interaction Crash. Regression Parameters Corresponding to (a) Wet, (b) Curve, (c) Obj, and the Interactions d) Wet.Curve, (e) Wet.Obj, (f) Curve.Obj.
71
(a)
(b)
3000
3000
2000
2000
1000
1000
0
0
0.2
0.4
0.6
0.8
1
0 −0.2
0
0.2
(c) 3000
2000
2000
1000
1000
0
0.2
0.4 (e)
0.6
0.8
0 3000
2000
2000
1000
1000
0
0.2
0.4
0.8
0
0.2
0.4
0.6
0.8
1
(f)
3000
0
0.6
(d)
3000
0
0.4
0.6
0.8
0
0
0.2
0.4
0.6
0.8
Figure 15: Plot of the Posterior Distributions of the Correlation Coefficients between the Responses. Correlation Coefficients Corresponding to (a) Intersection and Intersection-Related, (b) Intersection vs Driveway Access, (c) Intersection vs NonIntersection, d) Intersection-Related vs Driveway Access, (e) Intersection-Related vs Non-Intersection, (f) Driveway Access vs Non-Intersection.
72
0.26371 −0.62440
0.17571 −0.31590
0.15531 −0.26370
0.12031 −0.17570
0.10331 −0.15530
0.07771 −0.12030
0.06681 −0.10330
0.04561 −0.07770
0.03301 −0.06680
0.02071 −0.04560
0.00130 −0.03300
0.00060 −0.02070
Intersection Accident
Intersection-related Accident
0.12771 −0.23660
0.72741 −1.79980
0.07331 −0.12770
0.43901 −0.72740
0.04001 −0.07330
0.31551 −0.43900
0.02211 −0.04000
0.21551 −0.31550
0.00921 −0.02210
0.12301 −0.21550
0.00010 −0.00920
0.02770 −0.12300
Driveway Access Accident
Non-Intersection Accident
Figure 16: Predicted Map for Different Types of Crash.
73
CHAPTER V
CONCLUSIONS
We explored possible hierarchical spatial models in multivariate data. As preliminary study, Texas crash data is analyzed with univariate spatial models and it is also considered for the illustration of multivariate spatial models. The sufficient conditions to ensure posterior propriety using vague flat prior on regression parameter are obtained. The best model in terms of DIC is suggested in univariate spatial model framework and estimated crash risk map is also shown with the selected model. It substantially supports that there is spatial pattern in Texas crash data and spatial effect is significant. The development of models and risk maps for traffic crash on road network is suggested as an extension of the study in discussion of Chapter III. It is also an interesting topic to apply statistical ranking criteria to identify sites on a road network for further engineering inspection and safety improvement. A future study in transportation application can be to explore some of the issues raised regarding ranking methodology in light of the recent statistical development in spatiotemporal generalized linear mixed models. We proposed the extension of univariate CAR model to multivariate setup. DIC is also selected for model comparison and it suggests that correlated CAR and multivariate CAR with unknown α outperform than the other models. Based on the estimated crash rate, crash risk maps are generated with four types of crashes. Some studies on multivariate spatial models have been conducted, but posterior propriety is not considered. As indicated earlier, the propriety is always not guaranteed under improper priors and it should be considered as an important step
74
in MCMC. The proper joint posterior distribution corresponding to each proposed multivariate spatial prior is ensured by the theorem and the detail proofs are in Appendices. In contrast to the models in Chapter III, only spatial random effects are included in the proposed models. It is potentially useful to add time effect and to investigate time trend in data when data are observed over certain time period.
75
REFERENCES
Banerjee, S., Carlin, B., and Gelfand, A. (2004). Hierarchical Modeling and Analysis for Spatial Data. Boca Raton: Chapman & Hall/CRC. Besag, J. (1974). “Spatial Interaction and the Statistical Analysis of Lattice Systems (with Discussion).” Journal of the Royal Statistical Society, Ser. B, 36, 192–236. — (1975). “Statistical Analysis of Non-Lattice Data.” Statistician, 24, 179–195. Bonneson, J. and McCoy, P. (1996). “Effect of Median Treatment on Urban Arterial Safety: An Accident Prediction Model.” In 72nd Annual Meeting of the Transportation Research Board . National Research Council, Washington, DC. Carlin, B. and Banerjee, S. (2003). “Hierarchical Multivariate CAR Models for Spatio-Temporally Correlated Survival Data.” in Bayesian Statistics 7, eds. J. M. Bernardo, M. J. Bayarri, J. O. Berger, A. P. Dawid, D. Heckerman, A. F. M. Smith and M. West. Oxford: Oxford Univeristy Press. Carlin, B. and Louis, T. (1996). Bayes and Empirical Bayes Mehtods for Data Analysis. London: Chapman and Hall/CRC. Chen, M.-H., Ibrahim, J., Shao, Q.-M., and Weiss, R. (2003). “Prior Elicitation for Model Selection and Estimation in Generalized Linear Mixed Models.” Journal of Statistical Planning and Inference, 111, 57–76. Chen, M.-H., Shao, Q.-M., and Xu, D. (2002). “Necessary and Sufficient Conditions on the Properiety of Posterior Distributions for Generalized Linear Mixed Models.” Sankhya, 64, 57–85.
76
Christiansen, C., Morris, C., and Pendleton, O. (1992). “Hierarchical Poisson Model with Beta Adjustments for Traffic Accident Analysis.” Technical Report, Center for Statistical Sciences, University of Texas at Austin. Coster, J. (1987). “Literature Survey of Investigations Performed to Determine the Skid Resistance/Accident Relationship.” Technical Report RP/37, National Institute for Transport and Road Research, South Africa. Cressie, N. (1986). “Kriging Nonstationary Data.” Journal of the American Statistical Association, 81, 625–634. — (1993). Statistics for Spatial Data. New York: Wiley. Dey, D., Ghosh, S., and Mallick, B. (2000). Bayesian Generalized Linear Model . New York: Marcel Dekker. Diggle, P. (1993). Statistical Analysis of Spatial Point Patterns. New York: Academic Press. Duncan, C., Khattak, A., and Council, F. (1998). “Applying the Ordered Probit Model to Injury Severity in Truck-Passenger Car Rear-End Collisions.” Transportation Research Record , 1635, 63–71. Fitzpatrick, K., Parham, A., Brewer, M., and Miaou, S. (2001). “Characteristics of and Potential Treatments for Crashes on Low-Volume, Rural Two-Lane Highways in Texas.” Technical Report, Texas Transportation Institute, College Station, TX. Flowers, R. and Griffin, L. (1992). “Development of a Plan for Identifying Highway Locations That May Be Over Represented in Accident Frequency and/or Severity.” Technical Report, Texas Transportation Institute, College Station, TX.
77
Gelfand, A. and Vounatsou, P. (2003). “Proper Multivariate Conditional Autogressive Models for Spatial Data Analysis.” Biostatistics, 4, 11–25. Geman, S. and Geman, D. (1984). “Stochastic Relaxation Gibbs Distributions and the Bayesian Restoration of Image.” IEEE Transactions of Pattern Analysis and Machine Intelligence, 6, 721–741. Getis, A. and Boots, B. (1978). Models of Spatial Processes. Cambridge: Cambridge University Press. Ghosh, M., Natarajan, K., Stroud, T., and Carlin, B. (1998). “Generalized Linear Models for Small Area Estimation.” Journal of the American Statistical Association, 96, 273–282. Ghosh, M., Natarajan, K., Waller, L., and Kim, D. (1999). “Hierarchical Bayes for the Analysis of Spatial Data: An Application to Disease Mapping.” Journal of Statistical Planning and Inference, 75, 305–318. Ghosh, M. and Rao, J. (1994). “Small Area Estimation: An Appraisal.” Statistical Science, 9, 55–76. Gilks, W., Richardson, S., and Spiegelhalter, D. (1996). Markov Chain Monte Carlo in Practice. London: Chapman and Hall. Gilks, W. and Wild, P. (1992). “Adaptive Rejection Sampling for Gibbs Sampling.” Applied Statistics, 41, 337–348. Goldstein, H. (1999). Multilevel Statistical Models, 1st Internet edition. Available at http://www.ioe.ac.uk/multilevel/.
78
Green, P. and Richardson, S. (2001). “Hidden Markov Models and Disease Mapping.” Working paper, Department of Mathematics, University of Bristol, United Kingdom. Griffin, L., Pendleton, O., and Morris, D. (1998). “An Evaluation of the Safety Consequences of Raising the Speed Limit on Texas Highways to 70 Miles per Hour.” Technical Report, Texas Transportation Institute, College Station, TX. Hauer, E. (1992). “Empirical Bayes Approach to the Estimation of Unsafety: The Multivariate Regression Approach.” Accident Analysis & Prevention, 24, 456–478. Henry, J. (2000). “Design and Testing of Pavement Friction Characteristics.” NCHRP Project 20-5, Synthesis of Highway Practice, Topic 30-11. Washington, DC: Transportation Research Board. Hobert, J. and Casella, G. (1996). “The Effect of Improper Priors on Gibbs Sampling in Hierarchical Linear Mixed Models.” Journal of the American Statistical Association, 91, 1461–1473. Ibrahim, J. and Laud, W. (1991). “On Bayesian Analysis of Generalized Linear Models Using Jeffrey’s Prior.” Journal of the American Statistical Association, 86, 981–986. Ivey, D. and Griffin, L. (1990). “Proposed Program to Reduce Skid Initiated Accidents in Texas.” Technical Report, Texas Transportation Institute, College Station, TX. Jin, X., Carlin, B., and Banerjee, S. (2004). “Generalized Hierarchical Multivariate CAR Models for Areal Data.” Research Report 04-001, University of Minnesota, Division of Biostatistics,.
79
Journel, A. (1983). “Non-Parametric Estimation of Spatial Distributions.” Journal of the International Association for Mathematical Geology, 15, 445–468. Kim, H., Sun, D., and Tsutakawa, R. (2001). “A Bivariate Bayes Methods for Improving the Estimates of Mortality Rates with a Twofold Conditional Autoregressive Model.” Journal of the American Statistical Association, 96, 1506–1521. Kitanidis, P. (1983). “Statistical Estimation of Polynomial Generalized Covariance Functions and Hydrologic Applications.” Water Resources Research, 19, 909–921. Kitanidis, P. and Lane, R. (1985). “Maximum Likelihood Parameter Estimation of Hydrologic Spatial Processes by the Gauss-Newton Method.” Journal of Hydrology, 79, 53–71. Knorr-Held, L. and Besag, J. (1998). “Modelling Risk from a Disease in Time and Space.” Statistics in Medicine, 17, 2045–2060. Knorr-Held, L. and Best, N. G. (2000). “A Shared Component Model for Detecting Joint and Selective Clustering of Two Diseases.” Journal of the Royal Statistical Society, Ser. A, 164, 73–85. Laslett, G. (1994). “Kriging and Splines: An Empirical Comparison of Their Predictive Performance in Some Applications.” Journal of the American Statistical Association, 89, 391–409. Lawson, A. (2000). “Cluster Modelling of Disease Incidence via RJMCMC Methods:A Comparative Evaluation.” Statistics in Medicine, 19, 2361–2375. — (2001). “Tutorial in Biostatistics: Disease Map Reconstruction.” Statistics in Medicine, 20, 2183–2204.
80
Lawson, A., Biggeri, A., Bohning, D., Lessafre, E., Viel, J., and R., B. (1999). Disease Mapping and Risk Assessment for Public Health. Chichester, UK: Wiley. Maher, M. J. and Summersgill, L. (1996). “A Comprehensive Methodology for the Fitting of Predictive Accident Models.” Accident Analysis & Prevention, 28, 281– 296. Mardia, K. and Marshall, R. (1984). “Maximum Likelihood Estimation of Models for Residual Covariance in Spatial Regression.” Biometrika, 71, 135–146. Mardia, K. V. (1988). “Multi-Dimensional Multivariate Gaussian Markov Random Fields with Application to Image Processing.” Journal of Multivariate Analysis, 24, 265–284. Marquiss, M., Newton, I., and Radcliffe, D. (1978). “The Decline of the Raven, Corvus corax, in Relation to Afforestation in Southern Scotland and Northern England.” Journal of Applied Ecology, 15, 129–144. McGinnis, R., Wissinger, L., Kelly, R., and Acuna, C. (1998). “Estimating the Influence of Driver, Highway, and Environmental Factors on Run-off-Road Crashes Using Logistic Regression.” In Transportation Research Board 78th Annual Meeting. National Research Council, Washington, DC. Miaou, S.-P. (1994). “The Relationship Between Truck Accidents and Geometric Design of Road Sections: Poisson versus Negative Binomial Regressions.” Accident Analysis & Prevention, 26, 471–482. — (1996). “Measuring the Goodness-of-Fit of Accident Prediction Models.” FHWARD-96-040, Federal Highway Administration, U.S. Department of Transportation.
81
Miaou, S.-P., Hu, P., Wright, T., Rathi, A., and Davis, S. (1992). “Relationship Between Truck Accidents and Geometric Design: A Poisson Regression Approach.” Transportation Research Record , 1376, 10–18. Miaou, S.-P. and Lum, H. (1993). “Modeling Vehicle Accidents and Highway Geometric Design Relationships.” Accident Analysis & Prevention, 28, 689–709. Miaou, S.-P., Song, J., and Mallick, B. (2003). “Roadway Traffic Crash Mapping: A Space-Time Modeling Approach.” Journal of Transportation and Statistics, 6, 33–58. Morris, C., Christiansen, C., and Pendleton, O. (1991). “Application of New Accident Analysis Methodologies, Volume III: Theoretical Development.” FHWA-RD-91015, Federal Highway Administration, U.S. Department of Transportation. National Safety Council (NSC) (2002). Report on Injuries in America, 2001 . Available at http://www.nsc.org/library/rept2000.htm, as of July 2003. Pielou, E. (1959). “The Use of Point-to-Plant Distances in the Pattern of Plant Populations.” Journal of Ecology, 47, 607–613. — (1977). Mathematical Ecology. New York: Wiley. Ripley, B. (1981). Spatial Statistics. New York: Wiley. Robert, C. and Casella, G. (1999). Monte Carlo Statistical Methods. New York: Springer-Verlag. Roberts, G. and Rosenthal, J. (1998). “Markov Chain Monte Carlo: Some Practical Implications of Theorectical Results.” Canadian Journal of Statistics, 26, 5–31.
82
Sampson, P. and Guttorp, P. (1992). “Non-Parametric Estimation of Nonstationary Spatial Covariance Structure.” Journal of the American Statistical Association, 87, 108–119. Shankar, V., Milton, J., and Mannering, F. (1997). “Modeling Statewide Accident Frequencies as Zero-Inflated Probability Processes: An Empirical Inquiry.” Accident Analysis & Prevention, 29, 829–837. Smith, R., Harkey, D., and Harris, B. (2001). “Implementation of GIS-Based Highway Safety Analyses: Bridging the Gap.” FHWA-RD-01-039. Prepared for the Federal Highway Administration, U.S. Department of Transportation. Spiegelhalter, D., Best, N., and Carlin, B. (1998). “Bayesian Deviance, the Effective Number of Parameters, and the Comparison of Arbitrarily Complex Models.” Tech. 98-009. Division of Biostatistics, Univeristy of Minnesota. Spiegelhalter, D., Best, N., Carlin, B., and Linde, A. (2002). “Baeysian Measure of Model Complexity and Fit.” Journal of the Royal Statistical Society, Ser. B, 64, 1–34. Spielgelhalter, D., Thomas, A., and Best, N. (2000). WinBUGS Version 1.3 User Manual . Cambridge, UK: MRC Biostatistics Unit. Sun, D., Tsutakawa, R., and He, Z. (2001). “Propriety of Posteriors with Improper Priors in Hierarchical Linear Mixed Models.” Statistica Sinica, 11, 77–95. Sun, D., Tsutakawa, R., Kim, H., and He, Z. (2000). “Spatio-Temporal Interaction with Disease Mapping.” Statistics in Medicine, 19, 2015–2035. Transportation Research Board (TRB) (1987). “Designing Safer Roads: Practices
83
for Resurfacing, Restoration, and Rehabilitation.” Special Report 214, National Research Council, Washington, D.C. Upton, G. and Fingleton, B. (1985). Spatial Data Analysis by Example, Vol. 1: Point Pattern and Quantitative Data. Chichester:Wiley. U.S. Department of Transportation (USDOT) (2002). Safety in Numbers Conferences. Available at http://www.bts.gov/sdi/conferences, as of August 2003. U.S. Department of Transportation (USDOT), Bureau of Transportation Statistics (BTS) (1996-1999). “Transportation Statistics Annual Report.” Washington, D.C. Vogt, A. and Bared, J. (1998). “Accident Models for Two-Lane Rural Roads: Segments and Intersections.” FHWA-RD-98-133, Office of Safety and Traffic Operations R&D, Federal Highway Administration, U.S. Department of Transportation. Whittle, O. (1954). “On Stationary Processes in the Plane.” Biomerika, 41, 434–449. Xia, H., Carlin, B., and Waller, L. (1997). “Hierarchical Models for Mapping Ohio Lung Cancer Rates.” Environmetrics, 8, 107–120. Yang, M., Rasbash, J., Goldstein, H., and Barbosa, M. (1999). MLwiN Macros for Advanced Maltilevel Modeling, Version 2.0: Multilevel Models Project. Institute of Education, University of London. Zhu, L. and Carlin, B. (1999). “Comparing Hierarchical Models for Spatio-Temporally Misaligned Data Using the DIC Criterion.” Research Report 99-006, University of Minnesota, Division of Biostatistics,.
84
APPENDIX A
PROOF OF THEOREM 1
Let zi = ηi − ηn (i = 1, · · · , n − 1) and zn = 0. Then, the transformed posterior is π(θ, β, z, ηn , Σe , rη |y) ∝
Y i,j
× × × ×
p(yij |θij )
) n 1X (ci − ηn 1q )T Σ−1 exp − e (ci − ηn 1q ) 2 i=1 ( ) rη X exp − wil (zi − zl )2 rηn/2 2 1≤i 0) is a generic constant. Next integrating with respect to β, π(θ, z, Σe , rη |y) ≤ K
Y i,j
−1/2 p(yij |θij )(1Tq Σ−1 |Σβ |1/2 e 1q )
#
86 "
n
1X ¯ ∗ }T Σ−1 {g i − (X i − X)β ¯ ∗} × exp − {g − (X i − X)β e 2 i=1 i
#
"
( )# X rη × exp − a+ wil (zi − zl )2 rη((n+b)/2)−1 2 1≤i 0) for a generic constant which does not depend on any unknown parameters, π(θ, Σe , α, Λ|y) ≤ K ×
Y
p(yij |θij )
i,j |Σe |−(n+γ+q+1)/2 |I n
−1 −1/2 ⊗ Σ−1 | |X T CX|−1/2 e +V
# 1 −1 exp − tr(Σe A) 2 "
× |D − αW |
q/2
α
c−1
d−1
(1 − α)
94
# 1 × |Λ|(n+s−q−1)/2 exp − tr(ΛB) . 2 "
−1 −1/2 But, |I n ⊗ Σ−1 | ≤ |V −1 |−1/2 = |V |1/2 = |D − αW |−q/2 |Λ|−n/2 . Thus, e +V
π(θ, Σe , α, Λ|y) ≤ K ×
Y
p(yij |θij )
i,j |Σe |−(n+γ+q+1)/2 |X T CX|−1/2
"
# 1 × αc−1 (1 − α)d−1 exp − tr(Σ−1 e A) 2 "
# 1 × |Λ|(s−q−1)/2 exp − tr(ΛB) . 2 The rest of the proof is the same as in previous sections.
95
VITA Joon Jin Song, son of Jong-Chool Song and Nam-Soon Lee, was born on June 1, 1974 in Kimchon, Korea. He graduated from Kimchon High School in Kimchon, Korea in 1992. He received a Bachelor of Science degree in statistics from Yeungnam University in Kyungsan, Korea in 1997. He received a Master of Science degree in statistics from Kyungpook National University in Daegu, Korea under the direction of Professor Joong Kweon Sohn in 1999. He continued to study statistics under the direction of Professor Bani K. Mallick, and received a Doctor of Philosophy degree in statistics from Texas A&M University in August 2004. Joon Jin Song is married to Wonjeong Kim. His permanent address is: 331-4 Bugok-Dong, Kimchon Kyungpook, Korea