Theor Appl Climatol DOI 10.1007/s00704-015-1463-5
ORIGINAL PAPER
Best convective parameterization scheme within RegCM4 to downscale CMIP5 multi-model data for the CORDEX-MENA/Arab domain Mansour Almazroui 1 & Md. Nazrul Islam 1 & A. K. Al-Khalaf 1 & Fahad Saeed 1,2
Received: 5 February 2015 / Accepted: 7 April 2015 # The Author(s) 2015. This article is published with open access at Springerlink.com
Abstract A suitable convective parameterization scheme within Regional Climate Model version 4.3.4 (RegCM4) developed by the Abdus Salam International Centre for Theoretical Physics, Trieste, Italy, is investigated through 12 sensitivity runs for the period 2000–2010. RegCM4 is driven with European Centre for Medium-Range Weather Forecasts (ECMWF) ERA-Interim 6-hourly boundary condition fields for the CORDEX-MENA/Arab domain. Besides ERAInterim lateral boundary conditions data, the Climatic Research Unit (CRU) data is also used to assess the performance of RegCM4. Different statistical measures are taken into consideration in assessing model performance for 11 sub-domains throughout the analysis domain, out of which 7 (4) sub-domains give drier (wetter) conditions for the area of interest. There is no common best option for the simulation of both rainfall and temperature (with lowest bias); however, one option each for temperature and rainfall has been found to be superior among the 12 options investigated in this study. These best options for the two variables vary from region to region as well. Overall, RegCM4 simulates large pressure and water vapor values along with lower wind speeds compared to the driving fields, which are the key sources of bias in simulating rainfall and temperature. Based on the climatic characteristics of most of the Arab countries located within the study domain, the drier sub-domains are given priority in the selection of a suitable convective scheme, albeit with a compromise for both rainfall and temperature simulations. The most * Mansour Almazroui
[email protected] 1
Center of Excellence for Climate Change Research/Department of Meteorology, King Abdulaziz University, Jeddah, Saudi Arabia
2
Sustainable Development Policy Institute, Islamabad, Pakistan
suitable option Grell over Land and Emanuel over Ocean in wet (GLEO wet) delivers a rainfall wet bias of 2.96 % and a temperature cold bias of 0.26 °C, compared to CRU data. An ensemble derived from all 12 runs provides unsatisfactory results for rainfall (28.92 %) and temperature (−0.54 °C) bias in the drier region because some options highly overestimate rainfall (reaching up to 200 %) and underestimate temperature (reaching up to −1.16 °C). Overall, a suitable option (GLEO wet) is recommended for downscaling the Coupled Model Intercomparison Project Phase 5 (CMIP5) multi-model database using RegCM4 for the CORDEX-MENA/Arab domain for its use in future climate change impact studies.
1 Introduction The employment of a regional climate model (RCM) is invaluable for its capabilities in capturing the local climate in detail, which is essential in assessing the impacts of climate change at national and regional levels. One such activity in employing different RCMs, in order to produce a multiple member ensemble of downscaled data of Coupled Model Intercomparison Project Phase 5 (CMIP5) archives, was initiated by the World Climate Research Program (WCRP) through a coordinated effort with the international regional downscaling community. The initiative taken by WCRP is named the COordinated Regional climate Downscaling EXperiment (CORDEX) (http://www.meteo.unican.es/en/ projects/CORDEX) with the aim to generate regional climate change projections as inputs for impact and adaptation studies. Meanwhile, a joint regional initiative of the Arab League and the United Nations called Regional Initiative for the assessment of climate change impacts on water resources and socioeconomic vulnerability in the Arab Region (RICCAR) was working on recognizing the
M. Almazroui et al.
vulnerability of the Arab region to climate change. Because of the commonality in various goals of both the initiatives, RICC AR joined the regional climate modeling activity of CORDEX. Afterwards, it was decided to conduct further activities in downscaling the CMIP5 database using an RCM as per CORDEX protocols. In this connection, among various others RCMs, the International Centre for Theoretical Physics, Trieste, Italy’s REGional Climate Model version 4. 3.4 (RegCM4; Giorgi et al. 2012) was considered as a better option due to its good performance over different domains around the globe. It is worth mentioning here that RegCM4 has been used in climate downscaling over many regions of the world, such as in Africa (Anyah and Semazzi 2007), Asia (Dash et al. 2006; Rahman et al. 2007a, b), Europe (Cossarini et al. 2008; Salon et al. 2008), the Middle East (Almazroui 2012; Islam and Almazroui 2012; Artale et al. 2010), and the USA (O'Brien et al. 2012; Chen et al. 2003). For the application of a RCM over a new region, along with the selection of an appropriate domain, the key challenge is the selection of suitable set of parameterization schemes. In RegCM4, there are multiple options for convective and land surface schemes available; hence, it becomes a matter of extremely importance to select best suite among them. Recently, Almazroui (2015) assessed the suitability of the CORDEX domains for climate simulation using RegCM4 for the Arab countries. He discussed the limitations of the different CORDEX domains because none of them covers the large-scale circulation patterns from the Mediterranean Sea to Indian Ocean particularly well which control the climate of the Arab countries. Accordingly, he suggested a new CORDEX-MENA/Arab domain (27°W–76°E, 7°S– 45°N) with the BATS land scheme within RegCM4. He also emphasized for a detail analysis in selection of suitable convective parameterization scheme available in RegCM4. Therefore, for the application of a model in the new CORDEX-MENA/Arab domain, the selection of best convective parameterization scheme within RegCM4 becomes a high-priority issue, one that is vital for downscaling the climate scenarios. The key question is why we need to downscale CMIP5 datasets. In general, downscaling is the process of translating climate projections from coarse resolutions (typical of GCMs) to finer resolutions, i.e., those that are suitable for assessing impacts using various methods (Brown et al. 2008). It is well known that the skill of GCM projections (in terms of rainfall and temperature) generally decreases along with the spatial and temporal scales under consideration. However, GCMs have more skill over the continental scale. In any given area, the climate response pattern generally depends substantially on the atmospheric circulation patterns, and the distribution of rainfall and temperature depends on this local climate (Islam et al. 2007). In elaborating this local climate, downscaling the
GCM outputs is essential for delivering finer detail vis-àvis the patterns of the climatic variables; this is particularly useful in application-oriented tasks. Resolution in the CMIP5 GCMs is typically of the order of 1–2° (lat/long). However, GCMs cannot be considered reliable on the scale of individual grid boxes, which constrains the utility of these model outputs in climate change impact studies. Therefore, we need to downscale to finer-scale climate scenarios, which are applicable in vulnerability and adaptation studies at the national level. This can be done by dynamical downscaling using an RCM that transforms the GCM outputs into a finer resolution; this is an accepted procedure (Giorgi and Hewitson 2001; Jones et al. 2004; Pal et al. 2007). Importantly, downscaling is partly dependent on the ability of GCMs to successfully project the climate change signal; therefore, any downscaling performance by an RCM is influenced by the GCM signals (Almazroui 2011). Prior to downscaling the CMIP5 projections, the level of realism as well as understanding the biases in the present climate is important. The biases among the convective parameterization schemes within RegCM4 must be investigated and validated against reference datasets. Once confidence in the present datasets is gained, particularly in terms of climate mean and the variability of rainfall and temperature, the same criteria in RegCM4 can be applied for downscaling the future climate. As mentioned earlier, Almazroui (2015) suggested the new domain and mentioned the best land surface scheme within RegCM4 in the simulation of rainfall and temperature for the Arab countries. This paper identifies the best convective parameterization scheme within RegCM4 to downscale CMIP5 data for the present climate in the CORDEX-MENA/Arab domain as preparation for downscaling the projections.
2 Data and methodology 2.1 Model description and experiment setup In RegCM4, there are four options for representing cumulus convection, which are (i) the simplified version of the Kuotype scheme of Anthes (1977), as described by Anthes et al. (1987); (ii) the most used scheme called Grell (1993) in the implementation of Giorgi et al. (1993); (iii) the MIT scheme (EMAN; Emanuel 1991; Emanuel and Živković-Rothman 1999); and (iv) a mixed convection scheme that has the capability of running different convection schemes over land and ocean (Giorgi et al. 2012). The Grell scheme has two different closures, viz: an Arakawa and Schubert (1974) type closure (GAS) and a Fritsch and Chappell (1980) type closure (GFC).
Best convective parameterization scheme within RegCM4
The mixed convection preliminary tests conducted over the CORDEX framework suggested that the Grell scheme over land and the EMAN scheme over the oceans (GLEO) might be the most suitable option to pursue (Giorgi et al. 2012). In RegCM4, the radiative transfer scheme follows the global model CCM3 (Kiehl et al. 1996), the planetary boundary layer (PBL) processes follow the modified Holtslag et al. (1990) and the University of Washington’s scheme (Grenier and Bretherton 2001; Bretherton et al. 2004), the land surface process follows the biosphere-atmosphere transfer scheme (BATS) of Dickinson et al. (1993) and the Community Land Model version CLM3.5 (Tawfik and Steiner 2011), and the prognostic sea surface temperatures (SST) scheme is as described by Zeng et al. (1998). Details of the RegCM4 model physics can be seen in Giorgi et al. (2012). In order to find the best convective parameterization scheme within RegCM4, we have conducted 12 sensitivity experiments in the CORDEX-MENA/Arab domain (27°W–76°E and 7°S–45°N) with 50-km domain resolution. RegCM4 was driven with 0.75° resolution ERAInterim (hereafter referred to ERA-Int) boundary conditions (Simmons et al. 2006) obtained from the European C e n t r e f o r M e d i u m - r a n g e We a t h e r F o r e c a s t i n g (ECMWF) website for the period 2000–2010 (2000 is the spin-up year). A 10-year simulation is acceptable because for many climatic parameters, shorter averaging periods such as 10 years often perform as adequately as 30-year averaging periods (WMO 2007). The GLEO convective scheme is used to drive RegCM4 in the normal, wet, and dry options. These three options are the threshold-based options within RegCM4 in tuning precipitation simulation for a region. Therefore, three runs are completed for the GLEO scheme. Likewise, the EMAN, GFC, and GAS schemes are employed to
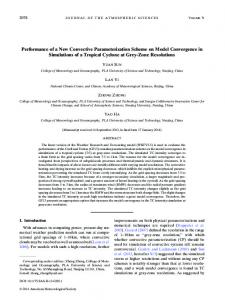
Fig. 1 CORDEX-MENA/Arab domain (26°W–76°E and 7°S– 45°N) with surface elevation (km). There are 11 sub-domains I, II,………XI for objective analysis used later on. Subdomains III, V, VI, and IX composed wetter region and subdomains I, II, IV, VII, VIII, X, and XI composed drier region used later on
complete another nine runs (normal, wet, and dry for each scheme) to fulfill 12 sensitivity experiments. 2.2 Data analysis In evaluating the convective schemes within RegCM4, through objective analysis and following Almazroui (2015), 11 sub-domains (each a 8°×8° box) are considered in different parts of the CORDEX-MENA/Arab domain (see Fig. 1). Almazroui (2015) explained the reasons for selecting the sub-domain locations; together they cover a variety of complex terrains, including the high and low elevations of that domain. Averaging all 11 sub-domains can be considered as representative of the CORDEX-MENA/Arab domain, whereas average of the 4 southern sub-domains (III, V, VI, and IX) and average of the rest of 7 sub-domains (I, II, IV, VII, VIII, X, and XI) represents wetter and drier region, respectively. RegCM4 outputs are transferred to daily, monthly, seasonal, annual, and decadal scales. The ERA-Int driving field is also used to assess the model’s performance. To fully comprehend the reliability of the RegCM4 outputs, CRU data (CRU TS3.21; New et al. 2000; Mitchell and Jones 2005) are considered as a reference. The main climatic parameters (rainfall and temperature) are analyzed in detail. Moreover, other meteorological elements, such as pressure, wind, specific humidity, and evaporation, are also analyzed. Runoff and soil water are also taken into account in assessing the model’s performance. Statistical measures, such as correlation coefficient, bias, root mean square difference, and standard deviation, are employed. Box-whisker plots and Taylor diagrams are also employed in summarizing the statistical measures for the selection of a suitable convective scheme. For easy reference in understanding the rainfall and temperature of the study domain, analyses are performed separately for the wetter region,
M. Almazroui et al. Fig. 2 Annual rainfall (in mm) obtained from ERA-Int driving field (top) and gridded CRU (middle) data with their differences (in mm/day) (bottom). Rainfalls are averaged over the period 2001–2010
Best convective parameterization scheme within RegCM4
Rainfall is one of the utmost important yet most difficult-toestimate climatic parameters in evaluating the simulation of any climate model output because of its huge spatiotemporal variations and varying degrees of uncertainty and bias (Almazroui 2013; Islam 2009). The current analysis domain
is quite large as it covers most parts of Africa, the Mediterranean region, the Middle East, and southwestern parts of Asia. In general, rainfall varies from place to place across the CORDEX-MENA/Arab domain, which is clearly observed in the ERA-Int driving field and in the CRU gridded data (top and middle panel respectively, Fig. 2). For rainfall, there is a large difference in magnitude between the ERA-Int driving field and the CRU datasets; ERA-Int driving rainfall has both wet and dry biases, which reach up to 7 mm/day (surplus) in some regions (bottom panel, Fig. 2). The ERAInt driving field shows a wet bias for all 11 sub-domains, except for more than half of IX, which has a little dry bias with respect to the CRU data. In order to understand the performance of RegCM4 with a specific convective scheme in improving the simulation of rainfall, the ERA-Int data are downscaled by using RegCM4 with different convective scheme options, as displayed in Fig. 3.
Fig. 3 Annual rainfall bias (mm/day) obtained from RegCM4 simulation in different 12 options with respect to CRU data. Rainfall bias is for GLEO (top panels), EMAN (upper middle panels), GAS (lower middle
panels), and GFC (bottom panels). Left, middle, and right columns are for normal, wet, and dry options respectively. Rainfall bias is averaged over the period 2001–2010
the drier region, and the entire domain. Among the studied 12run options and for simplicity in deciding upon the most suitable scheme, priority is given to the rainfall and temperature biases of the drier region because most of the Arab countries in the CORDEX-MENA/Arab domain are situated in this area.
3 Results 3.1 Rainfall climatology
M. Almazroui et al. Fig. 4 Temperature (in °C) obtained from ERA-Int driving forcings (top) and gridded CRU (middle) with their differences (bottom). Temperatures are averaged over the period 2001–2010
Best convective parameterization scheme within RegCM4
Figure 3 displays the distribution of RegCM4-simulated annual rainfall bias with respect to the CRU data. The patterns are similar to the bias of the ERA-Int driving forcings (see Fig. 2). However, variations among the data sources (simulated and driving) are observed in different sub-domains (I to XI, Fig. 1) throughout the domain. Scheme to scheme variations in rainfall simulation by RegCM4 with reference to the CRU data are also noticed. The options in each group of convective schemes (i.e., normal, wet, and dry) for GLEO, EMAN, GFC, and GAS do indeed have similarities, but the scheme to scheme variations are large. The EMAN scheme has a large wet bias over almost the whole of the domain for the normal, wet, and dry options, whereas the other schemes (GLEO, GFC, and GAS) show (overall) a little wet bias, except for a few southern sub-domains of dry bias. Thus, the question arises, which convective scheme, and particularly which
option within RegCM4, is better for downscaling coarseresolution GCM data. To answer this question, the best convective parameterization scheme within RegCM4 is identified through objective analyses in order to recommend it for use in downscaling CMIP5 multi-model data for the CORDEXMENA/Arab domain is discussed in Section 3.3.
Fig. 5 Temperature bias (°C) obtained from RegCM4 simulation in different 12 options with respect to CRU data. Temperature bias is for GLEO (top panels), EMAN (upper middle panels), GAS (lower middle
panels), and GFC (lower panels). Left, middle, and right columns are for normal, wet, and dry options, respectively. Temperatures bias is averaged over the period 2001–2010
3.2 Temperature climatology The temperature climatology averaged over the 10 years indicates that the ERA-Int driving field has a similar pattern to that of the observed CRU data (top and middle panels, respectively, Fig. 4). However, a warm bias is noticed for the Arabian Peninsula and for northern and northwestern Africa, including the Mediterranean region and the Middle East (bottom panel, Fig. 4). A cold bias is observed in most parts of central to
M. Almazroui et al.
southern Africa and a few pockets in the Arabian Peninsula (i.e., sub-domain I) and the Middle East (i.e., sub-domain II). RegCM4-simulated temperature bias (with respect to the CRU data) is similar in pattern to the ERA-Int driving forcings bias, albeit with little variations observed region to region (Fig. 5). Remarkably, the dipole mode of cold (over Saudi Arabia) and warm (over Oman) bias of simulated temperature over the Arabian Peninsula is not observed in the ERA-Int driving field; further investigation needs to be paid to this particular issue. As shown in Fig. 5, differences in the simulation of temperature are visible among different convective scheme as well. For example, sub-domain XI shows a prominent warm bias in all options (normal, wet, and dry) for GLEO and EMAN, which is very small for the case of GFC and GAS. Noticeably, sub-domain VI shows a warm bias for the GLEO and GAS schemes, but the same sub-domain in general shows a cold bias for the EMAN and GFC schemes. Overall, GLEO seems to simulate a slightly warmer temperature than the other schemes. The magnitude of the temperature bias for the entire domain as well as all the sub-domains is discussed in Section 3.3. Fig. 6 Monthly time series of rainfall (top panel) and temperature (bottom panel) data in different RegCM4 options averages from all 11 sub-domains for the period 2001–2010. Ensemble is the average from all 12 options and ERA-Int also displayed with CRU data
3.3 Selection of convective scheme for CORDEX-MENA/Arab domain RegCM4-simulated monthly rainfall for the 12 convective schemes and their averages (Ensemble) is displayed with the CRU data for the period 2001–2010 (Fig. 6a). This interannual monthly variability also represents the annual cycle of rainfall in each year, which shows the biases in detail; however, averages from all 10 years may conceal some information from the monthly values. All the 12 options within RegCM4 more or less follow the observed rainfall (CRU data) patterns of the annual cycle as well as the monthly variability. However, all three EMAN options (normal, wet, and dry) greatly overestimated the rainfall simulation with respect to the observation. In general, the dry options in all the other schemes mostly underestimated the rainfall simulation. On the other hand, the normal and wet options for GLEO, GFC, and GAS follow well the observed and the ERA-Int driving data, although Ensemble seems much closer to the observation.
Best convective parameterization scheme within RegCM4
Fig. 7 Taylor diagram for rainfall (left) and temperature (right) obtained from all simulated options in RegCM4. This diagram summarizes the correlation coefficient, root mean square difference (RMSD), and standard deviation of the model simulation with respect to the CRU
data. The character A, B, C, D, E, F, G, H, I, J, K, L, and M represents GLEO, EMAN, GAS, GFC, GLEO Wet, EMAN Wet, GAS Wet, GFC Wet, GLEO Dry, EMAN Dry, GAS Dry, GFC Dry, and Ensemble, respectively
In the case of temperature simulation by RegCM4, almost all the options follow the annual cycle; however,
underestimations are observed in December–February and June–August for many of the options (Fig. 6b). Careful
Fig. 8 Box-whisker plots for rainfall (top panel) and temperature (bottom panel) for 12 options and their ensemble. The box indicates the lower and upper quartiles (inter-quartile range), and the horizontal line inside the box is the median of the data time series. Whiskers are the two lines outside the box that extend to the highest and lowest data values
M. Almazroui et al. Table 1 Best convective scheme option within RegCM4 at different sub-domains and regions in the CORDEX-MENA/Arab domain Rainfall
Temperature
Scheme
Bias (%)
Scheme
Bias (°C)
I
GLEO
−18.98
EMAN dry
−0.8
II III IV V VI VII VIII IX X XI Wetter Drier All
GAS GLEO wet GFC GLEO wet GFC wet GFC wet EMAN wet GFC GFC wet EMAN GFC dry GLEO GFC wet
1.01 −8.14 −5.85 −3.55 12.02 −7.84 17.43 −12.36 −1.82 18.24 −2.97 −1.63 3.31
GLEO EMAN dry EMAN dry GLEO dry EMAN dry GAS EMAN GLEO dry GFC GAS wet GLEO GLEO dry GLEO dry
−0.66 −0.1 −0.59 −0.3 0.02 −1.01 −0.04 0.01 0.01 0.24 0.07 −0.17 −0.05
Fig. 9 a Rainfall bias, b RMSD, c correlation coefficient, and d standard deviation of different convective options and their ensemble for 4 wetter, 7 drier, and 11 sub-domains (All). In these statistical measures, CRU is used as the reference data for the period 2001–2010
inspection reveals that the EMAN dry option overestimates temperature in July–September. Hence, time series of interannual monthly rainfall and temperature data cannot assist in deciding upon the best convective scheme option within RegCM4, although it clearly indicates the patterns of interannual variation, which follow the CRU observations relatively well. Taylor diagrams are employed, in which standard deviation, correlation coefficient, and root mean square difference (RMSD) between modeled and observed rainfall/temperature are summarized, as shown in Fig. 7. For rainfall simulation, the EMAN, EMAN wet, and EMAN dry options (B, F, and J in the left panel, Fig. 7) are poor because of their large standard deviation and RMSD, and small correlation coefficient, compared to the other options. In contrast, the performances of the three GFC options (C, G, and K) are relatively better for their high correlation coefficient, low standard deviation, and RMSD. On the other hand, the performances of the three GLEO options (A, E, and I) are reasonable in simulation of rainfall using RegCM4 because of their low RMSD and standard deviation, although the correlation is a little lower (about
Best convective parameterization scheme within RegCM4 Table 2 Rainfall and temperature biases corresponding to each convective parameterization scheme options within RegCM4 with respect to CRU data for the CORDEX-MENA/Arab domain (All), wetter, and drier regions Rainfall bias (%)
Temperature bias (°C)
All
Wetter
Drier
All
Wetter
Drier
GLEO EMAN GFC GAS GLEO wet EMAN wet GFC wet GAS wet GLEO dry EMAN dry GFC dry
−30.64 167.61 −0.37 −36.65 −20.13 183.64 28.47 −25.83 −32.93 79.58 −6.88
−35.33 164.93 4.10 −40.15 −23.86 181.15 35.50 −29.19 −37.48 80.18 −2.97
−1.63 184.23 −28.01 −14.99 2.96 199.00 −15.06 −5.03 −4.78 75.84 −31.07
−0.11 −0.85 −0.66 −0.32 −0.25 −0.83 −0.95 −0.51 −0.05 −0.30 −0.58
0.07 −1.21 −0.97 0.06 −0.23 −1.10 −1.46 −0.24 0.14 −0.50 −0.83
−0.21 −0.64 −0.48 −0.54 −0.26 −0.68 −1.16 −1.22 −0.17 −0.19 −0.44
GAS dry Ensemble
−37.73 22.35
−41.50 21.28
−14.41 28.92
−0.31 −0.48
0.10 −0.51
−0.55 −0.54
0.1) than the three GFC options. In the case of temperature simulation, all the convective scheme options deliver similar
Fig. 10 a Temperature bias, b RMSD, c correlation coefficient, and d standard deviation of different convective options and their ensemble for 4 wetter, 7 drier, and 11 sub-domains (All). In these statistical measures, CRU is used as the reference data for the period 2001–2010
performances; however, the three GLEO options seem to be more suitable (A, E, and I in the right panel, Fig. 7). To further investigate the best convective scheme option within RegCM4, Box-whisker plots for rainfall and temperature are presented in Fig. 8. For rainfall, Ensemble performs well while GFC is probably the best single option among all the convective scheme options in terms of median, data spread, and highest/lowest data values, compared to CRU. In the case of temperature simulation, the performance of the GLEO dry option is better; it is even better than the Ensemble. Hence, none of the convective options is commonly the best for both rainfall and temperature simulations. Moreover, the best option varies from region to region (i.e., sub-domain to sub-domain) and from variable to variable, as presented in Table 1. However, we need to designate a single convective option (common for both rainfall and temperature) to drive RegCM4 for the generation of climatic parameters in longterm projections. For simplicity in searching for the suitable convective option (common for both rainfall and temperature), four subdomains (III, V, VI, and IX) having rainfalls above the average for all 11 sub-domains are designated as a wetter region, and the other seven sub-domains (I, III, IV, VII, VIII, X, and XI) having rainfalls below the average are designated as a drier
M. Almazroui et al.
region. It is worth mentioning that most of the Arab countries are situated under the drier region of the study domain. In determining the most suitable option, some statistical measures, namely, bias, correlation coefficient, root mean square difference (RMSD), and standard deviation, for the wetter and drier regions are presented here. For some of the options, in particular EMAN, rainfall bias has been found to be too large and unacceptable for both the wetter and drier regions (Fig. 9a). EMAN scheme option also delivered a large RMSD compared to other options for both the regions (Fig. 9b). The simulated rainfall shows a strong correlation with the observation data for most of the options (for both the wetter and drier regions), except for a poor correlation for EMAN in the drier region (Fig. 9c). The simulated rainfall delivered a standard deviation that is similar to CRU for most of the options, except for large values for EMAN (Fig. 9d). Since rainfall is one of the most crucial variables to simulate in a climate model, the results with the least rainfall bias is given priority in this study for the selection of the best convective option. EMAN simulates a rainfall wet bias of about 80 % for all regions which reach up to ∼200 % for EMAN wet; therefore, we reject it in the simulation of rainfall using RegCM4 (Table 2). GFC is better for the wetter region (bias of 4.10 %), which reflects in the entire domain (−0.37 %), but it delivered a dry bias of about 30 % for the drier region (Table 2). The GAS option shows a large rainfall Fig. 11 Monthly time series of rainfall (top panel) and temperature (bottom panel) data in three GLEO options within RegCM4 averages from 11 (All), 4 wetter, and 7 drier sub-domains displayed with CRU data for the period 2001–2010
bias compared to GLEO, whereas GLEO simulates very little bias for the drier region. Overall, GLEO is also better than Ensemble, which is the average of the 12 options. Further inspection reveals that the GLEO, GLEO wet, and GLEO dry options delivered rainfall biases of respectively −1.63, 2.96, and −4.78 % (−35.33, −23.86, and −37.48 %) for the drier (wetter) region (Table 2). For the entire domain, the rainfall bias is −30.64, −20.13, and −32.93 % for the GLEO, GLEO wet, and GLEO dry options, respectively. In the case of temperature, all convective options show a cold bias, except for a little warm bias with the GLEO, GLEO dry, GAS, and GAS dry options in the wetter region (Fig. 10a). RMSD at each region varies among different options, where GFC wet shows the highest RMSD for the wetter region and GLEO options show the lowest value for RMSD for the drier and the entire region (as well as a little for the wetter region) (Fig. 10b). There is a strong correlation between the model and CRU temperature for all options (Fig. 10c). The simulated temperature shows a standard deviation similar to that of the CRU data for all regions (Fig. 10d). The temperature bias for the drier (wetter) region is −0.21, −0.26, and −0.17 °C (0.07, −0.23, and 0.14 °C) for the GLEO, GLEO wet, and GLEO dry options, respectively. For the entire domain, it is −0.11, −0.25, and −0.05 °C for the GLEO, GLEO wet, and GLEO dry options, respectively. Moreover, Ensemble shows a temperature dry bias of above
Best convective parameterization scheme within RegCM4
0.50 °C for both the wetter and drier regions. It is evident that out of the three GLEO options, we do not have a best option common for both rainfall and temperature for all the regions; thus, we must decide upon the most suitable option through compromising both rainfall and temperature as well as considering the region of interest. As mentioned earlier, the drier region reflects the area of our interest in the CORDEXMENA/Arab domain. Therefore, giving priority to the drier region and creating a balance with the wetter region, GLEO wet becomes the most preferable option to recommend for the simulation of rainfall and temperature in the CORDEXMENA/Arab domain because it follows very closely the interannual variability of the monthly CRU data (Fig. 11).
4 Discussion Various convective parameterization schemes within RegCM4 show that many of them are not suitable in the simulation of rainfall and temperature climatology for a particular region as well as for the entire CORDEX-MENA/Arab domain. However, a few of them are found suitable in constructing a high resolution climate database to use in applicationoriented tasks. Among the 12 options investigated in this study, GFC is found suitable in rainfall simulation, and GLEO dry is suitable in temperature simulation for the entire domain, although these options vary from region to region Fig. 12 Simulated evapotranspiration, soil water, and runoff of different convective options within RegCM4 and their ensemble with ERA-Int data averages from 11 (All), 4 wetter, and 7 drier sub-domains displayed for the period 2001– 2010
(sub-domain to sub-domain, see Table 1). However, giving priority to the drier region, where most of the Arab countries are located, GLEO wet comes up as the best option, i.e., common for both rainfall and temperature simulations. To investigate the reason for the better performance of a specific convective scheme option, the available climatic parameters are analyzed and compared with the ERA-Int driving data. Evapotranspiration obtained from RegCM4 shows that it varies from option to option and from region to region (Fig. 12a). The simulated evapotranspiration follows the pattern of the ERA-Int driving field evaporation: it is large in the wetter region and small in the drier. This is in the same order as that of rainfall (reproducible from Fig. 6a). This indicates that RegCM4 reproduces evaporation well, which is linked to the rainfall amounts of the different regions. In general, evaporation in all three EMAN options shows large values, while the GLEO and GAS options show small values, and the GFC options are in the middle range, where GFC wet is the highest among the three GFC options for the wetter region, which reflects the entire domain. In the drier region, evaporation is a little larger for the three EMAN options, compared to the other options. RegCM4 simulated soil water and runoff follows a similar pattern to that of evaporation (Fig. 12b, c). These are indicative of rainfall overestimation with the EMAN options in the wetter region, which dominates the entire domain, and of the reasonable rainfall amounts with other options for the drier region.
M. Almazroui et al.
In general, the climate characteristic of the Arab region is dry, where all the seven drier sub-domains (I, II, IV, VII, VIII, X, and XI) are located; the south of the analysis domain is wet, where sub-domains III, V, VI, and IX are situated (see Fig. 4). Water vapor transgresses inland from the Mediterranean Sea, the Arabian Sea, and the Atlantic Ocean (Fig. 13). Figure 13 shows that strong winds are observed around sub-domains IV, VII, X, and XI. Among all the 12 options used in this study, RegCM4 simulates large water vapor values with EMAN, which is very clear when the ERA-Int driving specific humidity field (i.e., the amount of water vapor in the air) is subtracted from the simulated data, as shown in Fig. 13. This large overestimation of water vapor values in EMAN scheme might have been the cause of wet bias as shown in Fig. 6a. Other convective schemes simulate a deficit of water vapor for the
southern, western, and northwestern sub-domains (e.g., III, VI, VIII, and X); however, for the other sub-domains, there is almost no difference in terms of water vapor. Water vapor is overestimated over the bodies of water in RegCM4 compared to the ERA-Int driving field; water vapor is supposed to be transported to the land by the wind, which means that RegCM4 should enhance rainfall, compared to the ERA-Int driving field. This does not happen in the simulated output because RegCM4 simulates lower wind speeds compared to the ERA-Int driving field for all the options (not shown). This lower wind speed simulation reduces the amount of rainfall in RegCM4, which corrects the ERA-Int data into an estimate that is closer to the CRU values (see Fig. 6a). In the simulation of the pressure field, RegCM4 produces large surface pressure, compared to the ERA-Int driving
Fig. 13 RegCM4 simulated lower level (1000 hPa) wind velocity superimposed with specific humidity difference (RegCM4 minus ERAInt) in different 12 options. Wind velocity and humidity bias are for
GLEO (first row), EMAN (second row), GAS (third row), and GFC (fourth row). Left, middle, and right columns are for normal, wet, and dry options, respectively. Data are averaged over the period 2001–2010
Best convective parameterization scheme within RegCM4
forcings, for almost all of the regions and for all the convective options, except for low pressure for the three EMAN options (Fig. 14). This may explain the reason of large wet bias in simulation of rainfall with EMAN options. The low pressure bias in EMAN may increase the pressure gradient between land and water, hence resulting in increased moisture advection from ocean to land. It may be noted that due to small difference in horizontal resolution of Era-Interim (0.75°× 0.75°) and RegCM4 (0.5° × 0.5°), the added value in RegCM4 simulation is not much observed. However, one may expect added value in the case of downscaling coarser resolution CMIP5 GCMs (1–2° lat/long) in control climate later on. Since this paper focuses mainly on rainfall bias, therefore more detailed analysis in terms of temperature bias (such as the tuning of albedo and land surface coverage) may be considered as the case of future study.
5 Conclusions
Fig. 14 Lower level (1000 hPa) pressure difference when ERA-Int is subtracted from RegCM4 in different 12 options. Pressure differences are for GLEO (first row), EMAN (second row), GAS (third row), and
GFC (fourth row). Left, middle, and right columns are for normal, wet, and dry options, respectively. Data are averaged over the period 2001– 2010
Through 12 sensitivity experiments for various convective parameterization scheme options within RegCM4, the selection of the best option for downscaling CMIP5 global datasets for the CORDEX-MENA/Arab domain is suggested. A suitable convective scheme option for wetter region, drier region, and each of 11 sub-domains (8°×8° boxes) is also suggested throughout the analysis domain. The most suitable convective scheme option within RegCM4 varies from region to region. However, for the entire CORDEX-MENA/Arab domain, the Grell convective scheme with Fritsch-Chappell closure (GFC) is found to be better for rainfall simulation, as it has the lowest bias (0.37 %) compared to the CRU data. For temperature, Grell over land and Emanuel over water with the dry option (GLEO dry) is found
M. Almazroui et al.
to be better, as it has the lowest bias (−0.05 °C). Among the all options, Emanuel (EMAN) is found to have the highest overestimation (183.64 %) in rainfall simulation, while GFC wet shows the largest cold bias (−0.95 °C) in temperature simulation. Ensemble (from the 12 convective scheme options) is found to have large rainfall (22.35 %) and temperature (−0.48) bias. The sources of these biases seem to emanate from the differences in surface pressure, water vapor, and low level wind speeds in RegCM4 simulations as compared to the driving fields. Giving priority to the drier region, where most of the Arab countries are located, the GLEO wet option is found to be suitable for both rainfall (2.96 %) and temperature (0.26 °C) simulations when using RegCM4. Therefore, the single option GLEO wet in downscaling CMIP5 data using RegCM4 is suggested for the CORDEX-MENA/Arab domain; this is cost effective and convenient for many climate research centers where computational facilities are not quite adequate. However, for the application of RegCM4 on specific region, especially at national level within the CORDEXMENA/Arab domain, the model should be driven with its own individual most suitable option, as discussed in this paper and presented in Table 1. Acknowledgments The authors would like to acknowledge the grant by the NSTIP strategic technologies program in the Kingdom of Saudi Arabia– Project No. 12-ENV3197-03 to complete this work– and the Science and Technology Unit, King Abdulaziz University for technical support. The ICTP, Trieste, Italy, is acknowledged for providing RegCM4 and CRU data wete acquired from their website. The League of Arab States (LAS) and the United Nations Economic and Social Commission for Western Asia (UN-ESCWA) are also acknowledged for leading and facilitating the BRegional Initiative for the Assessment of Climate Change Impacts on Water Resources and Socio-economic Vulnerability in the Arab Region (RICCAR)^. Open Access This article is distributed under the terms of the Creative Commons Attribution 4.0 International License (http:// creativecommons.org/licenses/by/4.0/), which permits unrestricted use, distribution, and reproduction in any medium, provided you give appropriate credit to the original author(s) and the source, provide a link to the Creative Commons license, and indicate if changes were made.
References Almazroui M (2015) RegCM4 in climate simulation over CORDEXMENA/Arab domain: selection of suitable domain, convection andland-surface schemes. Int J Climatol. doi:10.1002/joc.4340 Almazroui M (2013) Simulation of present and future climate of Saudi Arabia using a regional climate model (PRECIS). Int J Climatol 33: 2247–2259. doi:10.1002/joc.3721 Almazroui M (2012) Dynamical downscaling of rainfall and temperature over the Arabian Peninsula using RegCM4. Clim Res 52:49–62. doi:10.3354/cr01073 Almazroui M (2011) Sensitivity of a regional climate model on the simulation of high intensity rainfall events over the Arabian Peninsula and around Jeddah (Saudi Arabia). Theor Appl Climatol 104:261– 276. doi:10.1007/s00704-010-0387-3
Anthes RA (1977) A cumulus parameterization scheme utilizing a onedimensional cloud model. Mon Weather Rev 105:1423–1438 Anthes RA, Hsie EY, Kuo YH (1987) Description of the Penn State/ NCAR Mesoscale Model Version 4 (MM4). National Center for Atmospheric Research Tech Note TN-282+STR, NCAR, Boulder, CO Anyah RO, Semazzi FHM (2007) Variability of East African rainfall based on multi-year RegCM3 model simulations. Int J Climatol 27:357–371 Arakawa A, Schubert WH (1974) Interaction of cumulus cloud ensemble with the large-scale environment, Part I. J Atmos Sci 31:674–701 Artale V, Calmanti S, Carillo A, Dell'Aquila A, Hermann M, Pisacane G, Ruti PM, Sannino G, Struglia MV, Giorgi F, Bi X, Pal JS, Rauscher S (2010) An atmosphere–ocean regional climate model for the Mediterranean area: assessment of a present climate simulation. Clim Dyn 35:721–740. doi:10.1007/s00382-009-0691-8 Bretherton CS, McCaa JR, Grenier H (2004) A new parameterization for shallow cumulus convection and its application to marine subtropical cloud-topped boundary layers. I. Description and 1D results. Mon Weather Rev 132:864–882 Brown C, Arthur G, Paul B, Alessandra G (2008) Review of downscaling methodologies for Africa climate applications. International Research Institute for Climate and Society, IRI Technical Report 08–05, Columbia University, USA Chen M, Pollard D, Barron EJ (2003) Comparison of future climate change over North America simulated by two regional models. J Geophys Res Atmos 108(D12):4348 Cossarini G, Salon S, Libralato S, Gao XJ, Giorgi F, Solidoro C (2008) A downscaling experiment for the lagoon of Venice. Part II: testing potential impacts of changes in precipitation patterns on biogeochemical properties. Clim Res 38:43–59. doi:10.3354/cr00758 Dash SK, Shekhar MS, Singh GP (2006) Simulation of Indian summer monsoon circulation and rainfall using RegCM3. Theor Appl Climatol 86:161–172 Dickinson RE, Henderson-Sellers A, Kennedy PJ (1993) Biosphereatmosphere transfer scheme (BATS) version 1 as coupled to the NCAR community climate model. National Center for Atmospheric Research (NCAR) Technical Note NCAR/TN-387+ STR, NCAR, Boulder, CO, doi:10.5065/D67W6959 Emanuel KA (1991) A scheme for representing cumulus convection in large-scale models. J Atmos Sci 48:2313–2335 Emanuel KA, Živković-Rothman M (1999) Development and evaluation of a convection scheme for use in climate models. J Atmos Sci 56: 1766–1782 Fritsch JM, Chappell CF (1980) Numerical prediction of convectively driven mesoscale pressure systems. Part I: convective parameterization. J Atmos Sci 37:1722–1733 Giorgi F, Marinucci MR, Bates G, DeCanio G (1993) Development of a second generation regional climate model (RegCM2) II. Convective processes and assimilation of lateral boundary conditions. Mon Weather Rev 121:2814–2832 Giorgi F, Coppola E, Solmon F, Mariotti L, Sylla MB, Bi X, Elguindi N, Diro GT, Nair V, Giuliani G, Turuncoglu UU, Cozzini S, Güttler I, O’Brien TA, Tawfik AB, Shalaby A, Zakey AS, Steiner AL, Stordal F, Sloan LC, Branković C (2012) RegCM4: model description and preliminary tests over multiple CORDEX domains. Clim Res 52:7– 29. doi:10.3354/cr01018 Giorgi F, Hewitson B (2001) Regional climate information—evaluation and projections. In: Houghton JT, Ding Y, Griggs DJ, Noguer M, van der Linden PJ, Xioaosu D (eds) Climate change 2001: the scientific basis, contribution of working group I to the third assessment report of the intergovernmental panel on climate change. Cambridge University Press, Cambridge Grenier H, Bretherton CS (2001) A moist PBL parameterization for large scale models and its application to subtropical cloud-topped marine boundary layers. Mon Weather Rev 129:357–377
Best convective parameterization scheme within RegCM4 Grell GA (1993) Prognostic evaluation of assumptions used by cumulus parameterizations. Mon Weather Rev 121:764–787 Holtslag AAM, de Bruijn EIF, Pan HL (1990) A high resolution air mass transformation model for short-range weather forecasting. Mon Weather Rev 118:1561–1575 Islam MN, Almazroui M (2012) Direct effects and feedback of desert dust on the climate of the Arabian Peninsula during the wet season: a regional climate model study. Clim Dyn 39:2239–2250. doi:10. 1007/s00382-012-1293-4 Islam MN (2009) Rainfall and temperature scenario for Bangladesh. Open Atmos Sci J 3:93–103 Islam MN, Rafiuddin M, Ahmed AU, Kolli RK (2007) Calibration of PRECIS in employing future scenarios in Bangladesh. Int J Climatol 28:617–628. doi:10.1002/joc.155 Jones RG, Noguer M, Hassell DC (2004) Generating high-resolution climate change scenarios using PRECIS. Met Office Hadley Centre, Exeter, UK Kiehl JT, Hack JJ, Bonan GB, Boville BA, Breigleb BP, Williamson D, Rasch P (1996) Description of the NCAR community climate model (ccm3). Tech Rep NCAR/TN-420 + STR, National Center for Atmospheric Research, doi:10.5065/D6FF3Q99 Mitchell TD, Jones PD (2005) An improved method of constructing a database of monthly climate observations and associated high resolution grids. Int J Climatol 25:693–712. doi:10.1002/joc.1181 New M, Hulme M, Jones P (2000) Representing twentieth–century space– time climate variability. Part II: development of 1901–1996 monthly grids of terrestrial surface climate. J Clim 13(13):2217–2238 O'Brien TA, Chuang PY, Sloan LC, Faloona IC, Rossiter DL (2012) Coupling a new turbulence parametrization to RegCM adds realistic
stratocumulus clouds. Geosci Mod Dev 5:989–1008. doi:10.5194/ gmd-5-989-2012 Pal JS, Giorgi F, Bi X, Elguindi N (2007) The ICTP RegCM3 and RegCNET: regional climate modeling for the developing world. Bull Am Meteorol Soc 88(9):1395–1409 Rahman MM, Islam MN, Ahmed AU, Afroz R (2007a) Comparison of RegCM3 simulated meteorological parameters in Bangladesh: Part I-preliminary result for rainfall. Sri Lankan J Phys 8:1–9 Rahman MM, Islam MN, Ahmed AU, Afroz R (2007b) Comparison of RegCM3 simulated meteorological parameters in Bangladesh: Part II—preliminary result for temperature. Sri Lankan J Phys 8:11–19 Salon S, Cossarini G, Libralato S, Gao XJ, Solidoro C, Giorgi F (2008) A downscaling experiment for the lagoon of Venice. Part I: validation of the present day precipitation climatology. Clim Res 38:31–41. doi:10.3354/cr00757 Simmons A, Uppala S, Dee D, Kobayashi S (2006) ERA-Interim: new ECMWF reanalysis products from 1989 onwards. ECMWF News Lett 110:25–35 Tawfik AB, Steiner AL (2011) The role of soil ice in land–atmosphere coupling over the United States: a soil moisture precipitation winter feedback mechanism. J Geophys Res 116:D02113 WMO (2007) The role of climatological normals in a changing climate. World Meteorological Organization, Geneva. WCDMP-No. 61, WMO-TD No. 1377. Available at http://www.wmo.int/datastat/ documents/WCDMPNo61_1.pdf Zeng X, Zhao M, Dickinson RE (1998) Intercomparison of bulk aerodynamic algorithms for the computation of sea surface fluxes using TOGA COARE and TAO data. J Clim 11:2628–2644