functions Mn(Q2) start to evolve according to twist-2 operators, and a maximum value Q2 max. (â¼> 5 (GeV/c)2 [8]), where the resonance contribution to the ...
Preprint INFN-GE 97/1 INFN-ISS 97/1
arXiv:nucl-th/9703013v2 7 Oct 1997
Bloom-Gilman duality of inelastic structure functions in nucleon and nucleia G. Ricco(∗,∗∗) , M. Anghinolfi(∗∗) , M. Ripani(∗∗) , S. Simula(∗∗∗) and M. Taiuti(∗∗) (∗)
Dipartimento di Fisica, Universit`a di Genova Via Dodecanneso 33, I-16146, Genova, Italy (∗∗) Istituto Nazionale di Fisica Nucleare, Sezione di Genova Via Dodecanneso 33, I-16146, Genova, Italy (∗∗∗) Istituto Nazionale di Fisica Nucleare, Sezione Sanit`a Viale Regina Elena 299, I-00161 Roma, Italy
Abstract The Bloom-Gilman local duality of the inelastic structure function of the proton, the deuteron and light complex nuclei is investigated using available experimental data in the squared four-momentum transfer range from 0.3 to 5 (GeV /c)2 . The results of our analysis suggest that the onset of the Bloom-Gilman local duality is anticipated in complex nuclei with respect to the case of the proton and the deuteron. A possible interpretation of this result in terms of a rescaling effect is discussed with particular emphasis to the possibility of reproducing the damping of the nucleon-resonance transitions observed in recent electroproduction data off nuclei.
PACS numbers: 13.60.Hb; 13.60.Rj; 12.40.Nn;14.20.Dh.
a
To appear in Physical Review C.
1
Introduction.
The investigation of inelastic lepton scattering off nucleon and nuclei can provide relevant information on the concept of parton-hadron duality, which deals with the relation among the physics in the nucleon-resonance and Deep Inelastic Scattering (DIS) regions. As is known, well before the advent of QCD, parton-hadron local duality was observed empirically by Bloom and Gilman [1] in the structure function νW2p (x, Q2 ) of the proton measured at SLAC (where x ≡ Q2 /2mν is the Bjorken scaling variable, m the nucleon mass and Q2 the squared four-momentum transfer). Moreover, it is well established that both the electroexcitation of the most prominent nucleon resonances and the nuclear structure function in the DIS region are affected by nuclear medium (cf., e.g., Refs. [2, 3]). In particular, existing data on the electroproduction of nucleon resonances show that the disappearing of the resonance bumps with increasing Q2 is faster in nuclei than in the nucleon (cf., e.g., Refs. [4], [5] and references therein quoted). Therefore, in this paper we want to address the specific question whether and to what extent the Bloom-Gilman duality already observed in the proton occurs also in the structure function of a nucleus. To this end, all the available experimental data for the structure functions of the proton, the deuteron and light complex nuclei in the Q2 range from 0.3 to 5 (GeV /c)2 have been analyzed and the Q2 behaviours of the structure function and its moments are presented for all the targets considered. In case of the proton we observe that the Bloom-Gilman local duality is fulfilled only by the inelastic part of the structure function, while the inclusion of the contribution of the elastic peak leads to remarkable violations of the local duality. In case of complex nuclei, despite the poor statistics of the available data, it is found that the onset of the parton-hadron local duality for the inelastic part of the structure function is anticipated with respect to the case of the proton and the deuteron. Nevertheless, new high-precision nuclear data are needed and, in this respect, it should be mentioned that the Thomas Jefferson National Accelerator Facility (T JNAF ) is expected to provide in the next future systematic measurements with unprecedented accuracy of the nucleon and nuclear inelastic response to electron probes in the region of nucleon-resonance production for values of Q2 up to several (GeV /c)2 . Finally, a possible interpretation of the observed nuclear modification of the onset of the Bloom-Gilman local duality in terms of a Q2 -rescaling effect is discussed with particular emphasis to the possibility of reproducing the damping of the nucleon-resonance transitions observed in recent electroproduction data off nuclei [5].
2
The dual structure function.
The Bloom-Gilman local duality [1] states that the smooth scaling curve measured in the DIS region at high Q2 represents an average over the resonance bumps seen in the same x region at low Q2 . More precisely, Bloom and Gilman pointed out the occurrence of a precocious scaling of the average of the inclusive νW2p (x′ , Q2 ) data in the resonance region to the DIS structure function F2p (x′ ), at corresponding values of an improved empirical variable x′ = x/(1 + m2 x/Q2 ). Later on, within QCD, a justification of the Bloom-Gilman duality was offered by De Rujula, Georgi and Politzer [6] in terms of the moments Mn (Q2 ) 2
of the nucleon structure function F2 (ξ, Q2 ): Mn (Q2 ) ≡
Z
0
1
dξξ n−2F2 (ξ, Q2)
(1)
where ξ is the Nachtmann variable (cf. [7]) ξ=
2x 1+
q
1+
(2)
4m2 x2 Q2
Using the Operator Product Expansion (OP E) the authors of Ref. [6] argued that Mn (Q2 ) = An (Q2 ) +
∞ X
k=1
γ2 n 2 Q
!k
Bnk (Q2 )
(3)
where γ 2 is a scale constant. The first term An (Q2 ) in Eq. (3) is the result of perturbative QCD, while the remaining terms Bnk (Q2 ) are higher twists related to parton-parton correlations. The value of γ 2 is relatively small (a recent estimate, made in Ref. [8], yields 2 2 γ 2 ∼ 0.1 ÷ 0.3 GeV 2 ). Therefore, at Q2 > ∼ m the asymptotic moments An (Q ) are still leading, while resonances contribute to the higher twists Bnk (Q2 ). The quantities An (Q2 ) can be considered as the moments of a smooth structure function, which can be identified with the average function hνW2 (x, Q2 )i occurring in the Bloom-Gilman local duality, namely [7]: hνW2 (x, Q2 )i =
x2
F2S (ξ, Q2) 2 2 ξ2 (1 + 4mQ2x )3/2
+ 6
Z 1 S ′ 2 x3 m2 ′ F2 (ξ , Q ) dξ Q2 (1 + 4mQ22x2 )2 ξ ξ ′2
m4 x4 + 12 4 Q (1 + 4mQ22x2 )5/2
Z
ξ
1
dξ
′
Z
1
ξ′
F2S (ξ”, Q2) dξ” ξ”2
(4)
where the ξ-dependence as well as the various integrals appearing in the r.h.s. account for target mass effects in the OP E of the hadronic tensor. According to Ref. [7] these effects have to be included in order to cover the low Q2 region. In Eq. (4) F2S (x, Q2 ) represents the asymptotic nucleon structure function, fitted to high Q2 proton and deuteron data [9] and extrapolated down to low values of Q2 by the Altarelli-Parisi evolution equations [10]. In this paper the Gluck-Reya-Vogt (GRV ) fit [11], which assumes a renormalization scale as low as 0.4 (GeV /c)2 , will be used to obtain the parton densities ρf (x, Q2 ) evolved at Next to Leading Order (NLO) from sufficiently low Q2 to cover the range of interest in the present P analysis. In the DIS region [12] one gets F2S (x, Q2 ) = f e2f x [ρf (x, Q2 ) + ρ¯f (x, Q2 )]. In what follows, we will refer to the mass-corrected, NLO evolved function (4) as the dual structure function of the nucleon. We stress that by definition the dual function does not contain any higher twists generated by parton-parton correlations, i.e. the twists related to the moments Bnk (Q2 ) in Eq. (3). It should be mentioned that Eq. (4) suffers from a 3
q
well known [13, 14] mismatch; indeed, since ξ(x = 1) = 2/(1 + 1 + 4m2 /Q2 ) < 1, the r.h.s. of Eq. (4) remains positive, while its l.h.s. vanishes, as x approaches the elastic end-point x = 1. An alternative approach [13], limited at the twist-4 order, is well behaved at the kinematical x = 1 threshold, but it cannot be extrapolated to low values of Q2 , because an expansion over the quantity m2 x2 /Q2 is involved. Moreover, inelastic threshold effects, due to finite pion mass, are accounted for neither in the Q2 evolution nor in the target mass corrections, because they are basically higher-twist effects; then, in order to make a detailed comparison with experimental data in the low Q2 region, we set the dual structure function (4) to zero at x ≥ xth , where xth =
1 1+
m2π +2mπ m Q2
(5)
with mπ being the pion mass. Therefore, the investigation of parton-hadron local duality will be limited to values of x not larger than xth (5) and to a Q2 range between a minimum value Q2min , which is of the order of the mass scale µ2 where the moments of the structure functions Mn (Q2 ) start to evolve according to twist-2 operators, and a maximum value Q2max 2 (> ∼ 5 (GeV /c) [8]), where the resonance contribution to the lowest moments of Eq. (3) is of the same order of magnitude of the experimental errors.
3
Inclusive data analysis.
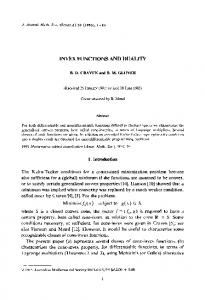
The pseudo-data for the proton structure function νW2p , obtained from a fit of SLAC data at medium and large x [15] and from a fit of the NMC data [9] in the DIS region, are reported in Fig. 1 versus the Natchmann variable ξ (2) and compared with the dual structure function (4) at fixed values of Q2 in the range 0.5 to 2 (GeV /c)2 . As already pointed out in [6], the onset of local duality occurs at Q2 ≃ Q20 ∼ 1 ÷ 2 (GeV /c)2 . ¯ N ≡ (νW2p + In case of the deuteron the average nucleon structure function ν W 2 νW2n )/2, obtained from (4), should be folded with the momentum distribution which accounts for the internal motion of the nucleon in the deuteron. The most evident effect of this folding is a broadening of the nucleon elastic peak occurring at x = 1 into a wider quasielastic peak, partially overlapping the inelastic cross section at large x. In the deuteron the nucleon momentum distribution is relatively narrow and this fact limits the overlap to the kinematical regions corresponding to x > ∼ 0.8. Therefore, it is still possible to subtract the quasi-elastic contribution directly from the total cross section [15]. The folding of the dual structure function of the nucleon (Eq. (4)) with the nucleon momentum distribution in the deuteron is performed following the procedure of Ref. [16], which can be applied both at low and high values of Q2 , at variance with the standard high-Q2 folding of Ref. [17]. Adopting the deuteron wave function corresponding to the Paris nucleon-nucleon potential [18], our results for the dual structure function folded in the deuteron are reported in Fig. 2 at fixed values of Q2 in the range from 0.5 to 2 (GeV /c)2 , and compared with the deuteron structure function per nucleon, F2D (ξ, Q2 ) ≡ νW2D (ξ, Q2)/2, obtained from the NMC data [19] at low ξ and the fits of inclusive data given in Refs. [9] and [15]. Despite the smoothing of nucleon 4
resonances caused by the Fermi motion, parton-hadron local duality appears to start again at Q2 ≃ Q20 ∼ 1 ÷ 2 (GeV /c)2 . In case of complex nuclei the analysis of existing inclusive data is complicated by different reasons: • inclusive data, coming mainly from old experiments generally with poor statistics, is still very fragmented; • the longitudinal to transverse separation has been done only in case of few measurements carried out in the nucleon-resonance region. An experiment performed at Q2 = 0.1 (GeV /c)2 [20] in 12 C and 56 F e claims a longitudinal to transverse ratio com2 patible with zero inside experimental errors (∼ 10%), while at Q2 > ∼ 1 (GeV /c) deep inelastic scattering data are consistent with larger, fairly x independent σL /σT ratios [21]. However, the sensitivity of the extraction of the nuclear structure function νW2A from the total cross section to the longitudinal to transverse ratio turns out to be rather small (not larger than few % when σL /σT is moved from zero to 20% in the worst kinematical conditions). Therefore, we have simply interpolated all the existing data for σL /σT in proton and nuclei, averaged on x, as a function of Q2 only, obtaining the following empirical ratio: h
2
σL /σT = a · Q2 e−bQ + c · e−dQ
2
i
with a = 0.014, b = 0.07, c = 40.8 and d = 0.78. Since the observed dependence of the inclusive nuclear data on the mass number A is weak [22], the nuclear structure function νW2A has been determined as a function of ξ for fixed Q2 bins using data for 9 Be [22, 23], 12 C [15, 19, 24] and 16 O [5]. Therefore, our result could be considered representative of a complex nucleus with A ≃ 12; • since the nucleon momentum distribution is wider in complex nuclei than in the deuteron (cf. [25] and references therein quoted), the quasi-elastic contribution strongly overlaps the inelastic cross section at low values of Q2 ; moreover, the quasi-elastic peak 2 is known to be affected by final state interaction effects at Q2 < ∼ 0.5 (GeV /c) (cf. [5]). Then, the subtraction of the quasi-elastic contribution is more critical in nuclei; • nucleon binding can affect nuclear structure function and should be properly taken into account [3]; The calculation of the quasi-elastic contribution has been performed following the approach of Ref. [25], which has been positively checked against SLAC data at values of Q2 of few (GeV /c)2 [25] as well as against jet-target data at lower Q2 (down to 0.1 (GeV /c)2 [5]). An example of the quality of the agreement among the parameter-free predictions of the quasi-elastic contribution to the inclusive 12 C(e, e′ )X cross section and available data at the quasi-elastic peak and in its low-energy side for a Q2 range from 0.5 to 1 (GeV /c)2 , is shown in Fig. 3. Furthermore, the dual structure function of the nucleon (4) has been folded using again the procedure of Ref. [16], which, in case of complex nuclei, involves the nucleon 5
spectral function of Ref. [25]; in this way binding effects are taken into account for states both below and above the Fermi level. After quasi-elastic subtraction, the results obtained for the inelastic nuclear structure function per nucleon, F2A (ξ, Q2 ) ≡ νW2A (ξ, Q2 )/A, are shown in Fig. 4 for various Q2 bins, namely: Q2 = 0.375 ± 0.03; 0.50 ± 0.05; 0.75 ± 0.05; 1.1 ± 0.2; 1.8 ± 0.2 and 4.5 ± 0.5 (GeV /c)2 . In comparison with the proton and deuteron cases, the most striking feature of our result for nuclei with A ≃ 12 is a more rapid smoothing of the resonance bumps with increasing Q2 , which favours a faster convergence towards the dual structure function in the nucleus. This effect, already noticed in Ref. [5] in the Q2 range from 0.1 to 0.5 (GeV /c)2 , cannot be completely explained as a broadening of the resonance width due to final state interactions, but some extra-damping factor is needed in order to reproduce the missing resonance strengthb . From Fig. 4 it can clearly be seen that the dual structure function (4), properly folded [16] using the nucleon spectral function of Ref. [25], approaches the inelastic data at Q2 ≃ Q20 ∼ 0.5 ÷ 1.1 (GeV /c)2 , i.e. for values of Q20 lower than those found in the proton and in the deuteron (Q20 ∼ 1 ÷ 2 (GeV /c)2 ).
4
Results and discussion.
All the data obtained for the structure function F2p (ξ, Q2) in the proton, F2D (ξ, Q2) in the deuteron and F2A (ξ, Q2 ) in nuclei with A ≃ 12 (see Figs. 1, 2 and 4) show a systematic approach to the properly folded dual structure function for ξ > ∼ 0.2, the convergence being even more evident and faster in nuclei, due to the fading of resonances already at Q2 > ∼ 0.5 (GeV /c)2 . At smaller values of ξ and for Q2 < 5 (GeV /c)2 proton and deuteron data seems to be compatible with an evolution of sea partons slower than the GRV prediction; in complex nuclei the difference is further enhanced by the shadowing effect [3]. The reason of this discrepancy is not evident and various motivations can be invoked, like: a breakdown of duality and/or (unexpected) higher twists at low x, or, more likely, a not yet completely consistent initial (Q2 ≃ 0.4 (GeV /c)2 ) parton density parametrization in GRV fit [11]. The minimum momentum transfer Q20 , where local duality provides an acceptable fit to the average inclusive inelastic cross sections, should be related to the mass scale µ2 , which is defined as the minimum value of Q2 where the moments of the structure functions Mn (Q2 ) begin to evolve according to twist-2 operators, i.e. when Mn (Q2 ) ∼ An (Q2 ). Thus, the Q2 -dependence of all the moments should exhibit a systematic change of the slope at Q2 ≃ Q20 ≃ µ2 and then should follow the perturbative QCD evolution. The experimental M2 (Q2 ), M4 (Q2 ), and M6 (Q2 ) moments have been computed for the proton, the deuteron and nuclei with A ≃ 12 according to Eq. (1) using the experimental data for the structure function F2p (ξ, Q2 ), F2D (ξ, Q2 ) and F2A (ξ, Q2) shown in Figs. 1, 2 and 4. The results are plotted in Fig. 5 for Q2 between 0.3 and 5 (GeV /c)2 . The expected systematic change of the slope is clearly exhibited by all the moments considered and the corresponding values of b
Medium effects were noticed also in Ref. [26] in the form of a better y-scaling of the inclusive cross section in the region of P33 (1232) resonance electroproduction in nuclei with respect to the free nucleon case.
6
Q2 = Q20 are reported in Table 1. Moreover, in Fig. 6 the relative deviation Mn (Q2 ) − An (Q2 ) ∆Mn 2 (Q ) ≡ An An (Q2 )
(6)
is plotted as a function of Q2 , where An (Q2 ) has been computed from the properly folded dual structure function (continuous lines in Figs. 1, 2 and 4). Despite the large errors affecting the available nuclear data, in case of all the targets considered the results for ∆M2 /A2 show a rapid convergence toward A2 for values of Q2 very close to the Q20 values of Table 1. For higher moments, the convergence toward An is still evident, but it is slower probably because of the presence of resonances at large ξ. The results presented in Figs. 5 and 6 correspond only to the contribution of the inelastic part of the structure functions to the moments (1). Since in Eq. (1) the integration is extended up to ξ = 1, the question of the role played by the contribution of the elastic peak in the nucleon and the quasi-elastic peak in nuclei naturally arises. Therefore, in case of the proton we have considered the contribution Mn(el) (Q2 ) resulting from the elastic peak, which reads as Mn(el) (Q2 ) =
G2E (Q2 ) + τ G2M (Q2 ) ξpn 1+τ 2 − ξp
(7)
where GqE (GM ) is the charge (magnetic) Sachs form factor of the proton, ξp ≡ ξ(x = 1) = 2/(1 + 1 + 1/τ ) and τ = Q2 /4m2 . In Fig. 7 we have reported the results obtained for Mn(tot) (Q2 ) ≡ Mn(el) (Q2 ) + Mn (Q2 ) and ∆Mn(tot) (Q2 )/An (Q2 )c . It can clearly be seen that the higher-twists introduced by the proton elastic peak do not change significantly (within 2 few %) the lowest-order moment M2 (Q2 ) for Q2 > ∼ 1.5 (GeV /c) , whereas they sharply affect higher moments up to quite large values of Q2 (cf. also Ref. [8]). This means that (tot) parton-hadron duality still holds for the total area M2 (Q2 ), i.e. for the average of the structure function over all possible final states, with a mass scale consistent with the one obtained including the inelastic channels only. On the contrary, at least for Q2 up to several (GeV /c)2 the local duality is violated by the elastic peak. This result is consistent with those of Refs. [1, 6], where the applicability of the concept of parton-hadron local duality in the region around the nucleon elastic peak was found to be critical. We have obtained similar results in case of the deuteron, while the analysis of the available nuclear data appears to be compatible within large errors. To sum up, the twist-2 moments An (Q2 ) dominate the total moments Mn(tot) (Q2 ) starting from values of Q2 which strongly depend upon the order of the moment (see Fig. 7). On the contrary, the Q2 behaviour of the inelastic contribution Mn (Q2 ) is governed by An (Q2 ) starting from a value Q2 ≃ Q20 almost independent of the order of the moment (see Figs. 5 and 6); thus, after Mellin transformation, the twist-2 2 operators dominate the inelastic part of the structure function for Q2 > ∼ Q0 and, therefore, the parton-hadron local duality holds for the averages of the structure function over the nucleon-resonance bumps. (tot)
We point out that Eq. (3) holds only for Mn (Q2 ) (cf. Ref. [8]). The elastic contribution (7) must be included in Eq. (1) when the extraction of the higher-twists from the moments is required, which is not the case of the present work. c
7
Both the comparison of the moments and the discussion on the onset of the local duality strongly suggest the occurrence of the dominance of twist-2 operators in the inelastic structure functions for values of Q2 above the Q20 values of Table 1. Therefore, we may argue that present experimental data are compatible with a mass scale µ2 ≃ Q20 ; from Table 1 this means: µ2N ≃ µ2D = 1.5 ± 0.1 (GeV /c)2 for the nucleon and the deuteron, and µ2A = 1.0 ± 0.2 (GeV /c)2 for nuclei with A ≃ 12. A change of the mass scale of the twist-2 matrix elements in nuclei (µ2A < µ2D ≃ µ2N ) is expected to lead to a rescaling relation for the (inelastic) moments [27, 28], viz. MnA (Q2 ) = MnD (δn (Q2 ) · Q2 )
(8)
with δn (Q2 ≃ µ2 ) ≃ µ2D /µ2A . Assuming a rescaling factor δn (µ2 ) ≃ δ independent of the order of the moment, the rescaling relation (8) with δ = 1.17 ± 0.09 brings all the moments in the deuteron and in nuclei into the best simultaneous agreement around the mass scale region, as it is shown in Fig. 8. A possible mechanism for the Q2 -rescaling has been suggested in Ref. [27]: the quark confinement scale may increase in going from a free nucleon to a nucleus, due to the partial overlap of nucleons in the nuclear medium. The change in the quark confinement size leads to a change in the mass scale µ2 and one gets δ = µ2D /µ2A = λ2A /λ2D , where λD (≃ λN ) and λA are the average quark confinement size in the deuteron (nucleon) and in the nucleus, respectively. We stress that the partial quark deconfinement is not the only mechanism yielding a rescaling effect; in this respect, we mention also the model of Ref. [28], where the rescaling mechanism is driven by the off-mass-shellness of the nucleon in the nucleus. If δn (Q2 ) is independent of the order of the moment, then after Mellin transformation the Q2 - rescaling can be applied to the nuclear structure function per nucleon F2A (x, Q2 ), viz. F2A (x, Q2 ) = F2D (x, δ(Q2 ) · Q2 )
(9)
where the virtual photon mass dependence of δ(Q2 ) follows from perturbative QCD evolution at NLO (see [27, 28]). In Fig. 9 existing data on F2A (x, Q2 ) for nuclei with A ≃ 12 are plotted for fixed values of x in a wide Q2 range. The dual structure function (4), properly folded [16] for taking into account nuclear binding effects, is also shown in Fig. 9 for different values of the mass scale ratio µD /µA . It can be seen that at high Q2 a mass scale ratio µD /µA = 1.1 removes most of the disagreement at large x, but at the price of spoiling the agreement at intermediate values of x. Moreover, at low values of Q2 the present accuracy of the data does not allow any serious discrimination between different quark confinement ratios. We mention that in Ref. [29] a nucleon swelling corresponding to µD /µA ≃ 1.075 has been derived from a combined analysis of the EMC effect at small and large x, performed within a constituent-quark picture of the nucleon structure function in nuclei. To sum up, roughly consistent values of the mass scale ratio µD /µA between the deuteron and nuclei with A ≃ 12 can be obtained in different ways, viz. • from the onset of local duality (see Table 1 and Fig. 5): µD /µA = 1.2 ± 0.1; 8
• from the rescaling of the moments at the static point Q2 ≃ µ2 (see Fig. 8): µD /µA = 1.08 ± 0.05; • from the EMC effect (see Fig. 9): µD /µA < ∼ 1.10. Nucleon resonances contribute mostly to M4 (Q2 ) and M6 (Q2 ) (see Fig. 6): the good overlap of these moments in the deuteron and nuclei, observed in Fig. 8 after Q2 -rescaling, could suggest that a change of the mass scale in nuclei might be consistent with the more rapid decrease of the inelastic P33 (1232) and D13 (1520) resonance form factors claimed in Ref. [5], where values of Q2 as low as 0.1 (GeV /c)2 are however involved. The experimental suppression factor Rs (Q2 ), as determined in Ref. [5] using inclusive 12 C and 16 O data, is reported in Fig. 10 as a function of Q2 in the region of the P33 (1232) resonance production. Assuming that a constant Q2 -rescaling δ(Q2 ) ≃ µ2D /µ2A can be used below the static point (Q2 < µ2 ), the suppression factor is expected to be given by (N −∆) µ2D GM [ µ2
(N −∆)
Rs (Q2 ) =
A
2
Q
(N −∆) GM (Q2 )
2 ]
(10)
where GM (Q2 ) is the magnetic form factor of the N − ∆ transition. Using a standard dipole form (for sake of simplicity) and the value µD /µA = 1.08, one gets the solid lines 2 2 shown in Fig. 10 at Q2 < ∼ 0.5 (GeV /c) . It can be seen that (surprisingly) a simple Q rescaling of the dipole ansatz is consistent with the quenching observed for the ∆-resonance electroproduction both in case of the excitation strength alone (see Fig. 10(a)) and for the total inclusive cross section (see Fig. 10(b) and cf. Ref. [31]). A Q2 -rescaling effect could in principle be applied also to the elastic form factors of a nucleon bound in a nucleus and it can be viewed as a change of the nucleon radius in the nuclear medium. In this respect, it should be pointed out that: i) in Ref. [32] an increase not larger than ≃ 6% of the proton charge radius was found to be compatible with y-scaling in 3 He and 56 F e; ii) the analysis of the Coulomb Sum Rule (CSR) made in Ref. [33] suggested an upper limit of ≃ 10% to the variation of the proton charge radius in 56 F e; iii) recently [34] the experimental value (SL ) of the CSR in 12 C and 56 F e has been accurately analyzed at Q2 ≃ 0.3 (GeV /c)2 , obtaining a saturation value SL = 0.94 ± 0.13 and SL = 0.97 ± 0.12, respectively. If at the same value of Q2 we would assume the same change of the mass scale (µ2D /µ2A ≃ 1.15) observed in the inelastic channels, an increase of ≃ 8% for the proton charge radius and a quenching of ≃ 0.84 for SL would be obtained, both being at limit with the quoted errors. However, based on the results shown in Figs. 5-7, it is unlikely that a common Q2 -rescaling effect could be applied both to the nucleon elastic peak and to the nucleon-resonance transitions. Before closing, let us make a brief comment on the photoproduction of nucleon resonances. Real photon experiments [35] show that in several nuclei [36] a substantial reduction of the excitation strength of D13 (1520) and F15 (1680) resonances occur in comparison with the corresponding hydrogen and deuterium data. This effect suggests both a broadening of the resonance width and a quenching of their excitation strength [37]; while the broadening 9
could be a consequence of final state interactions [38], the quenching might be ascribed to a reduction of the transition strength in radial-type excitations, due again to the overlap of confinement potentials among neighbouring nucleons in nuclei [39]. However, a common explanation of the behaviour of the resonance bumps both in the photo- and in the electro-production still awaits for a deeper understanding.
5
Conclusions.
The concept of parton-hadron local duality represents a very powerful tool for analyzing inclusive lepton scattering data in the low Q2 region, where important quantities like the mass scale, the leading and higher twists in the structure function may be investigated. We have analyzed all the existing inclusive data on the inelastic structure function of the nucleon, the deuteron and light complex nuclei in a Q2 range from 0.3 to 5 (GeV /c)2 and the Q2 behaviours of the structure function and its moments have been presented for all the targets considered. In case of the proton we have observed that the Bloom-Gilman local duality is fulfilled only by the inelastic part of the structure function, while the inclusion of the contribution of the elastic peak leads to remarkable violations of the local duality. In case of complex nuclei, despite the poor statistics of the available data, our analysis suggests that the onset of the parton-hadron local duality for the inelastic part of the structure function is anticipated with respect to the case of the nucleon and the deuteron. A possible interpretation of this result in terms of a Q2 -rescaling effect has been discussed: using different methods, a decrease of the mass scale of ≃ 8% in nuclei turns out to be consistent with inelastic experimental data. It has also been shown that the same variation of the mass scale is consistent with the faster fall-off of the P33 (1232) transition form factors observed in nuclei with respect to the nucleon case even at very low values of Q2 . Finally, we expect that the same Q2 -rescaling effect cannot be applied both to the elastic and transition form factors of a nucleon bound in a nucleus, consistently with the severe constraints on nucleon swelling arising from updated analyses of the Coulomb sum rule in nuclei. In conclusion, the Bloom-Gilman local duality in nucleon and nuclei appears to be a non-trivial dynamical property of the inelastic structure functions, whose deep understanding is still to be reached and deserves much more attention from the theoretical as well as the experimental point of view. As to the latter, more systematic and high-precision inclusive data are needed for a clear-cut extraction of information; our present analysis should therefore be considered as a strong suggestion that interesting results can be expected, when the structure functions of nucleon and nuclei are compared in the low Q2 region. New facilities becoming operative in the next future, like CEBAF , are expected to provide inclusive data with unprecedented accuracy, allowing a throughout investigation of the relation among the physics in the nucleon-resonance and Deep Inelastic Scattering regions.
References [1] E. Bloom and F. Gilman: Phys. Rev. Lett. 25 (1970) 1140; Phys. Rev. D4 (1971) 2901. 10
[2] J.M. Laget in New Vistas in Electro-Nuclear Physics, edited by E.L. Tomusiak, H.S. Coplan and E.T. Dressler, NATO Advanced Study Institute, Series B, Vol. 142 (Plenum, New York, 1986), pp. 361-429, and references therein quoted. [3] M. Arneodo: Phys. Rep. 260 (1994) 302, and references therein quoted. [4] F. Heimlich et al.: Nucl. Phys. A231 (1974) 509. [5] M. Anghinolfi et al.: Nucl. Phys. A602 (1996) 405; J. of Physics G21 (1995) L9. [6] A. De Rujula, H. Georgi and H.D. Politzer: Ann. of Phys. 103 (1977) 315. [7] H. Georgi and H.D. Politzer: Phys. Rev. D14 (1976) 1829. [8] X. Ji and P. Unrau: Phys. Rev. D52 (1995) 72. [9] M. Arneodo et al.: Phys. Lett. B364 (1995) 107. L.W. Whitlow et al.: Phys. Lett. B282 (1992) 475. M. Virchaux and A. Milsztajn: Phys. Lett. B274 (1992) 221. [10] G. Altarelli and G. Parisi: Nucl. Phys. B126 (1977) 298. [11] M. Gluck, E. Reya and A. Vogt: Z. Phys. C53 (1992) 127; C67 (1995) 433. H. PlothowBesch: preprint /CERN-PPE/15-3-1995 (PDF Library) and Comp. Phys. Comm. 75 (1993) 396. [12] G. Altarelli, R.K. Ellis and G. Martinelli: Nucl. Phys. B143 (1978) 521; ib. B157 (1979) 461. [13] J.L. Miramontes, M.A. Miramontes and J. Sanchez Guillen: Phys. Rev. D40 (1989) 2184; Z. Phys. C41 (1988) 247. [14] K. Bitar, P.W. Johnson and Wu-Ki Tung: Phys. Lett. B83 (1979) 114. R.K. Ellis, L. Petronzio and G. Parisi: Phys. Lett. B64 (1976) 97. [15] A. Bodek et al.: Phys. Rev. D20 (1979) 7. S. Stein et al.: Phys. Rev. D12 (1975) 1884. [16] S. Simula: Few Body Systems Suppl. 8 (1995) 423; ibidem 9 (1995) 466. [17] L.L. Frankfurt and M.I. Strikman: Phys. Rep. 76 (1981) 215. [18] M. Lacombe et al.: Phys. Lett. B101 (1981) 139. [19] M. Arneodo et al.: Nucl. Phys. B33 (1990) 1. [20] D.T. Baran et al.: Phys. Rev. Lett. 61 (1988) 400. [21] E. Rondio, private communication. [22] J. Gomez et al.: Phys. Rev. D49 (1994) 4348.
11
[23] J. Franz et al.: Z. Phys. C10 (1981) 105. [24] (a) D.B. Day et al.: Phys. Rev. C48 (1993) 1849. (b) F. Heimlich et al.: Phys. Rev. C3 (1971) 1448. (c) R.M. Sealock et al.: Phys. Rev. Lett. 62 (1989) 1350. [25] C. Ciofi and S. Simula: Phys. Rev. C53 (1996) 1689; Phys. Lett. B325 (1994) 276. [26] R. Cenni and P. Saracco: J. of Phys. G20 (1994) 727. [27] R. Jaffe: Phys. Rev. Lett. 50 (1983) 228. F.E. Close, R.G. Roberts and G.G. Ross: Phys. Lett. B129 (1983) 346. F. Close, R. Jaffe, A. Roberts and G. Ross: Phys. Lett. bf B134 (1984) 449; Phys. Rev. D31 (1985) 1004. [28] G.V. Dunne and A. W. Thomas: Nucl. Phys. A455 (1986) 701. [29] W. Zhu and L. Qian: Phys. Rev. C45 (1992) 1397. [30] A.C. Benvenuti et al.: Phys. Lett. B195 (1987) 91. [31] C.E. Carlson and N.C. Mukhopadhyay: Phys. Rev. D47 (1993) R1737. [32] I. Sick: Phys. Lett. B157 (1985) 13. [33] J.P. Chen et al.: Phys. Rev. Lett. 66 (1991) 1283. [34] J. Jourdan: Nucl. Phys. A603 (1996) 117. [35] M. Anghinolfi et al.: Phys. Rev. C47 (1993) R922. Th. Frommhold et al.: Phys. Lett. B295 (1992) 28. G. Ricco: in Proc. of the 4th Int. Seminar on Nuclear Physics, Amalfi (Italy), May 1992, ed. A. Covello (World Scientific, Singapore, 1993), p.57. [36] M. Bianchi et al.: Phys. Lett. B299 (1993) 219; ib. B325 (1994) 333. [37] V. Mokeev, E. Santopinto, M. Giannini and G. Ricco: Int. J. Mod. Phys. E4 (1995) 607. [38] W.M. Alberico, G. Gervino and A. Lavagno: Phys. Lett. B231 (1994) 177. L. Kondratyuk, M. Krivoruchenko, N. Bianchi, E. De Sanctis and V. Muccifora: Nucl. Phys. A579 (1994) 453. [39] M. Giannini and E. Santopinto: Phys. Rev. C49 (1994) R1258. M. Giannini and E. Trovatore: Int. J. Mod. Phys. E, in press.
12
Table 1. Values of Q2 = Q20 (in GeV 2 /c2 ) where a systematic change in the slope is exhibited by the Q2 -dependence of the moments M2 (Q2 ), M4 (Q2 ) and M6 (Q2 ) (see Fig. 5), computed for the proton, the deuteron and nuclei with A ≃ 12 according to Eq. (1) using the experimental data shown in Figs. 1, 2 and 4.
proton deuteron nuclei
M2 1.6 ± 0.2 1.6 ± 0.1 0.8 ± 0.1
13
M4 1.5 ± 0.1 1.5 ± 0.1 1.0 ± 0.2
M6 1.6 ± 0.1 1.5 ± 0.1 1.2 ± 0.1
0.4
0.3
0.3
F 2p (ξ , Q2)
F 2p (ξ , Q2)
0.4
0.2 0.1
0.2 0.1
(a) Q2 = 0.5 GeV2/c2 0.0 0.0
0.1
0.2
0.3
(b) Q2 = 0.75 GeV2/c2 0.4
0.0 0.0
0.5
0.1
0.2
0.4
0.4
0.3
0.3
0.2
0.1
0.2
0.3
(d) Q2 = 1.5 GeV2/c2
0.4
0.5
0.0 0.0
0.6
0.2
0.4
ξ
0.6
ξ 0.5
0.4
(f) Q2 = 5.0 GeV2/c2
0.4
0.3
F 2p (ξ , Q2)
F 2p (ξ , Q2)
0.6
0.2
(c) Q2 = 1.0 GeV2/c2
0.2 0.1
0.2
0.4
0.3 0.2 0.1
(e) Q2 = 2.0 GeV2/c2 0.0 0.0
0.5
0.1
0.1 0.0 0.0
0.4
ξ
F 2p (ξ , Q2)
F 2p (ξ , Q2)
ξ
0.3
0.6
0.0 0.0
0.8
ξ
0.2
0.4
0.6
0.8
1.0
ξ
Figure 1. Proton structure function F2p (ξ, Q2 ) = νW2p (ξ, Q2 ) versus the Natchmann variable ξ (Eq. (2)) at various values of Q2 . The shaded areas represent the pseudo-data, obtained from a fit of SLAC data at medium and large x [15] and from a fit of N M C data [9] in the DIS region, including the total uncertainty of the fits. The solid lines are the dual structure function of the nucleon (Eq. (4)), obtained starting from the GRV [11] parton densities evolved N LO at low Q2 and target-mass corrected according to Ref. [7].
14
0.3
0.3
F2 (ξ , Q2)
0.4
0.2
0.2
D
D
F2 (ξ , Q2)
0.4
0.1
0.1 (a) Q2 = 0.5 GeV2/c2
0.0 0.0
0.1
0.2
0.3
(b) Q2 = 0.75 GeV2/c2 0.4
0.0 0.0
0.5
0.1
0.2
0.4
0.3
0.3
F2 (ξ , Q2)
0.4
0.2
0.5
0.6
0.2
D 0.1
0.1 (c) Q2 = 1.0 GeV2/c2
0.0 0.0
0.1
0.2
0.3
(d) Q2 = 1.5 GeV2/c2
0.4
0.5
0.0 0.0
0.6
0.2
0.4
ξ 0.5
(f) Q2 = 5.0 GeV2/c2
0.4
F2 (ξ , Q2)
0.3
D
D
0.2 0.1
0.2
0.4
0.3 0.2 0.1
(e) Q2 = 2.0 GeV2/c2 0.0 0.0
0.6
ξ
0.4
F2 (ξ , Q2)
0.4
ξ
D
F2 (ξ , Q2)
ξ
0.3
0.6
0.0 0.0
0.8
ξ
0.2
0.4
0.6
0.8
1.0
ξ
Figure 2. The same as in Fig. 1, but for the deuteron structure function per nucleon F2D (ξ, Q2 ) ≡ νW2D (ξ, Q2 )/2. The N M C data of Ref. [19] at low ξ and the fits of inclusive data given in Refs. [9] and [15], have been considered. The solid curve is the dual structure function of the nucleon (Eq. (4)), folded according to the procedure of Ref. [16] with the nucleon momentum distribution in the deuteron corresponding to the Paris nucleon-nucleon potential [18].
15
(µb / GeV sr)
0.20 (a) Q ≈ 0.5 (GeV/c) 2
2
0.15
2 d σ / dν dΩe
0.10 0.05 0.00 0.1
0.2
0.3
0.4
0.5
0.6
d 2 σ / dν dΩe
(µb / GeV sr)
ν (GeV) 0.10 (b) Q2 ≈ 0.7 (GeV/c)2
0.08 0.06 0.04 0.02 0.00 0.2
0.3
0.4
0.5
0.6
d 2 σ / dν dΩ e
(µb / GeV sr)
ν (GeV) 0.3 (c) Q2 ≈ 0.9 (GeV/c)2 0.2
0.1
0.0 0.2
0.3
0.4
0.5
0.6
0.7
0.8
ν (GeV)
Figure 3. Differential cross section (per nucleon) for the inclusive process 12 C(e, e′ )X versus the energy transfer ν in the Q2 range from 0.5 to 0.9 (GeV /c)2 (at the quasi-elastic peak). The solid lines represent the quasi-elastic contribution calculated using the approach of Ref. [25], which includes final state interaction effects. In (a) the dashed line is the same as the solid line, but obtained within the impulse approximation only, i.e. without including final state interaction effects. In (a), (b) and (c) the electron beam energy and scattering angle, (Ee , θe ), are: (1.3 GeV, 37.5o ), (1.5 GeV, 37.5o ) and (3.595 GeV, 16o ), respectively. In (a) and (b) the experimental data are from Ref. [24](c), while in (c) they are from Ref. [24](a).
16
(a) Q2 = 0.0375 ± 0.03
0.3
F2 A(ξ , Q2)
F2 A(ξ, Q2)
0.3
0.2
0.1
0.2
0.1 (b) Q 2 = 0.50 ± 0.05
0.0
0.0 0.0
0.1
0.2
0.3
0.4
0.5
0.6
0.0
0.1
0.2
ξ
0.5
0.6
0.3
F2 A(ξ, Q2)
F 2A(ξ, Q2)
0.4
ξ
0.3
0.2
0.1
0.2
0.1
(c) Q = 0.75 ± 0.05 2
(d) Q
0.0
2
= 1.1 ± 0.2
0.0 0.0
0.1
0.2
0.3
0.4
0.5
0.6
0.0
0.2
ξ
0.4
0.6
0.8
ξ
0.4
0.5 (e) Q2 = 1.8 ± 0.2
(f) Q2 = 4.5 ± 0.5
0.4
F2 A(ξ, Q2)
0.3
F 2A(ξ, Q2)
0.3
0.2
0.1
0.3 0.2 0.1
0.0
0.0 0.0
0.2
0.4
0.6
0.8
1.0
0.0
0.2
0.4
0.6
0.8
ξ
ξ
Figure 4. The same as in Fig. 1, but for the nuclear structure function per nucleon F2A (ξ, Q2 ) ≡ νW2A (ξ, Q2 )/A in case of nuclei with A ≃ 12. Experimental data are from Refs. [22, 23] (9 Be), [15, 19, 24] (12 C) and [5] (16 O). The solid curve is the dual structure function of the nucleon (Eq. (4)), folded according to the procedure of Ref. [16], which adopts the nucleon spectral function of Ref. [25] to take into account nuclear binding effects.
17
proton
M2 (Q 2)
10 0
10
-1
10
-2
(a) 1
10 2
2
2
M4 (Q 2)
Q (GeV /c ) 10
-1
10
-2
10
-3
(b) 1
10 2
2
2
M6 (Q 2)
Q (GeV /c ) 10
-2
10
-3
10
-4
(c) 1
10
Q 2 (GeV2 /c 2)
Figure 5. The moments M2 (Q2 ), M4 (Q2 ) and M6 (Q2 ), computed according to Eq. (1) for the proton (a,b,c), the deuteron (d,e,f) and nuclei with A ≃ 12 (g,h,i) using the experimental data of Figs. 1, 2 and 4, versus Q2 . The dashed and solid lines are linear fits to low and high Q2 points and they are intended to show up the change of the slope of the moments at Q2 ≃ Q20 .
18
deuteron
M 2 (Q 2)
10 0
10
-1
10
-2
(d) 1
10 2
2
2
M4 (Q 2 )
Q (GeV /c ) 10
-1
10
-2
10
-3
(e) 1
10 2
2
2
M6 (Q 2 )
Q (GeV /c ) 10
-2
10
-3
10
-4
(f) 1
10 2
2
2
Q (GeV /c )
Figure 5 - continued.
19
nuclei
M 2 (Q 2)
10
0
10
-1
10
-2
(g) 1
10 2
2
2
M4 (Q 2 )
Q (GeV /c ) 10
-1
10
-2
10
-3
(h) 1
10 2
2
2
M 6 (Q 2)
Q (GeV /c ) 10
-2
10
-3
10
-4
(i) 1
10 2
2
2
Q (GeV /c )
Figure 5 - continued.
20
proton 2 2 ∆M2 (Q ) / A2 (Q )
0.1 0.0 -0.1 -0.2 (a) -0.3 1
10 2
2
2
Q (Gev /c )
2 2 ∆M 4 (Q ) / A4 (Q )
0.2 0.1 0.0 -0.1 -0.2 (b) -0.3 1
10 2
2
2
∆M 6 (Q 2 ) / A6 (Q 2 )
Q (Gev /c )
0.2
0.0
-0.2 (c) -0.4 1
10 2
2
2
Q (Gev /c )
Figure 6. The relative deviation ∆Mn (Q2 )/An (Q2 ) (Eq. (6)) of the experimental moments Mn (Q2 ), reported in Fig. 5, with respect to the leading twist moments An (Q2 ), calculated from Eq. (1) using the dual nucleon structure function (4), properly folded [16] with the nucleon motion in the nuclear medium. The vertical dotted lines are intended to show the approximate location of the static point Q2 ≃ µ2 , namely µ2N ≃ µ2D ≃ 1.5 (GeV /c)2 and µ2A ≃ 1.0 (GeV /c)2 (see text).
21
deuteron 2 2 ∆M 2 (Q ) / A2 (Q )
0.1 0.0 -0.1 -0.2 (d) -0.3 1
10 2
2
2
Q (Gev /c )
2 2 ∆M4 (Q ) / A4 (Q )
0.3 0.2 0.1 0.0 -0.1 -0.2
(e)
-0.3 1
10 2
2
2
Q (Gev /c )
2 2 ∆M6 (Q ) / A6 (Q )
0.3 0.2 0.1 0.0 -0.1 -0.2
(f)
-0.3 1
10 2
2
2
Q (Gev /c )
Figure 6 - continued.
22
nuclei ∆M 2 (Q 2) / A2 (Q 2 )
0.1 0.0 -0.1 -0.2 -0.3
(g)
-0.4 1
10 2
2
2
∆M4 (Q 2 ) / A4 (Q 2)
Q (GeV /c )
0.2
0.0
-0.2 (h) -0.4 1
10 2
2
2
Q (GeV /c )
∆M6 (Q 2 ) / A6 (Q 2 )
0.4 (i) 0.2
0.0
-0.2 1
10 2
2
2
Q (GeV /c )
Figure 6 - continued.
23
proton
proton ∆M2 (tot) (Q 2) / A 2(Q 2 )
M2 (tot) (Q 2)
10
0
10 -1
(a) 10
-2
0.2
0.1
0.0 (d) -0.1
1
10 2
2
1
2
Q (GeV /c ) ∆M 4(tot) (Q 2) / A 4 (Q 2 )
M4 (tot) (Q 2 )
2
2
Q (GeV /c )
10 -1
10 -2
(b) 10 -3
2.0 (e) 1.5
1.0
0.5 0.0
1
10 2
2
1
2
10 2
Q (GeV /c )
2
2
Q (GeV /c ) ∆M6 (tot) (Q 2 ) / A6 (Q 2)
10 -2
M6 (tot) (Q 2 )
10 2
10 -3
(c) 10 -4
5 (f)
4 3 2 1 0
1
10 2
2
1
2
Q (GeV /c )
(tot)
10 2
2
2
Q (GeV /c )
(el)
Figure 7. The moments Mn (Q2 ) = Mn (Q2 ) + Mn (Q2 ) (a, b, c) and the relative deviation (tot) ∆Mn (Q2 )/An (Q2 ) (d, e, f), calculated for the proton including in Eq. (1) the contribution of the elastic peak (7), versus Q2 . The vertical dotted lines are the same as in Fig. 6 (a, b, c).
24
∆M2 (Q 2 ) / A2 (Q 2)
0.2 0.1
(a)
0.0 -0.1 -0.2 -0.3 -0.4 1
10 2
2
2
2
2
2
2
2
2
Q (GeV /c )
2 2 ∆M 4 (Q ) / A4 (Q )
0.3 0.2
(b)
0.1 0.0 -0.1 -0.2 -0.3 1
10
Q (GeV /c )
∆M6 (Q 2 ) / A6 (Q 2 )
0.3 0.2
(c)
0.1 0.0 -0.1 -0.2 -0.3 1
10
Q (GeV /c )
Figure 8. The relative deviation ∆Mn (Q2 )/An (Q2 ) (Eq. (6)) of the experimental moments Mn (Q2 ) calculated for the deuteron (black dots) and for nuclei with A ≃ 12 (open dots). The latter have been Q2 -rescaled according to Eq. (8) using δn (Q2 ≃ µ2 ) ≃ µ2D /µ2A = 1.17. The solid lines represent global fits of the deuteron and (Q2 -rescaled) nuclear points.
25
100
•4
x=0.28 •3
x=0.35
F 2A(x, Q2)
•1.5
x=0.45
10-1 x=0.55
x=0.65
10-2 x=0.75
0.1
1
10
100
1000
Q2 (GeV/c)2 Figure 9. Nuclear structure function per nucleon F2A (x, Q2 ) ≡ νW2A (x, Q2 )/A versus Q2 at fixed values of x in case of nuclei with A ≃ 12. The experimental data are from Refs. [5, 15, 19, 22, 23, 24, 30]. The various markers correspond to different values of x. The solid line is the folding of the dual nucleon structure function (Eq. (4)) obtained using the procedure of Ref. [16]. The dashed line is the same as the solid line, but using the rescaling relation (9) with δ(Q2 ) taken from Ref. [27] and µD /µA = 1.10.
26
0.8
s
2
R (Q )
1.0
0.6 (a) 0.4 0.0
0.1
0.2
0.3
0.4
2
Q (GeV/c)
0.5 2
0.8
s
2
R (Q )
1.0
0.6 (b) 0.4 0.0
0.1
0.2 2
0.3
0.4
Q (GeV/c)
0.5 2
Figure 10. The suppression factor Rs (Q2 ) versus Q2 , as determined in Ref. [5], using inclusive 12 C (open dots) and 16 O data (full squares), in case of the excitation of the P33 (1232) resonance only (a) and for the total inclusive cross section @ W = 1232 M eV (b). The solid line is the prediction of the rescaling relation (10), obtained adopting a dipole ansatz for the magnetic form factor of the (N −∆) (Q2 ), and the value µD /µA = 1.08. N − ∆ transition, GM
27