AQUATIC MICROBIAL ECOLOGY Aquat Microb Ecol
I
Published May 22
Changing patterns of bacterial substrate decomposition in a eutrophication gradient H.-G. Hoppe*, H. C. Giesenhagen, K. Gocke Institut fiir Meereskunde, Diisternbrookerweg 20, D-24105 Kiel, Germany
ABSTRACT: Bacterial variables are expected to respond differently to eutrophication. This was investigated along the eutrophication gradient in the narrow Schlei fjord (northern Germany). Bacterial extracellular enzyme activities (peptidase, a- and P-glucosidase, chitinase) were measured together with a large number of autotrophic and heterotrophic biological variables. Increases of values measured along the eutrophication gradient were generally higher for bacterial substrate uptake and growth than for bacterial counts and enzyme activities. Annual patterns of activities (per volume of water) obtained from stations with different degrees of eutrophication were clearly different from each other. In contrast, annual patterns of activities per bacterial cell at the stations with different degrees of eutrophication were not clearly different from each other, Indicating that they did not depend on eutrophication. Size fractionation of enzyme activities revealed that most of the peptidase activity was generally associated with free-living bacteria ( 3 pm particle size class (43 and 5 2 % , respectively). Free enzyme activities ( < O 2 pm, % of total) were generally higher in less eutrophic areas than in eutrophic areas. Enzyme activities associated with the bacterial size class were generally higher in eutrophic areas than in less eutrophic areas. It is concl.uded that particle hydrolysis In eutrophic waters is mainly affected by attached bacterial glucosidic and chitinolytic potentials, while peptides are the preferred substrates of free-living bacteria. To cover bacterial C demands for growth, exudation by phytoplankton had to be supplemented by bacterial substrate hydrolysis in eutrophic waters, which was, however, not as high as expected. KEY WORDS: Bacterial production Primary production . Extracellular enzyme activity . Exudation Substrate decomposition - Eutrophication gradient
INTRODUCTION
Biological consequences of eutrophication depend on the geographic, hydrographic and climatic situation of a water body and also on the type of eutrophication. Nevertheless, there a r e some commonly observed and well-documented changes in the balance between autotrophic and heterotrophic processes which are combined with a high degree of eutrophication: Photosynthetic plankton is frequently dominated by cyanobacteria. The contribution of the microbial loop organisms in recycling processes is generally smaller than in oligotrophic waters (Bird & Kalff 1984). Absolute values of bacterial substrate uptake and growth are high, 'E-mail:
[email protected] 0 Inter-Research 1998
but the contribution of heterotrophic biomass and biomass production to the total standing stock and production is relatively low (Schiewer & Gocke 1995). In contrast to this general knowledge, relatively little is known about the reasons for the different response of bacteria to eutrophication. Information about the initial processes of the microbial loop and their modification by eutrophication could probably provide a key for a better understanding of the function of bacteria in eutrophic waters. In detail, the question is: Which of the diverse factors of bacterial substrate conditioning, substrate uptake and growth are most strongly influenced (favoured or repressed) by eutrophication? This could help to explain the generally reduced role of bacterial heterotrophism under eutrophic and hypertrophic conditions.
2
.4quat M~crobEcol 3 5. 1-13, 1998
from southwest to northeast over 40 km with widths varying between 50 and 2000 m. The average depth is about 2 m (up to 8 m in the navigation channel) and the connection with the open sea is established by a narrow opening of 95 m width. Due to its direction the fjord is directly exposed to the prevailing westerly winds which occasionally cause a water exchange, at least in its middle and outer parts. The fjord is mostly stratified, but its bottom water is also always oxic. The fjord is heavily eutrop h ~ e d by terrestrial runoff from its rural surroundings and by the (purified) sewage of adjacent villages. There is a heavy mud layer on the bottom which counteracts recent efforts to improve water quality. During the summer period the phototrophic community is dominated by Chlorella sp. and the coccoid and aggregate-forming cyanobacterium Microcystis aeruglnosa (Rieper 1976). Fig. 1 Map showing the s~tuatlonof the sampl~ngstdt~onsStn 1 (inner Schle~, Seven sampling statlons (1 to 7) hvpertrophlc), Stn 7 (Schleimunde, eutrophlc) and the mesotrophic reference were located in the fjord and 1 referStn 8 in the Kiel Blqht ence station (8) outside in the Kiel Bight, which is 28 m deep and less eutrophic (Fig. 1).In this paper we present only results We investigated the narrow Schlei fjord (Germany) obtained from the 3 main stations: l (hypertrophic along its eutrophication gradient from the hyperinnermost part), 7 (mouth of Schlei fjord, water mixing trophic innermost part to the eutrophic outer part, and additionally a reference station in the adjacent Baltlc area) and 8 (reference station). Methods. Monthly investigations were performed on Sea. The activ~tyof different extracellular enzymes board the small research ship 'Littorina' over a period was estimated together with a large number of other of 27 mo from January 1991 to March 1993. On a few biological and chemical vanables. Relationships beoccasions the ship could not go into the fjord or only tween enzyme activities and variables of bactenal Into its outer part because of low water level or ice growth and substrate uptake as well as primary procover. Water samples were taken at 1 m depth by a duction were compared on selected stations along the eutrophication gradient and the reference station. In Niskin sampler. Temperature and salinity were determined by a TS addition, particle size fractionation of the water proprobe [WTW, Weilheim, Germany). Inorganic nutrivlded information about the preferred sites of bacterial ents (ammonia, nitrite, nitrate, phosphate, dissolved stibstrate hydro11 .is and the cl~dngeswhich this patinorganic carbon) were determined according to stantern undergoes along the eutrophication gradient. dard procedures (Grasshoff et al. 1983). F~nallv,changes of the relatlve importance of enzyChlorophyll a was measured by the colorimetric matic substrate hydrolysis for bactenal C demand in method according to Lorenzen (1967), using 96% waters with different degrees of eutrophicatlon are ethanol for extraction. discussed. Primary production was measured by I4C-bicarbonate uptake of the planktonic algae and cyanobacteria. Duplicates were ~ncubatedat simulated in situ light MATERIALS AND METHODS conditions adjusted to 100, 65, 27, 7 and 2 . 5 % of incident light intensity by neutral light filters. Incubation Study site. The Schlei fjord 1s situated on the peninwas from sunnse to noon. Labelled particles were harsula of Schleswig-Holstein, about halfway between vested on Sartonus membrane filters of 0.2 pm pore Hamburg and the Danish border. The fjord extends
Hoppe et al.:Bacterial substrate decomposition
size. Filters were placed into picovials (Beckmann) filled with 5 m1 of scintillation cocktail (Lumagel) and measured in a Beckman scintillation counter (the latter procedure is valid for all the following radioactive tracer applications). Exudates of phytoplankton were determined in 0.2 pm filtrates of '4C-blcarbonate supplemented subsamples after acidification (14C02was expelled over night) and calculated as O/o of primary production. Bacterial total counts (total bacterial numbers, TBN) and cell sizes were determined by acridine orange staining and epifluorescence microscopy according to Hobbie et al. (1977) using polycarbonate membranes (0.2 pm pore size) for filtration and a New Porton Grid in the eyepiece. Bacteria in 20 fields or a total of 200 bacteria were counted per sample and the sizes of at least 50 bacteria were measured for the calculation of bacterial cell volumes. Colony-forming bacteria (colony-forming units, CFU) were determined on ZoBell agar 2116e (ZoBell 1946) adjusted to salinities of 0, 8 and 23, for detection of freshwater bacteria, brackish water bacteria and marine bacteria tolerating brackish water. Coliforms were selected on Endo nutrient pads (Gocke & Rheinheimer 1991). Bacterial growth and biomass production were determined by 3H-thymidine and "-leucine uptake according to Fuhrman & Azam (1982) and Simon & Azam (1989), respectively. Uptake was saturated at 13.5 nmol 1-' for thyrnidine and 107 nmol 1-' for leucine. Conversion factors applied were 1. l X 106 cells pmol-' incorporated thymidine (Riemann et al. 1987) and pg C pm-3 bacterial volume (derived from 0.25 X 1 0 - ~ Silnon & Azam 1989). Triplicates were incubated at in situ temperature for 20 min to 1 h, which was in the linear phase of substrate uptake, and filtered on 0.2 pm pore size polycarbonate membranes (Costar). Maximal substrate uptake (V,) of glucose and turnover rates (T,) of glucose, acetate and leucine were determined in triplicates according to Gocke (1977) at substrate concentrations of 20 and 0.2 pg C I-', respectively. Labelled particles were harvested on 0.2 pm pore size cellulose-acetate membranes (Sartorius). Community respiration was determined by the oxygen demand over 24 h at i n situ temperature. Oxygen was measured by the Winkler method. Extracellular enzymes activities (EEA) were determined in principle according to Hoppe (1993). Measured enzyme activities were aminopeptidases (by using the model substrate leucine-n~ethylcoumarinylamide = leu-MCA), a - and P-glucosidases (by the model substrates methylumbelliferyl-a or P-glucopyranoside = MUF-a or P-glucoside) and chitinase (by methylumbelliferyl-N-acetylglucosaminide = MUFglucosaminide). Fluorogenic chemicals were from Sigma-Aldrich Chemie, Dreisenhofen, Germany. Max-
In
a eutrophication gradient
3
imal velocities of hydrolysis (H,) and hydrolysis rates (H,)were determined by enzyme kinetics using 6 substrate concentrations from 0.1 up to 1 mM in the first experiments. After having determined the eqzyme klnetics the experiments were continued with the 'one concentration' method, generally using 0.1 pM of substl-ate for the estimation of H, and 500 pm or 1 mM for the estimation of H, at Stns 7/8 or 1,respectively. Incubations of 2 to 6 h at in situ temperature were in the linear phase. Triplicates of unfractionated samples and fractionations of samples by 0.2 and 3 pm polycarbonate filters were used to calculate the total enzyme activity, the activity of dissolved enzymes ( ~ 0 . 2pm), the enzyme activity of free-living bacteria (>0.2 to c 3 pm) and the enzyme activity of attached bacteria (>3 pm). Fluorescence was read in a spectrofluorometer (Kontron SFM 25), excitation 364 nm and emission 445 nm, in 1 cm plastic cuvettes. For the calculation of enzyme activity (in terms of carbon hydrolysed from the model substrate per litre and hour) calibration factors were used, which were obtained from fluorescence readings of low methylurnbelliferon (MUF) and methylcoumarinyl-amide (MCA) concentrations dissolved in seawater. Calibration factors considered the organic carbon content of model substrates and the fluorescence per unit of the fluorescent tracer. Statistics. Data of all variables were tested by nonparametric statistics. A matrix of correlation between annual cycles of variables was established by using multiple linear regression (MLR) statistics (Statistica). Selected results of the correlation matrix are presented. Correlation of annual patterns of specific enzyme activities per bacterial cell were tested by Mann-Whitney rank sum test and Wilcox signed rank tests.
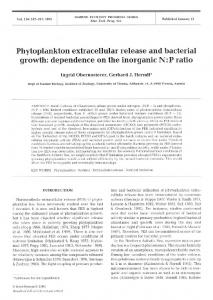
RESULTS Salinity and temperature Salinity ranged from 13 to 20 at Stn 8 (reference station) and from 5 to 8 at Stn 1 (inner Schlei) (Table 1). Temperature ranged from 0 to 22°C. Maximal summer temperature was lower in the first year of investigation than in the second (Fig. 3d).
Nutrients The high level of eutrophication of the Schlei is documented by the concentrations of nutrients. These ranged for nitrate at Stn 1 from 0.01 to 258 pM, at Stn 7 from 0.4 to 105 pM and at the reference Stn 8 from 0 to 13 PM. The corresponding ranges of ammonia were
0
100 X %Id (H, peptides)
10 X %/h ( leucine) l , d
N
100 X pgC/l/h (H, peptidase) 0
nM/l/h leucine
i3
Hoppe et al.. Bacterial substrate decompos~tionin a eutrophication gradient
0.6 to 43 (Stn l ) ,0.5 to 13 (Stn 7) and 0.4 to 6 (Stn 8). The corresponding ranges for phosphate were 1 to 14 (Stn l ) ,0.2 to 4 (Stn 7) and 0.1 to 3 (Stn 8) (Table 1). Nutrients in the inner Schlei did not completely
-%
5
deplete during the growth period. High phosphate concentrations in late summer were caused by anoxic conditions in the sediment and near bottom layer of water (Fig. 3d) (Gocke & Rheinheimer 1995).
5
e 4
-3 ,g3 E
0,l a a , , , , , .7
,
.
,
.
.
,
.
,
.
.
,
,
,
.
.
.
.
,
.
JFMAMJJASONDJFMAMJJASONDJFM 1991 1 Q92 :l993
JFMAMJJASONDJFMAMJJASONDJFM 1991
1992
:l993
Fig. 3. Annual cycles of selected variables at Stns 1, 7 and 8. (a) V, glucose uptake, (b) H, P-glucosidase, (c) H, chitinase. (d) Different variables, only at Stn 1. temperature, nitrate, phosphate. (e) T,glucose, (f) H, P-glucoside, (g) H, a-glucoside, ( h ) H, ch~tin.Vertical dashed lines: annual temperature peaks
6
Aquat Microb Ecol15: 1-13, 1998
Annual cycles of phytoplanktonic, bacterial and enzymatic variables All presented variables showed a strong decrease from the inner fjord (Stn 1) to the mouth of the fjord (Stn 7 ) and the reference station in the Kiel Bight (Stn 8),especially during the growth seasons (Figs. 2 & 3). Maxima of activities coincided in most cases with the peaks of temperature. Especially at Stn 1 during spring, chlorophyll a and primary production increased first, followed by enzyme activities, substrate uptake and finally by bacterial growth (Figs. 2a, b, c, e, f , g & 3a, b). All enzyme activities correlated with each other at Stns 1 and 7 (mostly at p < 0.01, according to MLR statistics) with the exception of H, of chitinase which did not correlate with H, of a-glucosides, H, of P-glucosides and H, of chitin.
the 'Discussion' In detail there were some differences between the annual patterns of the different specific enzyme activities at the hypertrophic Stn 1. Specific H, of peptidase and a-glucosidase did not vary significantly over the year and slightly increased in spring and fall. H,,, of P-glucosidase showed an irregular pattern, with highest values during winter Chitinase act~vitywas low in summer and increased during late fall. H, of peptides was rather similar over the year, with a small decrease in summer and an increase in late fall. H, of a-and P-glucosides and chitins showed an increase from spring to fall and a decrease in winter. Annual mean values of variables were higher at Stns 7 and 8 than at Stn 1. This resulted mainly from some exceptionally high values at Stns 7 and 8.
Relations of variables between hypertrophic and reference areas Annual cycles of cell-specific enzyme activities
In contrast to community enzyme activities, cellspecific enzyme activities (specific H, and H,) at the 3 stations with different degrees of eutrophication were not clearly separated from each other according to statistical Mann-Whitney and Wilcox tests (Fig. 4 ) . The tests were run without some exceptionally high values at Stns 7 and 8, the justification for this is presented in
Annual mean values and ranges of selected variables are shown in Table 1. Ranges were in most cases widest at Stn 7 (Schleimunde), because this area is alternatingly influenced by marine and fjord conditions. Exudates as % of primary production were surprisingly low at Stn 1 (inner Schlei) (Gocke & Rheinheimer 1995). Escherichia coli numbers can be very high (and above European limits for bathing water
Table 1. Annual mean values from Apnl 1992 to March 1993 (n = 12) and ranges of variables (in parentheses) in the Kiel Bight (Stn 81, at the mouth of the Schlei fjord (Schleimiinde, Stn 7) and in the hypertrophic inner Schlei (Stn 1) Parameter Salinity (S) Ammonia (PM) Nitrate (PM) Phosphate (PM)
Kiel Bight
Schleimiinde
Inner Schlei
17.5 (13.1-19.8) 1.64 (0.4-6.3) 3.02 (0-12.95) 1.01 (0.07-3.03)
15.6 (12.1-18.9) 4.35 (0.5-12.6) 17.3 (0.37-105.4) 1.77 (0.16-3.71)
6.5 (5.1-7.6) 11.78 (0.6-43.1) 70.02 (0-258) 4.93 (0.93-13.6)
2.78 (1.0-5.0) 6.74 (1 3-19.6) 0.03 (0-0.1) 4.39 (1.2-16.2) 0.35 (0.04-0 64)
0.71 (0.4-2.3) 85.66 (35.1-162) 0.27 (0 05-0.59) 1.02 (0 2-3) 0.95 (0.18-2.06)
Secchi depth (m) Chlorophyll a (pg I-') Primary production (mg C I-' h - ' ) Exudates ( % primary productlon) Respirat~on(mg O2 1-' d-l)
6.53 (4.0-1 1.0) 2.42 (0.8-6 9) 0.01 (0-0.03) 13.8' (2-31.7) 0.25 (0-0.51)
Total bacteria (10"l) E. col: !colonies/100 ml) 3~-~hymidine-incorporation (PM 1.' h-') W-Leucine-incorporation (PM I-' h-') V, glucose (ng C 1- h-') T, glucose (Oh h-')
1.13 (0.3-3.6) 8.92 (0-63) 6.17 (0.89-15.6) 111.4 (11-337) 56.9 (9-183) 5.47 (0.6-15)
2.28 (0.5-5) 437.6 (0-5000) 32.27 (2.5-84.2) 377 (50-1030) 261.8 (20-794) 16.5 (1.7-32)
17.28 (4.1-53.2) 1475 (0-8775) 108.9 (28.3-253) 1869 (305-6050) 1716 (369-5000) 92.5 (16-183)
7.16 (1.62-22) 40.2 (3.6-105) 0.39 (0-1 79) 7.2 (0.9-31.2) 0.44 (0-2.62) 7.8 (1.1-28)
24.05 (4 5-57) 72.1 (24 8-182) 0.38 (0 14-1 3) 41.2 (9.6-121.2) 0.65 (0.3-1.5) 46.7 (7.8-161.1)
57.3 (12-1.04 4) 157.3 (34.8-442) 1.61 (0.4-4.8) 100.9 (18.4-262) 2.32 (1.5-5.5) 114.7 (20.9-338)
'
H, peptidaseh (pg C I-' h-') H, peptides ( % d-l) H, a-glucosidase (pg C 1-' h-')
H,a-glucosides ( % d.') H,,, P-glucosidase (pg C I-' h-') H, P-glucosides ("h d.')
"In this case from January 1992 to December 1992. b ~ cases n of enzyme activity, n
=
10 or 11 -
a
0
w
8~
3-0
, U7
c
r g b Z P "x
U)
-
8
U SE
W
L
@C
U);
L ' - -
a9,
%%p 5 a-
g
E+?
s*; --
.a - - -
.-
p
'S t i .zm '3 :v
25%
" 5. 5 0
W :
63
G
I.
u a y
'-
.-
E;
'G
"'m
-0
82
2
E ?
g2
0
c m
0
E
-
u 5"
2 g
4
f3
.p F"
L 8
8
Aquat Microb Ecol 15: 1-13, 1998
Inner Fjord / Kiel Bight ratios of annual averages
Fig. 5. Ratios between annual averages (from April 1992 to March 1993, except August and November) of selected variables at the hypertrophic station in the inner Schlei (Stn 1) and the reference station in the K e l Bight (Stn 8), calculated from the averages of the ratios of the monthly observations at the 2 stations. Chl, a = chlorophyll a PP 1-' = primary production I-' Tr Ac. = turnover rate of acetate V, Gluc. = maxlmal velocity of glucose uptake H, a-Gluc.= hydrolysis rate of a-glucosides Tr Gluc. = turnover rate of glucose 3 H - ~ =I tritiated thymldine incorporation H,,, Chitin. = maximal velocity of hydrolysis by chitinases H, p-Gluc. = hydrolysis rate of P-glucosides CFU SW = colony-forming units of marine bacteria CFU bw = colony-forming units of braclush water bacteria
quality) in the entire Schlei (Stns 1 and 7). Many variables showed a steep step from the mouth of the fjord (Stn 7) to the coastal water (Stn 8, Kiel Bight), with the exception of chlorophyll, primary production, respiration, total bacteria numbers, and the maximal hydrolysis rates of a- and P-glucosides. Fig. 5 summarises the ratios of annual average values of variables (obtained from the averages of the ratios of the monthly observations in 1992/93) at the most eutrophic Stn 1 (inner Schlei) and the reference Stn 8 (Kiel Bight). It has to be kept in mind that averages were calculated from measurements of variables per volume of surface water. Only primary production (PP) is presented per volume (PP I-') and also integrated over depth (PP m-2). In the latter case it becomes clearly visible that primary production is limited by turbidity in the ~ n n e rSchlei. Most ratios of enzyme
H, a-Gluc. = maximal velocity of hydrolysis by a-glucosidases 3H-TLI = tritiated leucine incorporation T, Leu. = turnover rate of leucine H, Chitin = hydrolysis rate of chitin TBN = total bacterial numbers H, P-Gluc. = maximal velocity of hydrolysis by P-glucosidases H,,, Peptid. = maximal velocity of hydrolysis by peptidases Turbidity = Secchi depth H, Peptid. = hydrolysis rate of peptides PP m-2 = primary production m-2 MCV = mean cell volume of bacteria
activities were similar or lower than those of bacterial total counts (TBN), substrate uptake and growth (tritiated thymidine incorporation, 3H-TTI) and these were again, lower than those of phytoplanktonic variables (chl a, PP I-'). If the data set of 1991/92 (which was less complete) was used for the calculation of the ratios of annual mean values at the 2 stations, their sequence changed in comparison to the sequence in 1992/93. This was generally attributed to the different weather conditions during the 2 years of investigation.
Particle associated and free bacterial enzyme activities Hypertrophic waters are characterised by high loads of living and detntal particles during the growth
Hoppe et al.. Bacterial substrate decomposition in a eutrophication gradient
season which are more or less colonised by bacteria. One can expect this to be reflected by the spatial and temporal distribution of measured extracellular enzyme activities. H, of protease of attached bacteria (>3 pm, % of total activity) increased together with the particle content of the water during the growth season in the eutrophic part of the fjord, but it was relatively low in comparison to the other enzymes (Table 2). H, of free bacteria (size class >0.2 to < 3 pm) contributed mostly the largest fraction of total protease activity, especially during the cold season; it had an average of 66% of total activity at Stn 1 and a tendency for decrease at Stns 7 and 8 (63.5 and 40.4 % of total activity, respectively). H, of protease in the dissolved fraction ( 3 pm particles (during the growth season) contributed relatively large porTable 2. Contributions (%) of particle size classes to total enzyme activities (100%) at the hypertrophic Stn 1, the eutrophic Stn 7, and the less eutrophic reference Stn 8. H,: maximal velocity of hydrolysis. For values in parentheses the data set was not complete
Stn:
Growth season (Apr-Sep) 1 7 8
H,, protease > 3 pm 37.3 26.3 >0.2toc3pm 54.5 63.6 3 pm 43.2 24.4 >0.2 to 3 pm 52.1 37.9 >0.2 to c 3 pm 42.9 54.3 3 pm 53.8 42.9 36.5 29.0 >0.2 to < 3 pm 9.6 28.1 0.2 to 3 pm fraction were generally higher during the growth season than during the cold season, especially for chitinase activity and chitin turnover (not shown). Substrates for bacterial chitinases as they are provided by small crustaceans and their larvae are a priori particulate. Crustaceans themselves could contribute to chitinase activity by their molting activity (Vrba et al. 1997).This could be a significant factor in the Schlei, because its microzooplankton biomass can surpass bacterial biomass by up to 60 times (Gast 1985).a- and P-glucosides are constituents of originally particulate compounds and were thus also preferentially hydrolysed by attached bacteria. Tracing the seasonality of enzyme activities in a eutrophic water reservoir, Vrba (1992) also found a predominance of particle (2.5 to 100 pm) associated chitinase (up to 60% of total activity) in late summer. Free chitinases (