VOL. 10, NO. 14, AUGUST 2015
ISSN 1819-6608
ARPN Journal of Engineering and Applied Sciences ©2006-2015 Asian Research Publishing Network (ARPN). All rights reserved.
www.arpnjournals.com
CLASSIFICATION BUNDLE BLOCK DETECTION USING MAGNITUDE SQUARED COHERENCE Padmavathi Kora1 and K. Sri Ramakrishna2 1Department 2Department
of Electronics and Communication Engineering, GRIET, India of Electronics and Communication Engineering, VRSEC, India E-Mail:
[email protected]
ABSTRACT This paper conveys a technique for the detection of Bundle Branch Block (BBB) ECG patterns using Magnitude Squared Coherence (MSC) function. The MSC function finds common frequencies between two signals and evaluate the similarity of the two signals. The ECG variation in BBB can observed through the changes in the ECG signal. MSC technique uses Welch method for calculating t h e PSD. For the detection of Normal and BBB beats, MSC output values are given as the input features for the LMNN classifier. Overall accuracy of LMNN classifier is 98.5 percent. The data was collected from MIT/BIH arrhythmia database. Keywords: bundle b lock, MSC, LMNN classifier, Welch method, PSD, MIT-BIH a rrhythmia database.
1. INTRODUCTION Electro-Cardiogram is used to access the functioning of a human heart. The diagnosis of the heart ailments by the doctors is done by following a standard rule set (changes). In this project our aim is to automate the above procedure so that it leads to correct diagnosis. The features talk about different segments of the ECG namely P, Q, R, S, T [1]. Bundle branch block is developed when there is block along the path that electrical pulses travel to make the heart to beat .A condition in which there is a delay in the in the heart lower chambers may be observed through the changes in the ECG. ECG is the cost effective tool for analysing the cardiac abnormalities. Good performance depends on the accurate detection of ECG features. ECG morphological changes in Left Bundle Branch block (LBBB) are:
Increased QRS complex duration (> 0.12 seconds).
Increased Q wave amplitude
Abnormal T wave.
ECG morphological changes in Right Bundle Branch block (RBBB) are: Increased QRS complex duration (> 0.12 seconds).
RSR’ format.
T wave inversion.
of the patient from heart attack. Cardiac arrhythmia detection Using artificial neural networks with selected features are explained in [5], [18]. Statistical methods for feature extraction are explained in [4]. The RR interval, P wave based methods has some limitations [7]. Cross wavelet transform technique is explained in [2], [9] for the detection of IMI. The coherent function can be used for the analysis of different biomedical signals [14]. Coherence between ECG and EEG signals is estimated in [11]. Detection of Bundle Branch Block arrhythmia are explained in [19], [6] using morphological features. Morphological features of certain decease are difficult to be detected. This problem can be solved by using statistical features (Spectral Coherence). Bundle Branch Block signals are easily classified using spectral coherence coefficients. Spectral Coherence coefficients are the simplest and best features for Bundle Branch Block classification and achieve good classification results. In this paper the use of Spectral coherence for discriminating normal and Bindle Branch Block signals are studied. Previously some researcher [13] used the MSC coefficients in several ways as parametric features rather than the original time series signal and achieved better results[13], [14].
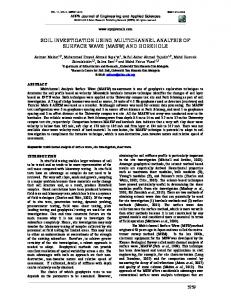
The waveform changes in the different types of ECG beats was shown in the Figure-1, Figure-2, Figure3. Early changes in ECG with Bundle Branch Block [1] are significant because urgent treatment can save the life
5984
VOL. 10, NO. 14, AUGUST 2015
ISSN 1819-6608
ARPN Journal of Engineering and Applied Sciences ©2006-2015 Asian Research Publishing Network (ARPN). All rights reserved.
www.arpnjournals.com 2. PRE-PROCESSING 2.1 Data Table-1. MIH-BIH arrhythmia database.
Figure-1. Normal beat.
File No.
NSR
LBBB
RBBB
100
2237
0
0
101
1858
0
0
103
2080
0
0
106
1505
0
0
109
0
2490
0
111
0
2121
0
118
0
0
2164
123
1513
0
0
124
0
0
1529
207
0
1457
85
The data for the classification was taken from the MIT BIH Arrhythmia Database [15]. Which consists of 5 normal, 3 LBBB and 3 RBBB patients data at 360Hz sampling rate of one hour duration as shown in Table-1.
Figure-2. Left Bundle branch block.
2.2 Noise removal Noise removal is a preprocessing step that removes noise present in ECG signal using filters. In the present study we have used Sgolay FIR filter for the noise removal of ECG signals. 2.3 R Peak detection
Figure-3. Right bundle branch block. Figure-4. R peak detection. R peaks of each ECG file are detected as shown in Figure-4. The distance between two R peaks is called
5985
VOL. 10, NO. 14, AUGUST 2015
ISSN 1819-6608
ARPN Journal of Engineering and Applied Sciences ©2006-2015 Asian Research Publishing Network (ARPN). All rights reserved.
www.arpnjournals.com RR interval. The parameters R peak and RR interval are used to segment the ECG file into beats. The ECG classification flow diagram is as shown in Figure-5.
Table-2. MSC values for normal-normal, normalabnormal.
Figure-5. ECG classification flow diagram. 3. FEATURE EXTRACTION OF ECG SIGNAL Magnitude Squared Coherence (MSC) MSC is a standard method for analysing the level of similarity between two signals in frequency domain. Power Spectral Density (PSD) reveals the information about how energy is distributed in frequency domain. PSD can be calculated by taking FFT on the autocorrelation function [16]. The MSC function finds common frequencies between two signals and to evaluate the correlation of two signals. If the two signals are highly correlated the value of MSC is 1. where 0 MSC value indicates the two signals are uncorrelated. MSC between the x1 and x2 can be calculated using equation 1[16].
Cx1, x 2 ( f )
S x1x 2 ( f ) S x1 ( f ) S x 2 ( f )
Sx1x2(f) is the cross PSD between x1 and x2. Sx1(f)is the PSD of x1. Sx2(f) if the PSD of x2. 0 < Cx1x2 < 1
MSC
N-N
N-LBBB
N-RBBB
1
0.81
0.15
0.13
2
0.91
0.37
0.52
3
0.98
0.46
0.87
4
0.98
0.53
0.50
5
0.97
0.31
0.14
6
0.89
0.02
0.52
7
0.59
0.02
0.19
8
0.58
0.15
0.32
9
0.83
0.22
0.37
10
0.86
0.23
0.40
11
0.86
0.23
0.40
12
0.86
0.23
0.40
13
0.86
0.23
0.40
14
0.86
0.23
0.40
15
0.86
0.23
0.39
16
0.87
0.22
0.41
17
0.86
0.24
0.39
AVG
0.85
0.24
0.40
3.1 Welch method for estimating PSD In the year 1967 Welch made some modifications to the periodogram technique. They are Divide x1(n) in to L sub sequences.
x1(n) is allowed to overlap.
A window w(n) applied to each sub sequence and calculate periodogram of each sub sequence.
Find average periodograms of all L sub sequences.
(1)
x1i (n) x1(n iD)
(2)
n = 0, 1.....,L − 1.
(3)
N L D ( k 1)
(4)
where L=Length of each sub sequence. K=Total number of sub sequences
5986
VOL. 10, NO. 14, AUGUST 2015
ISSN 1819-6608
ARPN Journal of Engineering and Applied Sciences ©2006-2015 Asian Research Publishing Network (ARPN). All rights reserved.
www.arpnjournals.com L-D= Amount of overlapping between successive sub sequences. N=Total length of sequence x1(n). If D=N there is no overlap. For calculating MSC, one ECG cardiac beat from healthy person is considered as normal template. MSC values are calculated for
Normal template- Abnormal beat(LBBB and RBBB)
Normal template-Normal beat
MSC value varies between 0 to 1 as shown in Table 2. For calculating MSC, the above mentioned welch method [17] is used with 30 percent overlapping with hamming window of size 32 samples. So there are 17 MSC output values (features) for the window size of 32 samples. It is observed from the results that Coherence values for Normal to Normal beat are higher than Normal template to Abnormal beat as shown in Table 2.The MSC values for normal template to all the remaining beats are calculated. 4. CLASSIFICATION OF ECG SIGNALS 4.1 Back propagation neural network Back Propagation Neural Network (BPNN) is commonly used in the machine learning applications. BPNN structure made up of interconnected layers. The input layer, hidden layers (one or more) and output layer. The input layer is fed by the external source from outside. Hidden layer provides the internal link between input and output layers. The results of the Neural Network can be taken from the output layer. 4.1.1 Levenberg Marquart neural network In this work for the detection of Bundle Branch Block LM back propagation Neural Network was used. This Neural Network provides rapid execution of the network to be trained, which is the main advantage in the neural signal processing applications [10]. There is no specific rule in finding the number of hidden neurons. The Back propagation neural network is basically designed to minimize the Mean squared error (MSE). Classification accuracy of NN is based on the selection of appropriate feature set, training algorithm and network design. To test the performance of this algorithm, Scalar Conjugate Gradient (SCG) Neural Network and Levenberg Marquardt Neural Network are used. The Levenberg Marquardt algorithm is a robust and very simple method for approximating a function. The Levenberg Marquardt algorithm gives a numerical solution for minimizing a nonlinear function, over a space of parameters. The
network is trained with 50 beats, and tested with 232 beats. The total number of iterations was set to 1000 and mean square error less than 0.001. 5. RESULTS The MSC values are calculated for Normal template to all the 287 beats. These stored values (282 MSC values) of size 287x17(287 patterns each having 17 features) are given as the input features for the LM Neural Network classifier (For Training and Testing). In this work, the Bundle Branch Block is detected by the MSC technique in combination with LM Neural Network classifier. Performance of LM classifier is compared with SCG classifier. The LMNN Classifier gives better accuracy of 98.5 percent as compared to other SCG classifier as shown in Table-3. Table-3. Classifier
Sensitivity
Specificity
Accuracy
LM NN
96.97
98
98.5
SCG NN
86.4
100
94.07
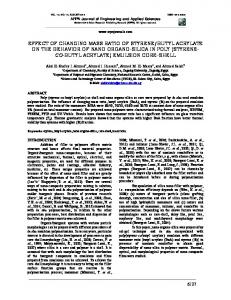
The Coherence values for Normal template to LBBB are low in the QRS complex region as shown in Figure-6 and for Normal template to RBBB the coherence values are low in the T wave region as shown in Figure-7. For the Normal template to Normal signal the MSC values are high in all the regions of ECG signal (P, QRS, T regions) as shown in Figure-8.
Figure-6. Spectral coherence for Normal-LBBB beats.
5987
VOL. 10, NO. 14, AUGUST 2015
ISSN 1819-6608
ARPN Journal of Engineering and Applied Sciences ©2006-2015 Asian Research Publishing Network (ARPN). All rights reserved.
www.arpnjournals.com
TN X 100 TN FP TP Sensitivity= X 100 TP FN TP TN Accuracy= X 100 TP TN FP FN Specificity=
TP(True Positive) = Count of all the correctly classified Normal beats. TN (True Negative) =Count of all beats the correctly classified Abnormal beats. FP (False Positive) = Count of Normal beats which are classified as Abnormal. FN (False Negative) =Count of Abnormal beats which are classified as Normal. Figure-7. Spectral coherence between Normal-RBBB beats.
Figure-9. 3D plot of Spectral coherence values.
Figure-8. Spectral coherence between Normal-Normal beats. In the Figure-9 (3D plot of Spectral Coherence) 1 to 34 values are the coherence values for Normal template to Abnormal(Mixed with LBBB and RBBB) beats showing blue colour indicating low value of MSC and from beats 35 to 119 are showing dark red colour indicating high value of coherence. Again 120 to 287 beats (mixed with LBBB and RBBB) are showing blue colour indicating low value of coherence. The network is trained with 1-50 beats, and tested with 51287 beats. For measuring accuracy two parameters sensitivity and specificity are calculated using the following equations
6. CONCLUSIONS The Levenberg Marquardt Neural Network clearly distinguishes the Left and Right bundle blocks by taking features from the MSC technique. The Levenberg Marquardt Neural Network shows the 98.5 percent accuracy compared to Scaled conjugate decent algorithm as shown in the Table-3. The diagnosis of a human heart is very important. It is a logical decision made by the cardiologist based on certain health indicators and changes of the ECG. If this procedure helps us to automate a certain section or part of the diagnosis then it will help the doctors and the medical community to focus on other crucial sections. This procedure has also increased the accuracy of diagnosis.
5988
VOL. 10, NO. 14, AUGUST 2015
ISSN 1819-6608
ARPN Journal of Engineering and Applied Sciences ©2006-2015 Asian Research Publishing Network (ARPN). All rights reserved.
www.arpnjournals.com REFERENCES [1] L. Schamroth. 1964. An introduction to electrocardiography, Academic medicine. V ol 39, 977. [2] S. Banerjee and M. Mitra. 2014. Application of cross wavelet transform for ecg pattern analysis and classification. IEEE transactions on instrumentation and measurement. 63: 326-333. [ 3 ] B. Swati and M. Mitra. 2012. Cross wavelet transform based analysis of electrocardiogram signals, IJEEC. 1(2): 88-92. [4] H. Chatterjee, R. Gupta and M. Mitra. 2011. A statistical approach for determination of time plane features from digitized ecg, Computers in biology and medicine. 41(5): 278-284. [5] M. Mitra and R. Samanta. 2013. Cardiac arrhythmia classification using neural networks with selected features, Procedia Technology. 10: 76-84.
[11] G. Singh and C. Singh. 2012. Estimation of coherence between ecg signal and eeg signal at different heart rates and respiratory rates, IJIET. 1(5): 159-163. [12] L. S. Sarraf, J. A. Roth and K. M. Ropella. 2002. Differentiation of atrial rhythms from the electrocardiogram with coherence spectra, Journal of electro cardiology. 35(1): 59-67. [13] G. Baselli, S. Cerutti, S. Civardi, D. Liberati, F. Lombardi, A. Malliani and M. Pagani. 1986. Spectral and cross-spectral analysis of heart rate and arterial blood pressure variability signals. Computers and Biomedical Research. 19(6): 520534. [14] C. Zheng, M. Zhou and X. Li. 2008. On the relationship of non parametric methods for coherence function estimation. Signal Processing. 88(11): 2863-2867. [15] www.physi onet.org
[6] S. Bhattacharyya. 2012. Classification of right bundle branch block and left bundle branch block cardiac arrhythmias based on ecg analysis.
[16] J. G. Proakis. 2001. Digital signal processing principles algorithms and application. Pearson Education India.
[7] K. Tateno and L. Glass. 2000. A method for detection of atrial fibrillation using rr intervals, in Computers in Cardiology 2000. IEEE. pp. 391-394.
[17] P. D. Welch. 1967. The use of fast fourier transform for the estimation of power spectra: a method based on time averaging over short, modified periodograms, IEEE Transactions on audio and electro acoustics. 15(2): 70-73.
[8] B. Weng, J. J. Wang, F. Michaud and M. Blanco Velasco. 2008. Atrial fibrillation detection using stationary wavelet transforms analysis, in Engineering in Medicine and Biology Society, 2008. EMBS 2008. 30th Annual International Conference of the IEEE. IEEE. pp. 1128-1131. [9] Grinsted, J. C. Moore, and S. Jevrejeva. 2004. Application of the cross wavelet transform and wavelet coherence to geophysical time series, Nonlinear processes in geophysics. 11(5/6): 561566. [10] M. Ibn Ibrahimy, R. Ahsan, and O. O. Khalifa. 2013. Design and optimization of levenberg marquardt based neural network classifier for emg signals to identify hand motions, Measurement Science Review. 13(3): 142-151.
[18] Benali Radhwane, Reguig Fethi Bereksi, Slimane Zinedine Hadj. 2012. Automatic classification of heartbeats using wavelet neural network,Journal of medical systems. 36(2): 883-892. [19] R. S. Mane, A. Cheeran, V. D. Awandekar, and P. Rani, Cardiac arrhythmia detection by ecg feature extraction, International Journal of Enginnering Research and Applications. 3(2): 327-332. [20] K. Golinska. 2011. Coherence function in biomedical signal processing a short review of applications in neurology, cardiology and gynecology, Studies in Logic, Grammar and Rhetoric. V ol. 25.
5989